News | Market Wraps
Evening Wrap: ASX 200 dips on sagging iron ore, gold stocks, as silver and uranium stocks continue to surge
The S&P/ASX 200 closed 10.1 points lower, down 0.12%.

Mentioned
The S&P/ASX 200 closed 10.1 points lower, down 0.12%.
Weaker iron ore and gold stocks undermined what was otherwise a relatively strong performance today by ASX shares, particularly in light of losses in global equites markets overnight, and of course the catalyst for it all – growing tensions in the Middle East.
On a brighter note, investor favourites silver and uranium stocks were broadly higher today, as their respective commodity prices have experienced strong gains this week. Yesterday, we looked at the uranium price technicals, and today we'll check out the latest daily, weekly, and monthly charts for silver.
To make sense of all the above, I have detailed technical analysis on the Nasdaq Composite, S&P/ASX 200, and Silver in today's ChartWatch.
Be sure to click/scroll through for the usual reporting of the major sector and stock-specific moves, the broker responses to them, as well as all the key economic data in tonight's Evening Wrap.
Let's dive in!
Today in Review
Wed 18 Jun 25, 4:57pm (AEST)
Name | Value | % Chg |
|---|---|---|
Major Indices | ||
| ASX 200 | 8,531.2 | -0.12% |
| All Ords | 8,757.9 | -0.15% |
| Small Ords | 3,249.1 | -0.64% |
| All Tech | 4,038.5 | +0.62% |
| Emerging Companies | 2,275.8 | -1.15% |
Currency | ||
| AUD/USD | 0.6509 | +0.51% |
US Futures | ||
| S&P 500 | 6,002.0 | +0.28% |
| Dow Jones | 42,330.0 | +0.24% |
| Nasdaq | 21,799.25 | +0.32% |
Name | Value | % Chg |
|---|---|---|
Sector | ||
| Information Technology | 2,958.8 | +1.09% |
| Health Care | 41,781.6 | +0.71% |
| Energy | 9,128.8 | +0.65% |
| Communication Services | 1,857.8 | +0.28% |
| Industrials | 8,413.8 | +0.27% |
| Consumer Staples | 12,464.2 | +0.24% |
| Consumer Discretionary | 4,103.1 | +0.21% |
| Financials | 9,284.9 | +0.06% |
| Real Estate | 3,970.8 | -0.39% |
| Utilities | 9,435.9 | -0.98% |
| Materials | 16,014.8 | -1.56% |
Markets
%20intraday%20chart%2018%20Jun%202025.png)
ASX 200 Session Chart
The S&P/ASX 200 (XJO) finished 10.1 points lower at 8,531.2, 0.26% from its session high and 0.13% from its low. The advance/decline line in the broader-based S&P/ASX 300 (XKO) was perhaps a little more indicative of underlying weakness than the 10 point decline in the benchmark, though, as advancers lagged decliners by 112 to 162.
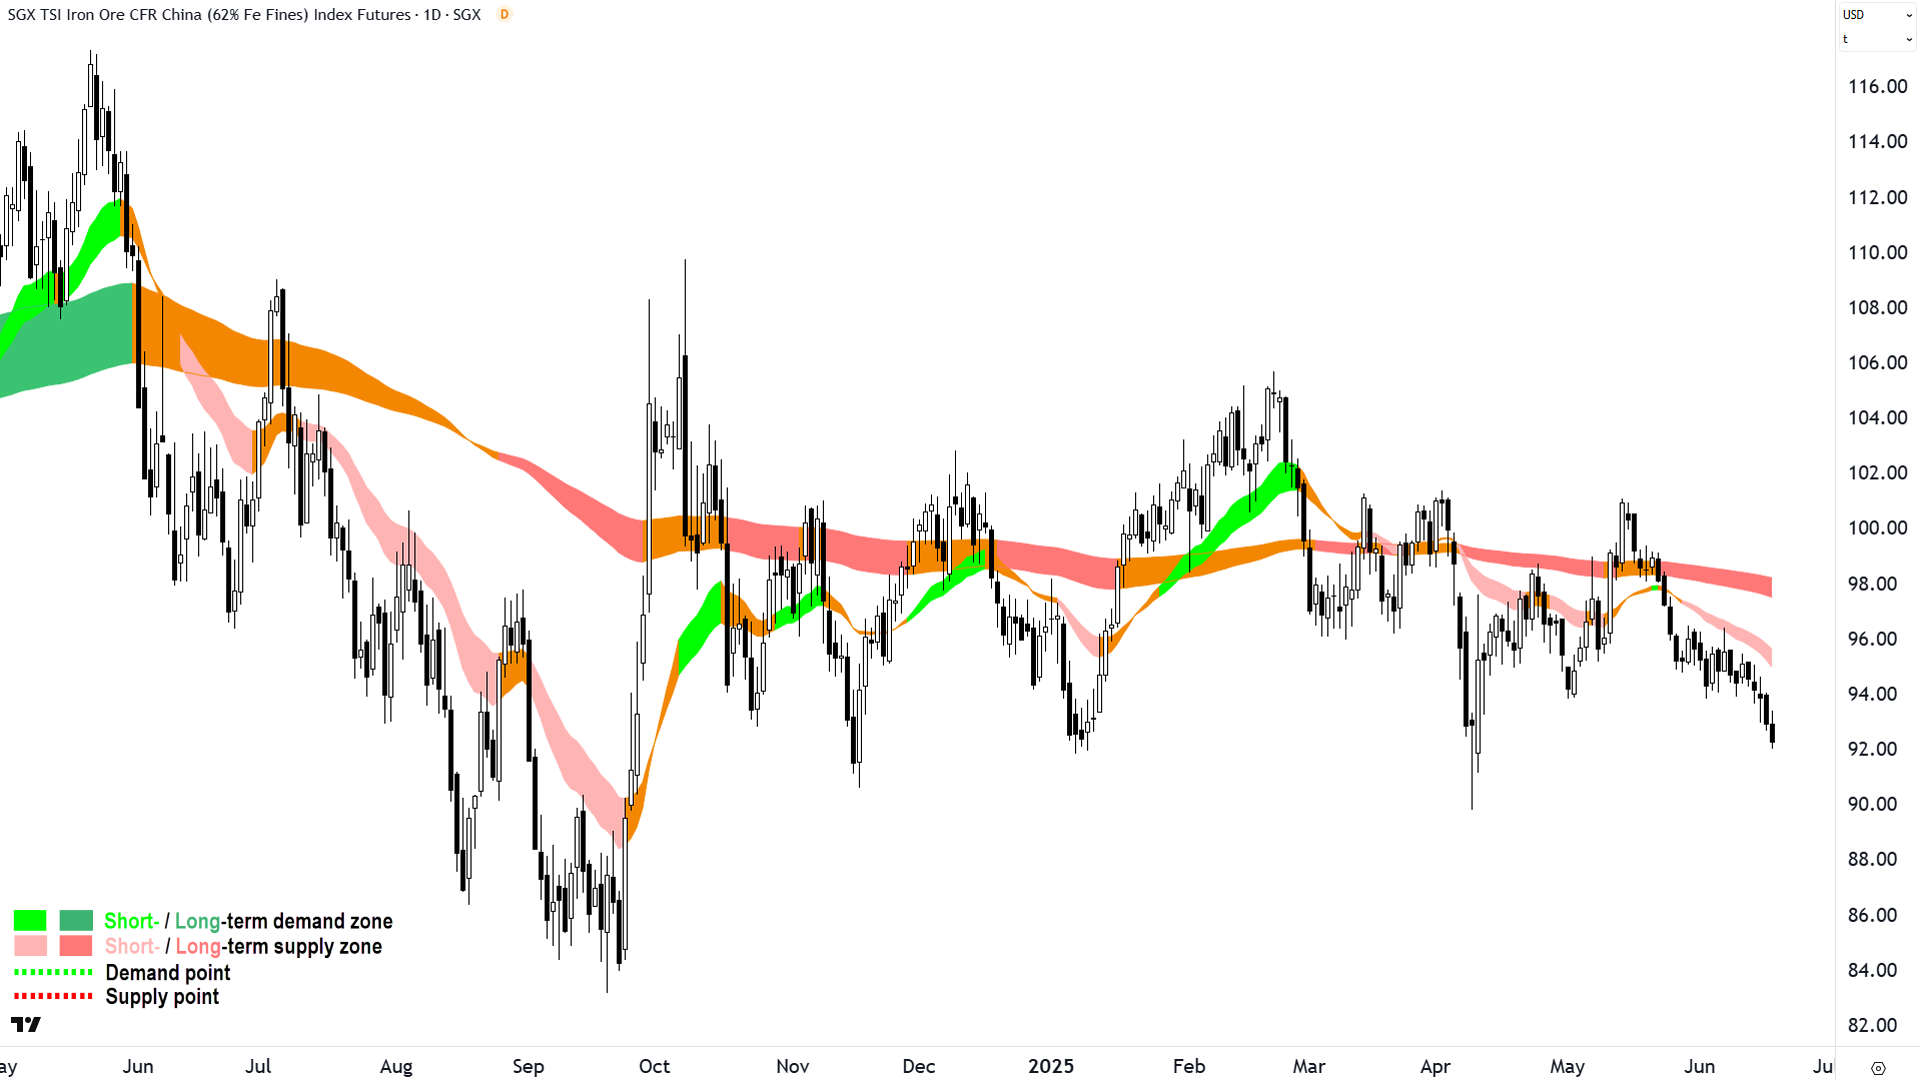
At least there's a good reason for iron ore stocks getting dumped today. The iron ore chart looks lousy, and major broker Citi released a research report in which it downgraded its 12-month price target for the metal to US$90/t.
%20SGX%20chart%2018%20Jun%202025.png)
Iron Ore 62% (Front month, back-adjusted) (click here for full size image)
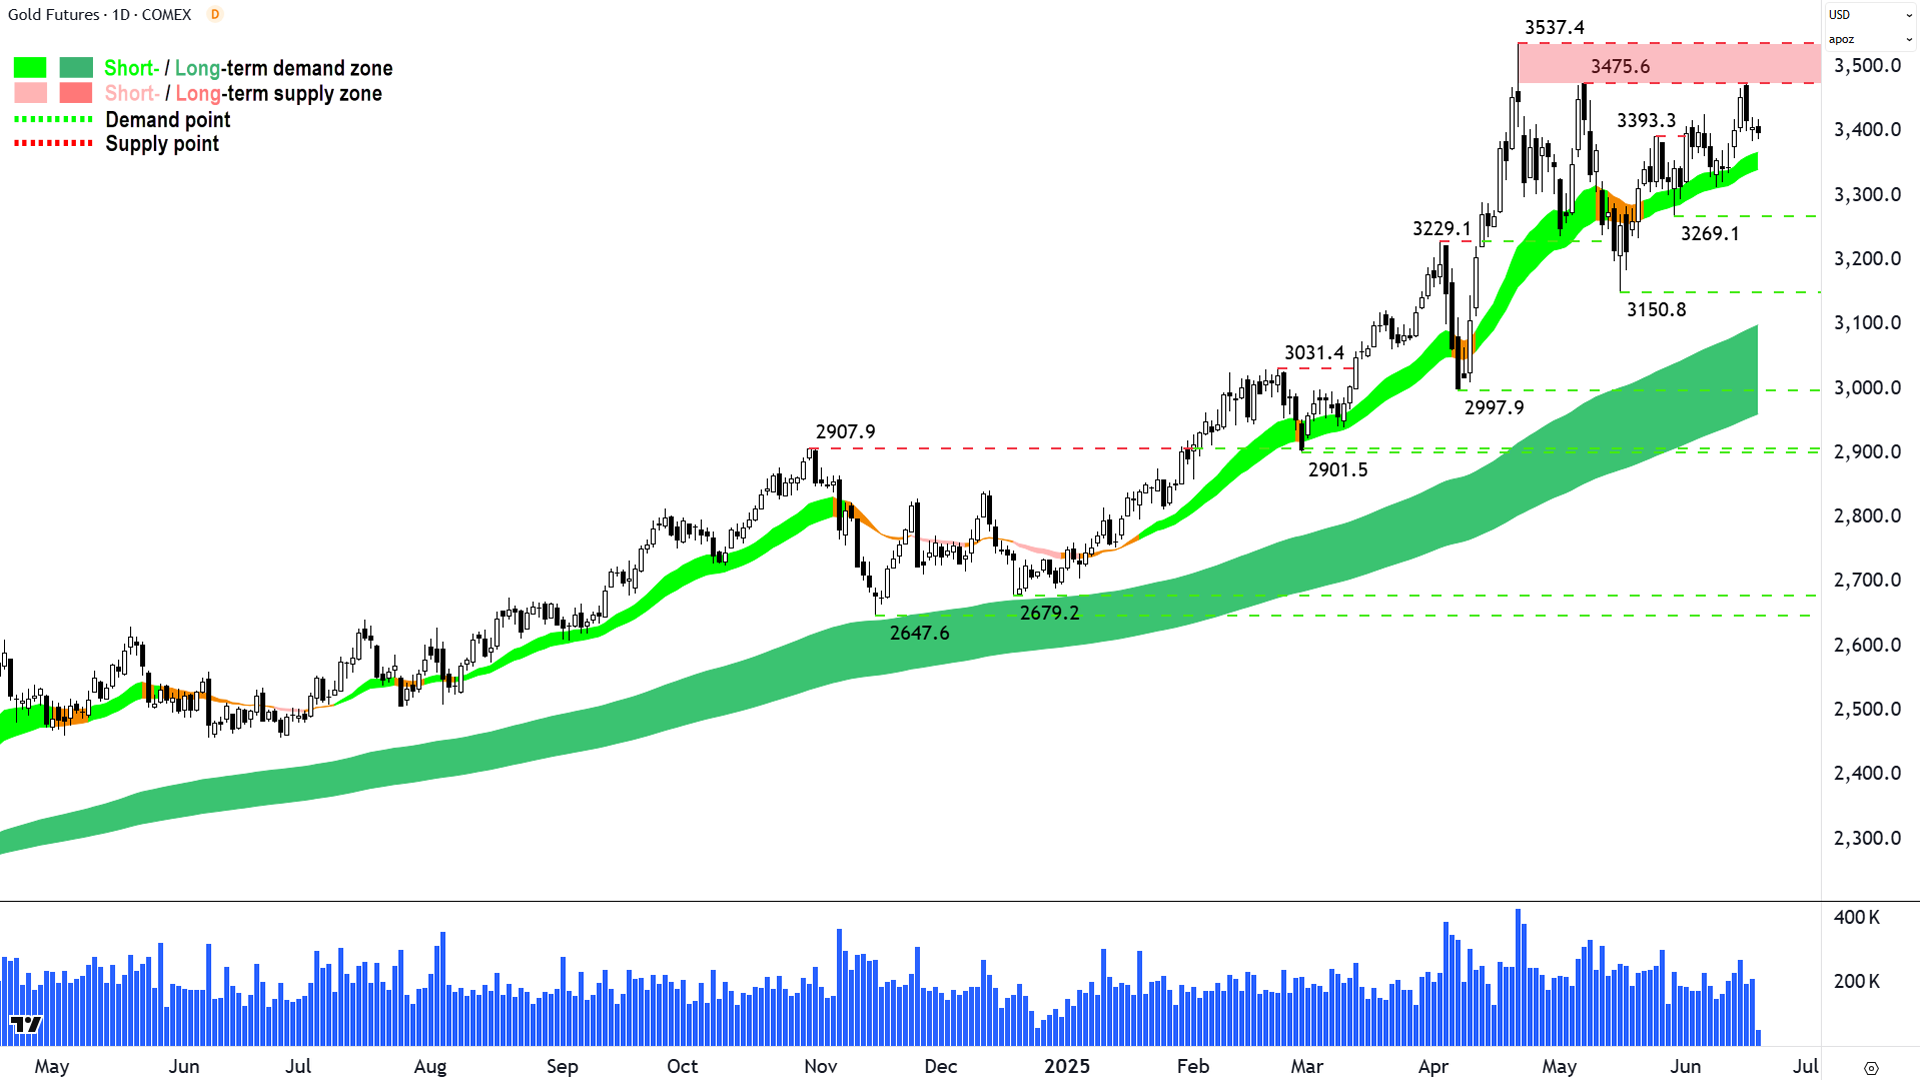
Gold on the other hand, well I get that it too is trading modestly lower over the last 24 hours, but only very modestly so. And, looking at the chart below, unlike iron ore, its overall trend is exemplary. So, why then did the ASX Gold sub-Index (XGD) (-2.3%) get hit today (more than Resources (XJR) (-1.1%) index which contains all the iron ore miners...and gold stocks too, mind you!)?
%20COMEX%20daily%20chart%2018%20Jun%202025.png)
Gold Futures (Front month, back-adjusted) COMEX (click here for full size image)
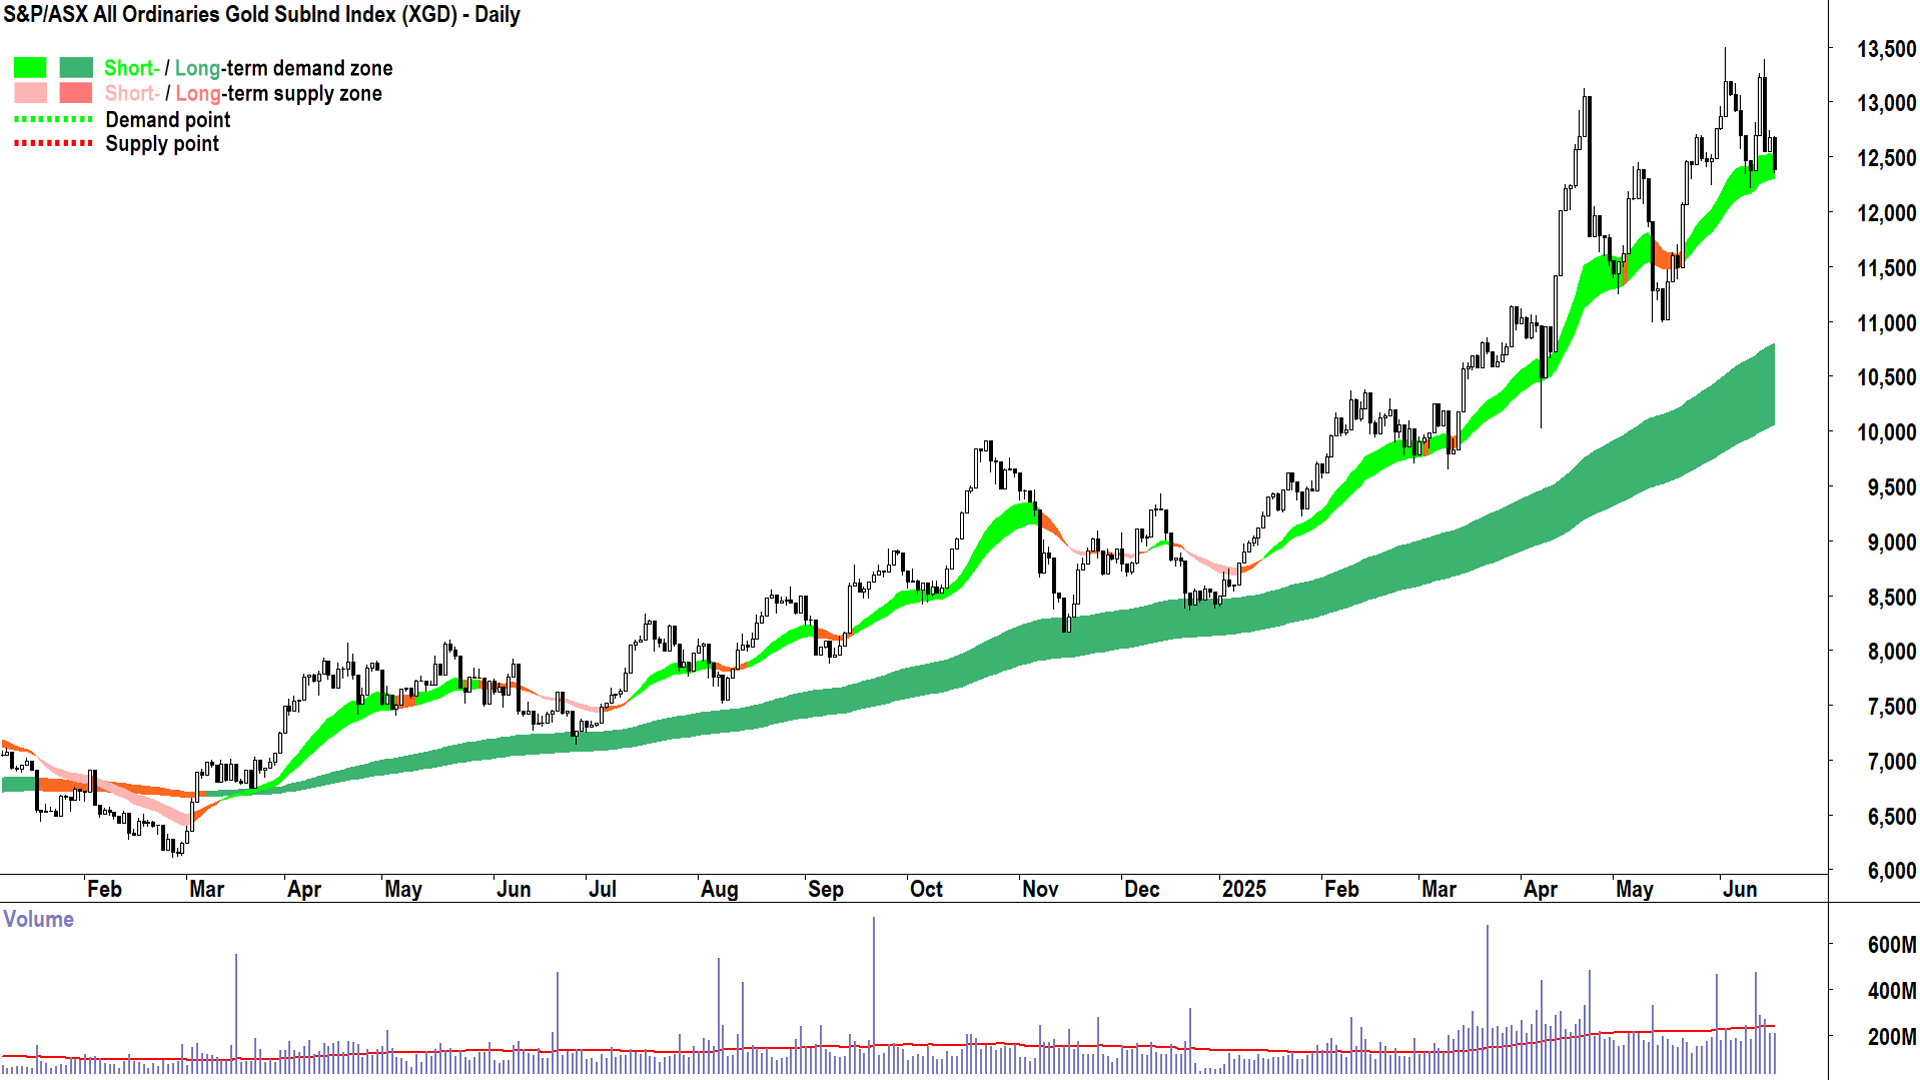
Within the XGD, some stocks, many of which have been in tremendous uptrends, were pummelled (see today's Biggest Losers list below). Something is not quite right with ASX gold stocks. My hunch is that it's all about fund flows. The funds are turning sour on ASX goldies, even without a reversal in the gold price.
At least that's what it seems from the marked underperformance of the XGD chart below – now showing lower peaks and some nasty supply-side candles (i.e., black-bodied and or upward pointing shadows).

S&P/ASX All Ordinaries Gold SubInd Index (click here for full size image)
Overall short and long term uptrends remain intact, sure, but a continued roll confirmed by lower troughs and a close below the short term uptrend ribbon, would be disturbing indeed ⚠️. Moves like this are a stark reminder that commodity stocks don't always trade in line with their respective commodity, and ASX gold stocks are notorious for not doing so.
Not having any of these issues today (perhaps the beneficiaries of the aforementioned "fund flows"), were silver and uranium stocks. We covered the uranium price in yesterday's edition of ChartWatch, and I also did a comprehensive sector technical analysis review today. We'll tackle silver in tonight's edition, below.
ChartWatch
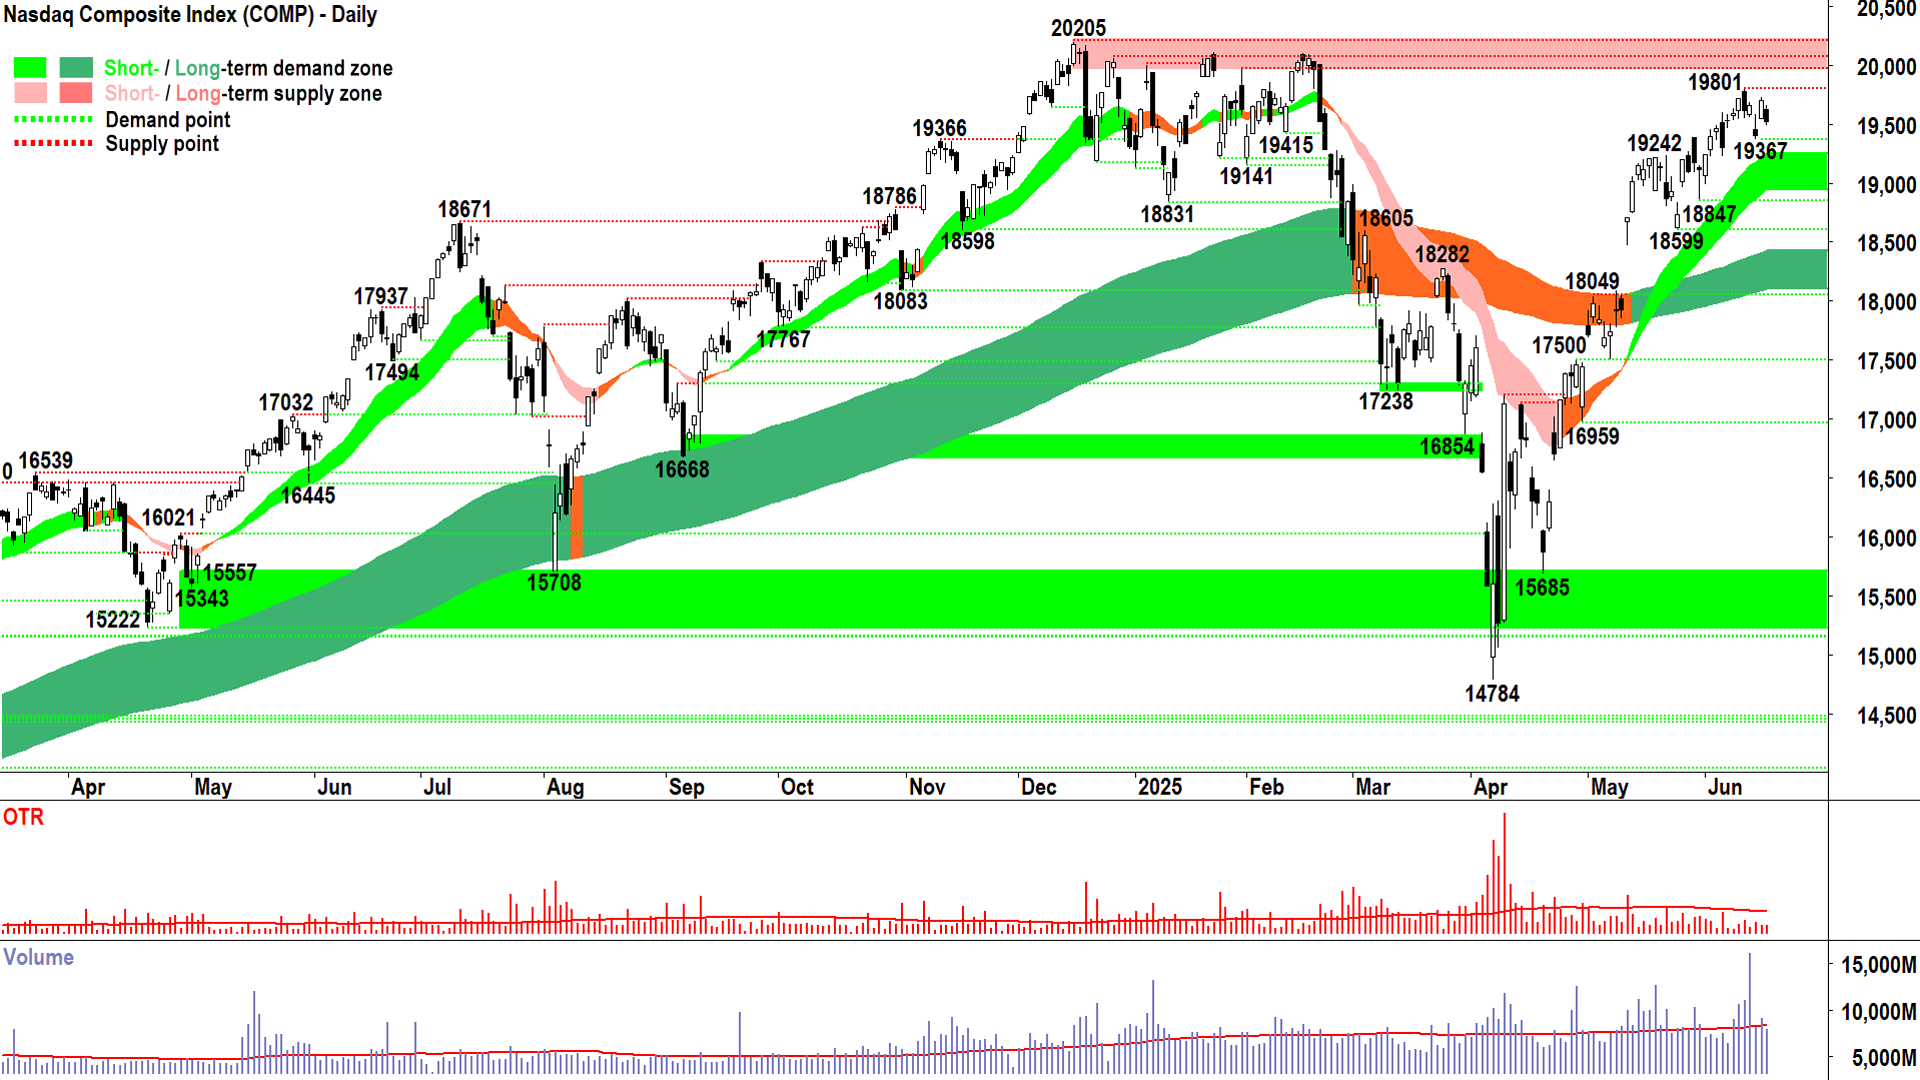
NASDAQ Composite Index

This is ChartWatch 💪! (click here for full size image)
Neither the result I was hoping for nor expecting last night. And that concerns me.
Not because the market didn’t do what I expected it to do – that happens regularly! Just that we really should have seen a stronger showing if we want to continue the prevailing short term uptrend and crack 20205 sooner rather than later.
This is ChartWatch. Not Stuff-Going-On-In-the-Middle-EastWatch (or Stuff-Going-On-In-DT’s-BrainWatch!).
But looking at last night’s reversal, and the general stagnation of the short term uptrend – one can’t help but feel that all the stuff going on in the Middle East is finally causing us to move into an equilibrium phase.
Not a beginning of the end phase. Not an Ooh, ooh, there’s a bear market coming so I better sell everything phase…
Nope, just an “I think there’s a bit more nagging, dare I say – motivated – supply around now than before…and that supply is meeting the otherwise solid demand-side environment and causing prices to move more sideways rather than the steady-up it was doing before” phase.
You know, that phase.
Having said that, I still cannot see anything so sinister in the present Comp technicals to suggest anything but “FRP” here. For those who attended my webinar today, they know this means “Full Risk Position”.
A close below 19367 with a nasty supply-side candle (i.e., long black body and or long upward pointing shadow) will likely change that. A close below the short term uptrend ribbon will definitely change that.
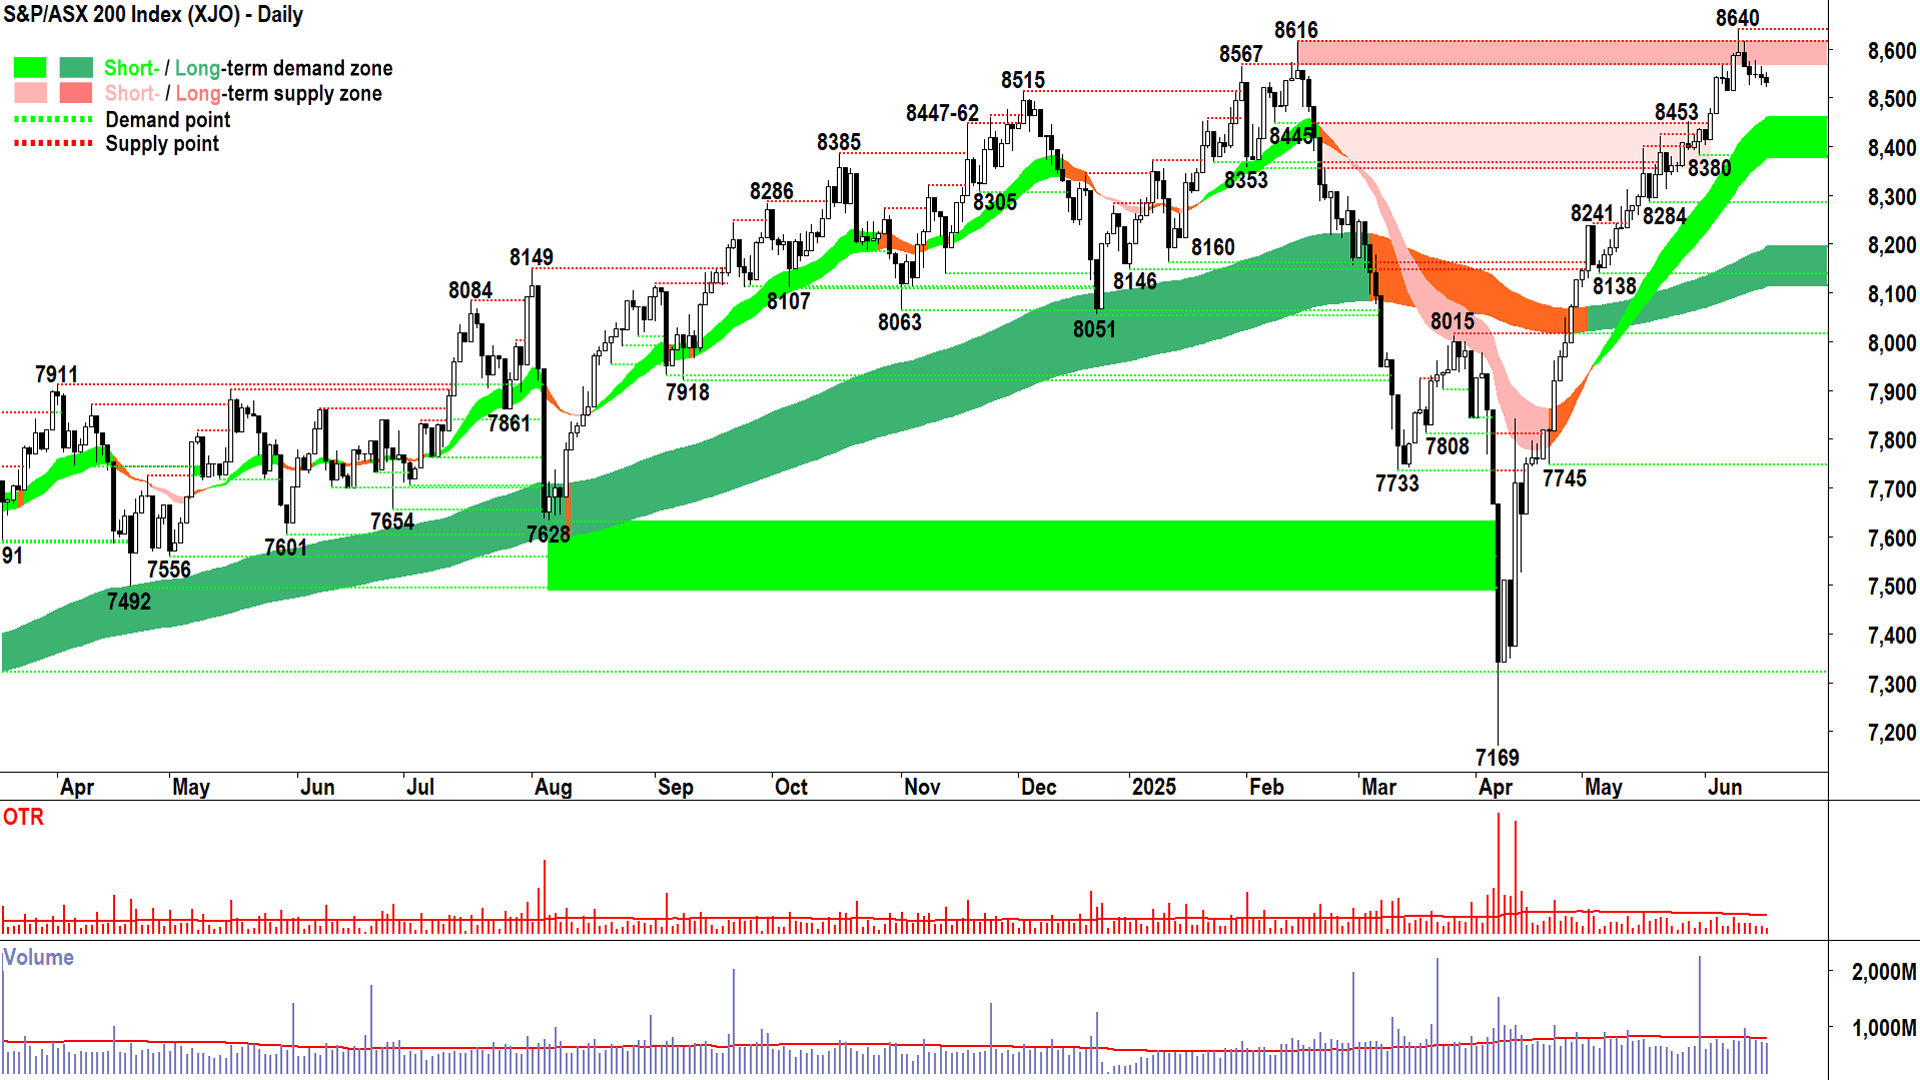
S&P/ASX 200 (XJO)
%20chart%2018%20Jun%202025.png)
Why should we be concerned? 🤔 (click here for full size image)
I know I whinge about our “tin pot” little market quite a bit 😭.
But can I say, it has done a tremendous job over the last few sessions of not reacting with any real downside volatility to the substantial uncertainties that the situation in the Middle East presents.
So, that means the demand-side is happy to hang around on the bid, and more importantly, the supply-side remains in no hurry to exit.
They know everything we know, and more, so if they’re not concerned…then why should we be? 🤔
We shouldn’t. That’s the answer.
As evidence, I refer you to the small, supply-side-ish candles…with the total of the last 5 of them not amounting to more than the gains of the two candles that preceded them.
I reckon that’s pretty solid.
If and when it changes, i.e., if and when the demand and-supply-sides begin to panic, we’ll see the candles and price action to tell us that.
Until then, and as long as it stays all “benign downside volatility”, then I remain happy to stay the course on the XJO.
Silver Futures (Front month, back-adjusted) COMEX
%20COMEX%20daily%20chart%2018%20Jun%202025.png)
This is one of my favourite charts at the moment 😍 (click here for full size image)
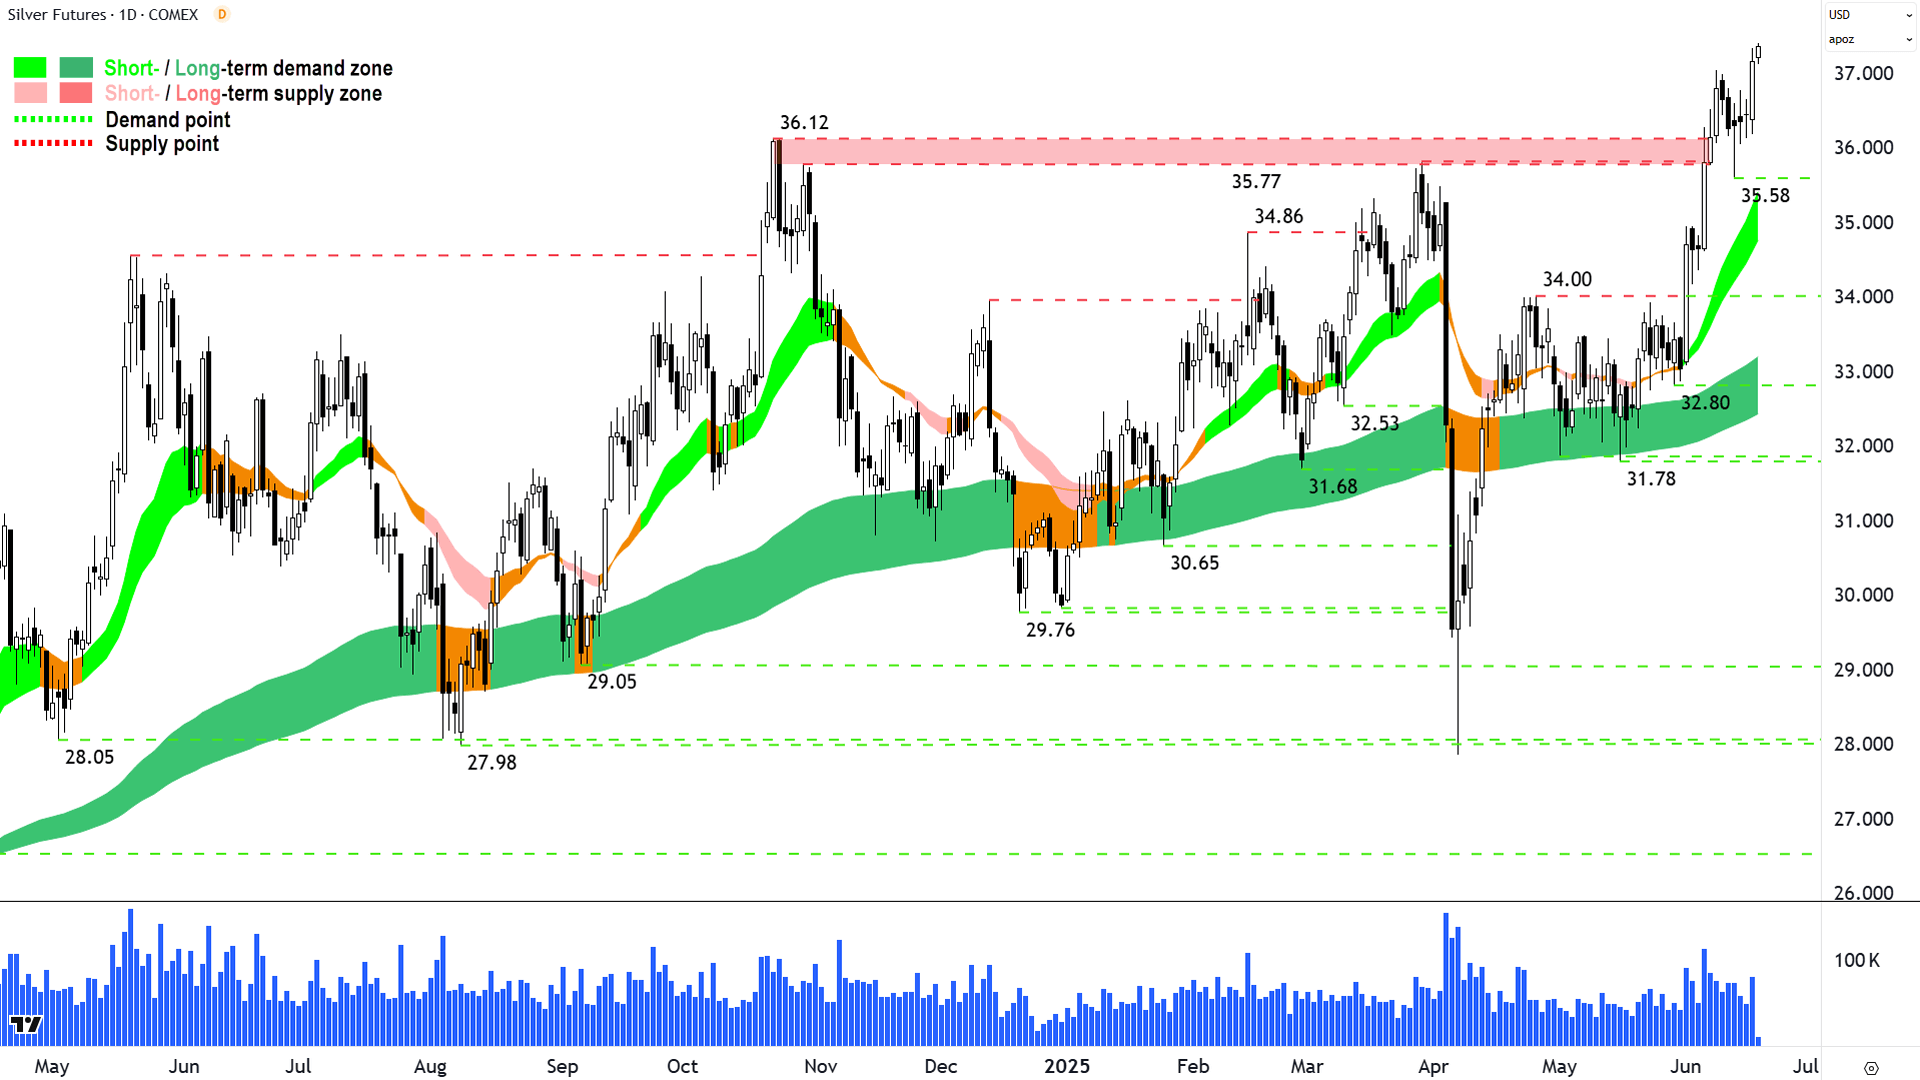
The last time we covered silver was in ChartWatch in the Evening Wrap on 6-Jun.
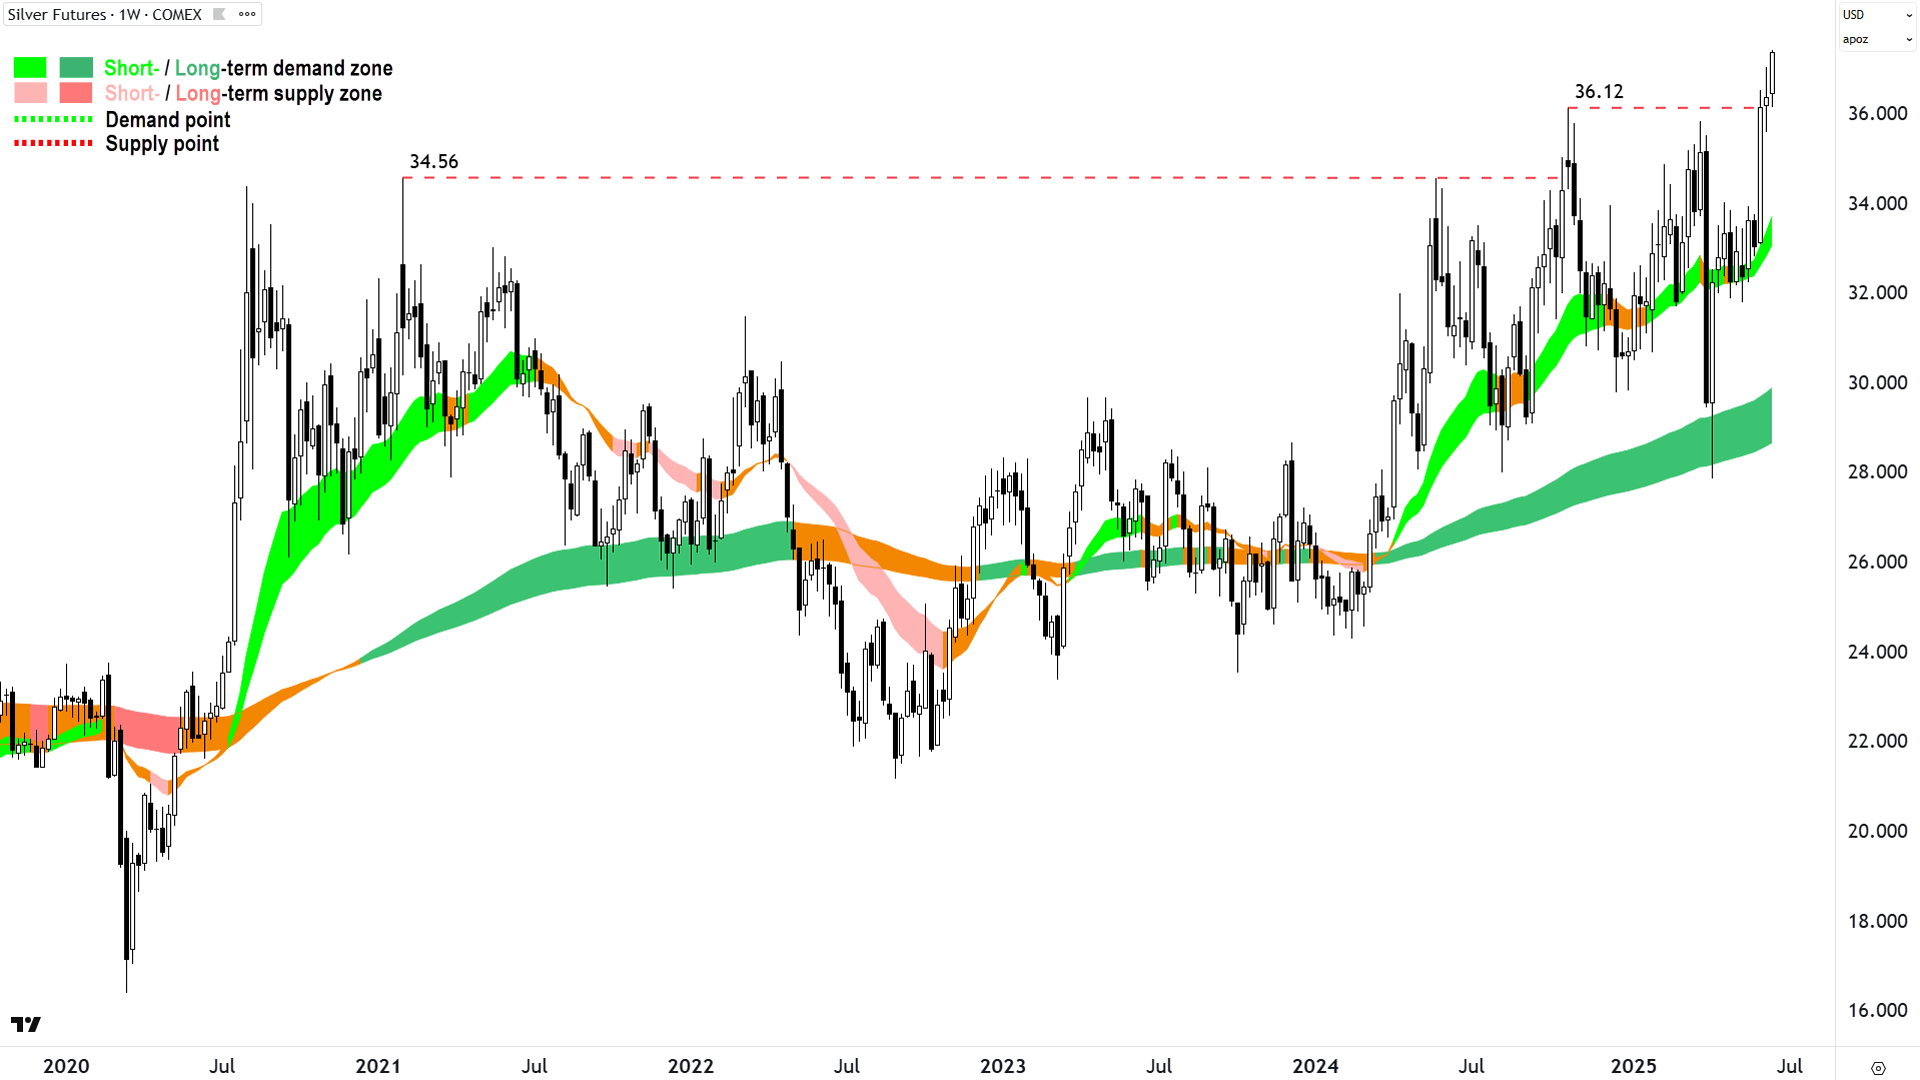
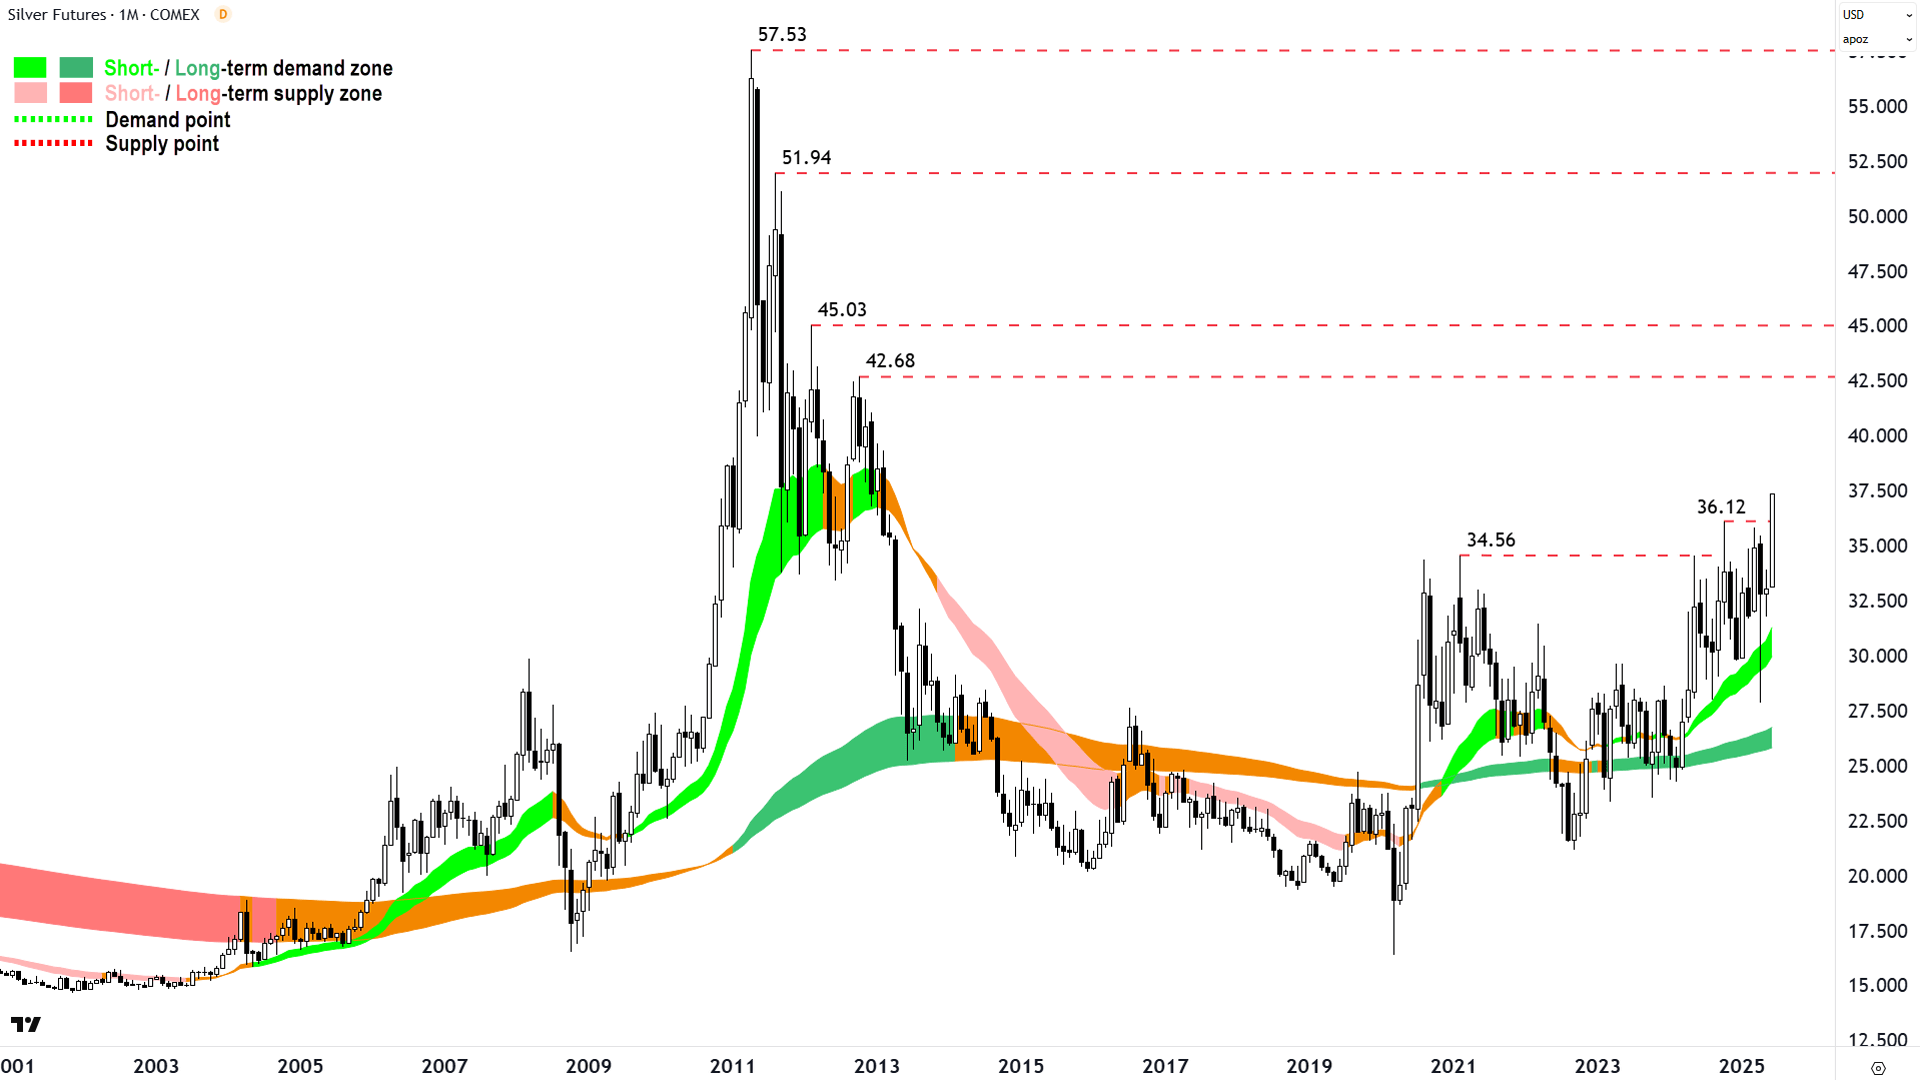
In that update, we noted a strong surge in the silver price to knock exactly the 35.77-36.12 supply zone. I also noted some very juicy weekly and monthly charts that hinted at this being a potentially major breakout.
Nothing goes up in a straight line, and often, some hot money needs to be turfed out before a run can really commence. The shallower the pullback (after a sharp rally), the lesser the supply more generally – but the greater the probability it is exactly only this hot money – and the greater the demand around to meet it.
I think that’s what’s happening in silver. The three candle pullback to 35.58 terminated with a telltale long downward pointing shadow – we know that shadow is pointing to the substantial latent excess demand that resides in the system around the old break out level.
Indeed, as long as 35.77-36.12 continues to behave as a zone of demand (now), this breakout is very much intact. As is the clear demand-side environment more generally given:
Short term uptrend & long term uptrend
Short term uptrend ribbon and long term uptrend ribbon behaving as zones of dynamic demand
Strong price action (rising peaks and rising troughs, but also strong motive phases (up) and shallow pullback phases (down) indicate strong demand and limited supply)
Predominance of demand-side candles, with several massive demand-side showings
This is one of my favourite charts at the moment, and the weekly and monthly charts below are even more tantalising.
%20COMEX%20weekly%20chart%2018%20Jun%202025.png)
Silver Futures (Front month, back-adjusted) COMEX weekly chart (click here for full size image)
%20COMEX%20monthly%20chart%2018%20Jun%202025.png)
Silver Futures (Front month, back-adjusted) COMEX monthly chart (click here for full size image)
But as I always remind you here…as good as something looks today, it can change tomorrow or the next day. We’ll continue to monitor candles, price action and trends here for signs the supply-side is creeping in – but for now – I see none.
Economy
Today
AUS MI Leading Index May: -0.1% vs 0.0% In April
The index ndicates the likely pace of economic activity relative to trend three to nine months into the future
Has shown a significant deterioration since February, with May marking the first below-trend read since September last year.
Matthew Hassaan, Head of Australian Macro-Forecasting at Westpac: "The overall picture is consistent with Australia’s gradual recovery entering a shakier period. Westpac expects GDP growth to reach 1.7%yr by year-end, a sub-par result by historical standards and marked down slightly from a month ago."
Later this week
Wednesday
22:30 USA Building & Housing Permits May (1.43 million and 1.36 million forecast vs 1.41 million and 1.36 million in April respectively)
Thursday
04:00 USA Federal Funds Rate, FOMC Statement & FOMC Economic Projections (no change at 4.5% forecast)
04:30 USA Federal Reserve Chairman Jerome Powell press conference
11:30 AUS Employment Change May (+19,900 forecast vs +89,000 in April; rate unchanged at 4.1%)
ALL DAY USA - US markets closed Thursday for Juneteenth National Independence Day
Friday
11:00 CHN 1-yr & 5-yr Loan Prime Rate (no change at 3.0% and 3.5% respectively forecast)
Saturday
00:00 USA CB Leading Index m/m (-0.1% forecast vs -1.0% previous)
Latest News
Interesting Movers
Trading higher
+63.0% Archtis (AR9) – AR9 Enters UK Market with Defence Industry Award and Suspesion from Quotation.
+45.5% European Lithium (EUR) – CRML secures US$120M LOI for development of Tanbreez Project.
+17.4% Warriedar Resources (WA8) – Ricciardo Drilling Delivers 1,148 g/t Au Intersection, rise is consistent with prevailing short and long term uptrends, a regular in ChartWatch ASX Scans Uptrends list 🔎📈
+17.4% MTM Critical Metals (MTM) – Continued positive response to 17-Jun MTM & Meteoric Sign MOU After Successful REE Testwork, rise is consistent with prevailing short and long term uptrends, a regular in ChartWatch ASX Scans Uptrends list 🔎📈
+13.6% Green Critical Minerals (GCM) – Continued positive response to 17-Jun VHD Graphite Plant Commissioned - Production To Commence, rise is consistent with prevailing short and long term uptrends, a recent regular in ChartWatch ASX Scans Uptrends list 🔎📈
+12.5% Silver Mines (SVL) – No news, general strength across the broader Silver sector today (see ChartWatch for analysis of the silver chart! 🚀), rise is consistent with prevailing short term uptrend and long term trend is transitioning from down to up, a regular in ChartWatch ASX Scans Uptrends list 🔎📈
+12.1% Metal Powder Works (MPW) – No news, rise is consistent with prevailing short term uptrend and rising peaks and rising troughs 🔎📈
+11.3% Unico Silver (USL) – No news, general strength across the broader Silver sector today, rise is consistent with prevailing short and long term uptrends, a recent regular in ChartWatch ASX Scans Uptrends list 🔎📈
+10.5% Cettire (CTT) – Continued positive response to 17-Jun Change in substantial holding (several substantial shareholder notices yesterday indicate some major shifts in holdings long and short among the big funds).
+7.1% The Star Entertainment Group (SGR) – No news (but I note the odd dog or two having its day today!).
+6.7% St George Mining (SGQ) – No news, rise is consistent with prevailing short term uptrend and long term trend is transitioning from down to up 🔎📈
+5.4% EBR Systems (EBR) – EBR Completes A$20.0 million Security Purchase Plan.
+5.3% Viva Energy Group (VEA) – No news, general strength across the broader Energy sector today, rise is consistent with prevailing short term uptrend and rising peaks and rising troughs 🔎📈
+5.1% Lotus Resources (LOT) – Continued positive response to 17-Jun Kayelekera Restart Commissioning Commenced, general strength across the broader Uranium sector today.
+4.8% Bannerman Energy (BMN) – No news, general strength across the broader Uranium sector today.
+4.3% Boss Energy (BOE) – Boss meets FY25 uranium production guidance at Honeymoon, general strength across the broader Uranium sector today, rise is consistent with prevailing short term uptrend and long term trend is transitioning from down to up, a regular in ChartWatch ASX Scans Uptrends list 🔎📈
+4.1% BetaShares Crude Oil Index ETF-Currency Hedged ETF (OOO) – No news, general strength across the broader Energy sector today, Crude Oil ETF.
+3.9% Deep Yellow (DYL) – No news, general strength across the broader Uranium sector today, rise is consistent with prevailing short term uptrend and long term trend is transitioning from down to up, a regular in ChartWatch ASX Scans Uptrends list 🔎📈
Trading lower
-9.2% Antipa Minerals (AZY) – No news, general weakness across the broader Gold sector today.
-8.2% Catalyst Metals (CYL) – Trident infill drilling results and development underway, general weakness across the broader Gold sector today.
-7.4% Minerals 260 (MI6) – No news, general weakness across the broader Gold sector today, fall is consistent with prevailing short and long term downtrends 🔎📉
-7.2% Omni Bridgeway (OBL) – No news 🤔.
-7.1% Dateline Resources (DTR) – No news, general weakness across the broader Gold sector today, today's move is consistent with recent volatility.
-6.1% Brightstar Resources (BTR) – Fish Mine Production and Exploration Update, general weakness across the broader Gold sector today.
-6.1% Pantoro (PNR) – No news general weakness across the broader Gold sector today.
-5.5% IPD Group (IPG) – No news, fall is consistent with prevailing short and long term downtrends, a regular in ChartWatch ASX Scans Downtrends list 🔎📉
-5.3% Lovisa (LOV) – No news 🤔.
-5.2% Core Lithium (CXO) – No news, general weakness across the broader Lithium sector today.
-5.1% MA Financial Group (MAF) – No news 🤔.
-4.8% Black Cat Syndicate (BC8) – No news, general weakness across the broader Gold sector today.
-4.8% Vulcan Energy Resources (VUL) – No news, general weakness across the broader Lithium sector today, fall is consistent with prevailing short and long term downtrends, a regular in ChartWatch ASX Scans Downtrends list 🔎📉
-4.8% Accent Group (AX1) – No news, fall is consistent with prevailing short and long term downtrends, a regular in ChartWatch ASX Scans Downtrends list 🔎📉
-4.6% Spartan Resources (SPR) – Metallurgical test results update, general weakness across the broader Gold sector today.
-4.6% Mineral Resources (MIN) – No news, general weakness across the broader Iron ore and Lithium sectors today, fall is consistent with prevailing long term downtrend 🔎📉
-4.3% West African Resources (WAF) – No news, general weakness across the broader Gold sector today.
-4.0% Fortescue (FMG) – No news, general weakness across the broader Iron Ore sector today, fall is consistent with prevailing short and long term downtrends, a regular in ChartWatch ASX Scans Downtrends list 🔎📉
-4.0% Ramelius Resources (RMS) – No news, general weakness across the broader Gold sector today.
-3.7% Pilbara Minerals (PLS) – No news (apart from Australian Super increasing their stake), general weakness across the broader Lithium sector today, fall is consistent with prevailing short and long term downtrends, a regular in ChartWatch ASX Scans Downtrends list 🔎📉
Broker Moves
ARN Media (A1N)
Retained at Sell at UBS; Price Target: $0.49 from $0.57
Boss Energy (BOE)
Retained at Buy at Ord Minnett; Price Target: $6.00
COG Financial Services (COG)
Retained at Buy at Bell Potter; Price Target: $1.75 from $1.35
Cochlear (COH)
Retained at Hold at Morgans; Price Target: $281.36 from $285.55
Upgraded to Buy from Neutral at UBS; Price Target: $325.00 from $285.00
CSL (CSL)
Retained at Overweight at Jarden; Price Target: $317.61
Retained at Overweight at Morgan Stanley; Price Target: $303.00
Retained at Outperform at CLSA; Price Target: $330.00
Digico Infrastructure REIT (DGT)
Retained at Positive at E&P; Price Target: $4.56 from $5.13
Deep Yellow (DYL)
Retained at Speculative buy at Morgans; Price Target: $1.92 from $1.56
Genesis Minerals (GMD)
Retained at Buy at UBS; Price Target: $5.50 from $4.50
IVE Group (IGL)
Retained at Buy at Bell Potter; Price Target: $3.15 from $3.00
Ingenia Communities Group (INA)
Retained at Buy at Citi; Price Target: $6.50
James Hardie Industries Plc (JHX)
Retained at Neutral at Citi; Price Target: $41.50
Lotus Resources (LOT)
Retained at Speculative buy at Ord Minnett; Price Target: $0.37 from $0.35
Lynas Rare Earths (LYC)
Retained at Buy at UBS; Price Target: $10.40
Macquarie Technology Group (MAQ)
Retained at Positive at E&P; Price Target: $110.18 from $105.34
Meteoric Resources NL (MEI)
Retained at Speculative buy at Ord Minnett; Price Target: $0.20
Mineral Resources (MIN)
Retained at Overweight at Morgan Stanley; Price Target: $35.00
Metcash (MTS)
Upgraded to Buy from Hold at Jefferies; Price Target: $4.20 from $3.80
Neuren Pharmaceuticals (NEU)
Initiated at Outperform at Macquarie; Price Target: $18.60
News Corporation (NWS)
Retained at Buy at UBS; Price Target: $70.00
Oohmedia (OML)
Retained at Buy at UBS; Price Target: $2.00 from $1.65
Nuix (NXL)
Initiated at Sector perform at RBC Capital Markets; Price Target: $2.60
NEXTDC (NXT)
Retained at Positive at E&P; Price Target: $28.36 from $27.76
Paladin Energy (PDN)
Retained at Buy at Ord Minnett; Price Target: $9.50
Redox (RDX)
Retained at Buy at UBS; Price Target: $3.25 from $3.80
Region Group (RGN)
Retained at Buy at Citi; Price Target: $2.40
Santos (STO)
Retained at Buy at UBS; Price Target: $7.90
Seven West Media (SWM)
Retained at Sell at UBS; Price Target: $0.14 from $0.16
Southern Cross Media Group (SXL)
Retained at Neutral at UBS; Price Target: $0.69 from $0.64
Scans
Top Gainers
Code | Company | Last | % Chg |
|---|---|---|---|
| AR9 | Archtis Ltd | $0.22 | +62.96% |
| EUR | European Lithium Ltd | $0.064 | +45.46% |
| NPM | Newpeak Metals Ltd | $0.018 | +38.46% |
| RPG | Raptis Group Ltd | $0.096 | +37.14% |
| SRL | Sunrise Energy Metals Ltd | $0.855 | +31.54% |
Top Fallers
Code | Company | Last | % Chg |
|---|---|---|---|
| BGE | Bridge Saas Ltd | $0.012 | -33.33% |
| JNO | Juno Minerals Ltd | $0.027 | -18.18% |
| ICE | Icetana Ltd | $0.061 | -17.57% |
| SCP | Scalare Partners Holdings Ltd | $0.10 | -16.67% |
| MAT | Matsa Resources Ltd | $0.059 | -15.71% |
52 Week Highs
Code | Company | Last | % Chg |
|---|---|---|---|
| AR9 | Archtis Ltd | $0.22 | +62.96% |
| RPG | Raptis Group Ltd | $0.096 | +37.14% |
| SRL | Sunrise Energy Metals Ltd | $0.855 | +31.54% |
| IXR | Ionic Rare EARTHS Ltd | $0.012 | +20.00% |
| PSC | Prospect Resources Ltd | $0.17 | +19.30% |
52 Week Lows
Code | Company | Last | % Chg |
|---|---|---|---|
| SCP | Scalare Partners Holdings Ltd | $0.10 | -16.67% |
| CLG | Close the Loop Ltd | $0.026 | -13.33% |
| ASQ | Australian Silica Quartz Group Ltd | $0.015 | -11.77% |
| MML | Mclaren Minerals Ltd | $0.023 | -11.54% |
| RBX | Resource Base Ltd | $0.025 | -10.71% |
Near Highs
Code | Company | Last | % Chg |
|---|---|---|---|
| IHD | Ishares S&P/ASX DIV Opportunities Esg Screened ETF | $14.83 | -0.34% |
| YOJ | Yojee Ltd | $0.30 | +1.69% |
| HVN | Harvey Norman Holdings Ltd | $5.35 | -0.56% |
| GLDN | Ishares Physical Gold ETF | $41.51 | +0.31% |
| MVB | Vaneck Australian Banks ETF | $40.71 | +0.27% |
Relative Strength Index (RSI) Oversold
Code | Company | Last | % Chg |
|---|---|---|---|
| OBL | Omni Bridgeway Ltd | $1.29 | -7.19% |
| AX1 | Accent Group Ltd | $1.30 | -4.76% |
| AVH | Avita Medical Inc | $1.59 | -4.79% |
| RIO | RIO Tinto Ltd | $106.00 | -1.07% |
| SDV | Scidev Ltd | $0.265 | +1.92% |
