News | Market Wraps
Evening Wrap: ASX 200 dips as iron ore, lithium, and copper stocks tumble on weaker commodity price leads
The S&P/ASX 200 closed 13.6 points lower, down 0.16%.

Mentioned
The S&P/ASX 200 closed 13.6 points lower, down 0.16%.
On the surface, a quiet day's trade on the Australian share market today, with a narrow loss by the close. But, dig a little deeper, and there was plenty of underlying strength as 8 of the 11 major sectors enjoyed gains.
Technology and Consumer Discretionary stocks were the best, as strong retail sales data for June showed a healthy appetite for electronics. These were joined by Banks and Real Estate stocks, which are still benefiting from lower interest rate expectations in the wake of yesterday's better than expected inflation data.
The laggards were again concentrated in Resources and Energy, as a combination of lower commodities prices and ongoing tariff uncertainty is trimming the past month's gains across both sectors.
To make sense of all the above, I have detailed technical analysis on the Nasdaq Composite, S&P/ASX 200, and Copper in today's ChartWatch.
Be sure to click/scroll through for the usual reporting of the major sector and stock-specific moves, the broker responses to them, as well as all the key economic data in tonight's Evening Wrap.
Let's dive in!
Today in Review
Thu 31 Jul 25, 5:01pm (AEST)
Name | Value | % Chg |
|---|---|---|
Major Indices | ||
| ASX 200 | 8,742.8 | -0.16% |
| All Ords | 8,999.0 | -0.18% |
| Small Ords | 3,338.3 | -0.44% |
| All Tech | 4,269.5 | +1.21% |
| Emerging Companies | 2,365.3 | -1.12% |
Currency | ||
| AUD/USD | 0.6469 | +0.56% |
US Futures | ||
| S&P 500 | 6,454.0 | +0.90% |
| Dow Jones | 44,765.0 | +0.30% |
| Nasdaq | 23,791.25 | +1.32% |
Name | Value | % Chg |
|---|---|---|
Sector | ||
| Information Technology | 3,045.9 | +1.34% |
| Consumer Discretionary | 4,275.8 | +1.11% |
| Financials | 9,432.0 | +0.47% |
| Communication Services | 1,891.5 | +0.43% |
| Real Estate | 4,020.5 | +0.21% |
| Health Care | 45,370.2 | +0.08% |
| Consumer Staples | 12,165.5 | +0.04% |
| Industrials | 8,482.6 | +0.02% |
| Utilities | 9,609.0 | -0.03% |
| Energy | 9,170.4 | -0.46% |
| Materials | 16,503.3 | -2.56% |
Markets
%20intraday%20chart%2031%20Jul%202025.png)
ASX 200 Session Chart
The S&P/ASX 200 (XJO) finished 13.6 points lower at 8,742.8, 0.48% from its session low and just 0.16% from its high. In the broader-based S&P/ASX 300 (XKO) advancers lagged decliners by a narrow 127 to 142.
When I left for my holiday at the end of June, there was a well entrenched and familiar pattern playing out in the Aussie market of rotation out of Resources (XJR) and Energy (XEJ) and into Technology (XIJ), Consumer Discretionary (XDJ), and particularly Financials (XFJ). For the month I was away, this trend appeared to reverse, with the XJR and XEJ staging sharp turnaround rallies.
It is of course pure coincidence and nothing to do with my extra-Market Index activities, that the recent resurgence in the XJR and XEJ has now stalled. The XJR is the worse off of the two this week, culminating in today's 2.2% / long black candle drubbing.
%20chart%2031%20Jul%202025.png)
ASX 200 Resources Sector Index (XJR)
Lower commodities prices were to blame (not me!), as base metals and energy commodities prices were generally lower overnight, and the prices of iron ore and lithium were lower today in Asian trade – the latter was down over 4% in China. Add in major turbulence in the copper market due to tariff developments (see ChartWatch and News), and it was all a bit too much for resources investors today.
But, putting aside these poor performances, there was still plenty to cheer as investors chose to buy the dip in Tech, Discretionary, Financials and Real Estate. When it comes to the Aussie stock market, the rising tide rarely lifts all ships... but nor does that really matter as long as the stuff that is being lifting adds more points than the stuff that isn't!
Company | Last Price | Change $ | Change % | 1mo % | 1yr % |
|---|---|---|---|---|---|
Life360 (360) | $40.16 | +$1.26 | +3.2% | +22.7% | +149.0% |
Aristocrat Leisure (ALL) | $70.04 | +$1.61 | +2.4% | +4.6% | +29.9% |
Fisher & Paykel Health (FPH) | $34.09 | +$0.66 | +2.0% | -0.8% | +18.3% |
Technology One (TNE) | $41.08 | +$0.78 | +1.9% | +0.8% | +109.7% |
Pinnacle Investment (PNI) | $22.38 | +$0.4 | +1.8% | +11.2% | +40.5% |
Telix Pharmaceuticals (TLX) | $21.05 | +$0.37 | +1.8% | -15.0% | +6.3% |
Hub24 (HUB) | $106.65 | +$1.68 | +1.6% | +18.9% | +121.6% |
REA Group (REA) | $239.48 | +$3.71 | +1.6% | -0.2% | +19.1% |
Nextdc (NXT) | $14.51 | +$0.22 | +1.5% | +2.3% | -13.1% |
Car Group (CAR) | $38.18 | +$0.51 | +1.4% | +1.9% | +10.4% |
JB HI-FI (JBH) | $111.70 | +$1.43 | +1.3% | -0.9% | +70.2% |
Wesfarmers (WES) | $85.75 | +$1.01 | +1.2% | +0.5% | +20.1% |
National Australia Bank (NAB) | $38.91 | +$0.44 | +1.1% | -1.1% | +2.7% |
Downer EDI (DOW) | $6.91 | +$0.07 | +1.0% | +8.0% | +40.4% |
Steadfast Group (SDF) | $5.95 | +$0.06 | +1.0% | -0.5% | -7.5% |
Wisetech Global (WTC) | $119.38 | +$1.18 | +1.0% | +9.0% | +29.7% |
Suncorp Group (SUN) | $20.96 | +$0.2 | +1.0% | -2.7% | +22.0% |
Today's best blue chip gainers
Company | Last Price | Change $ | Change % | 1mo % | 1yr % |
|---|---|---|---|---|---|
Flight Centre (FLT) | $11.94 | -$0.94 | -7.3% | -7.0% | -44.7% |
Mineral Resources (MIN) | $28.59 | -$2.19 | -7.1% | +26.1% | -47.1% |
Pilbara Minerals (PLS) | $1.605 | -$0.12 | -7.0% | +17.2% | -45.0% |
IGO (IGO) | $4.43 | -$0.21 | -4.5% | +7.0% | -21.9% |
Sandfire Resources (SFR) | $10.64 | -$0.47 | -4.2% | -5.8% | +26.4% |
Rio Tinto (RIO) | $111.70 | -$4.11 | -3.5% | +3.1% | -3.6% |
Whitehaven Coal (WHC) | $6.44 | -$0.2 | -3.0% | +14.8% | -15.6% |
Evolution Mining (EVN) | $7.11 | -$0.22 | -3.0% | -9.1% | +81.4% |
Perseus Mining (PRU) | $3.27 | -$0.1 | -3.0% | -6.0% | +26.7% |
Bluescope Steel (BSL) | $23.77 | -$0.65 | -2.7% | -0.7% | +9.9% |
South32 (S32) | $2.94 | -$0.08 | -2.6% | -5.8% | -2.6% |
James Hardie (JHX) | $41.31 | -$1.09 | -2.6% | -3.8% | -23.4% |
Lynas Rare Earths (LYC) | $10.47 | -$0.27 | -2.5% | +25.5% | +68.3% |
BHP Group (BHP) | $39.25 | -$0.97 | -2.4% | +5.5% | -6.7% |
Fortescue (FMG) | $17.77 | -$0.42 | -2.3% | +11.3% | -12.7% |
Northern Star (NST) | $15.57 | -$0.35 | -2.2% | -17.0% | +11.5% |
Treasury Wine (TWE) | $7.57 | -$0.16 | -2.1% | -5.0% | -39.0% |
Today's worst blue chip losers
ChartWatch
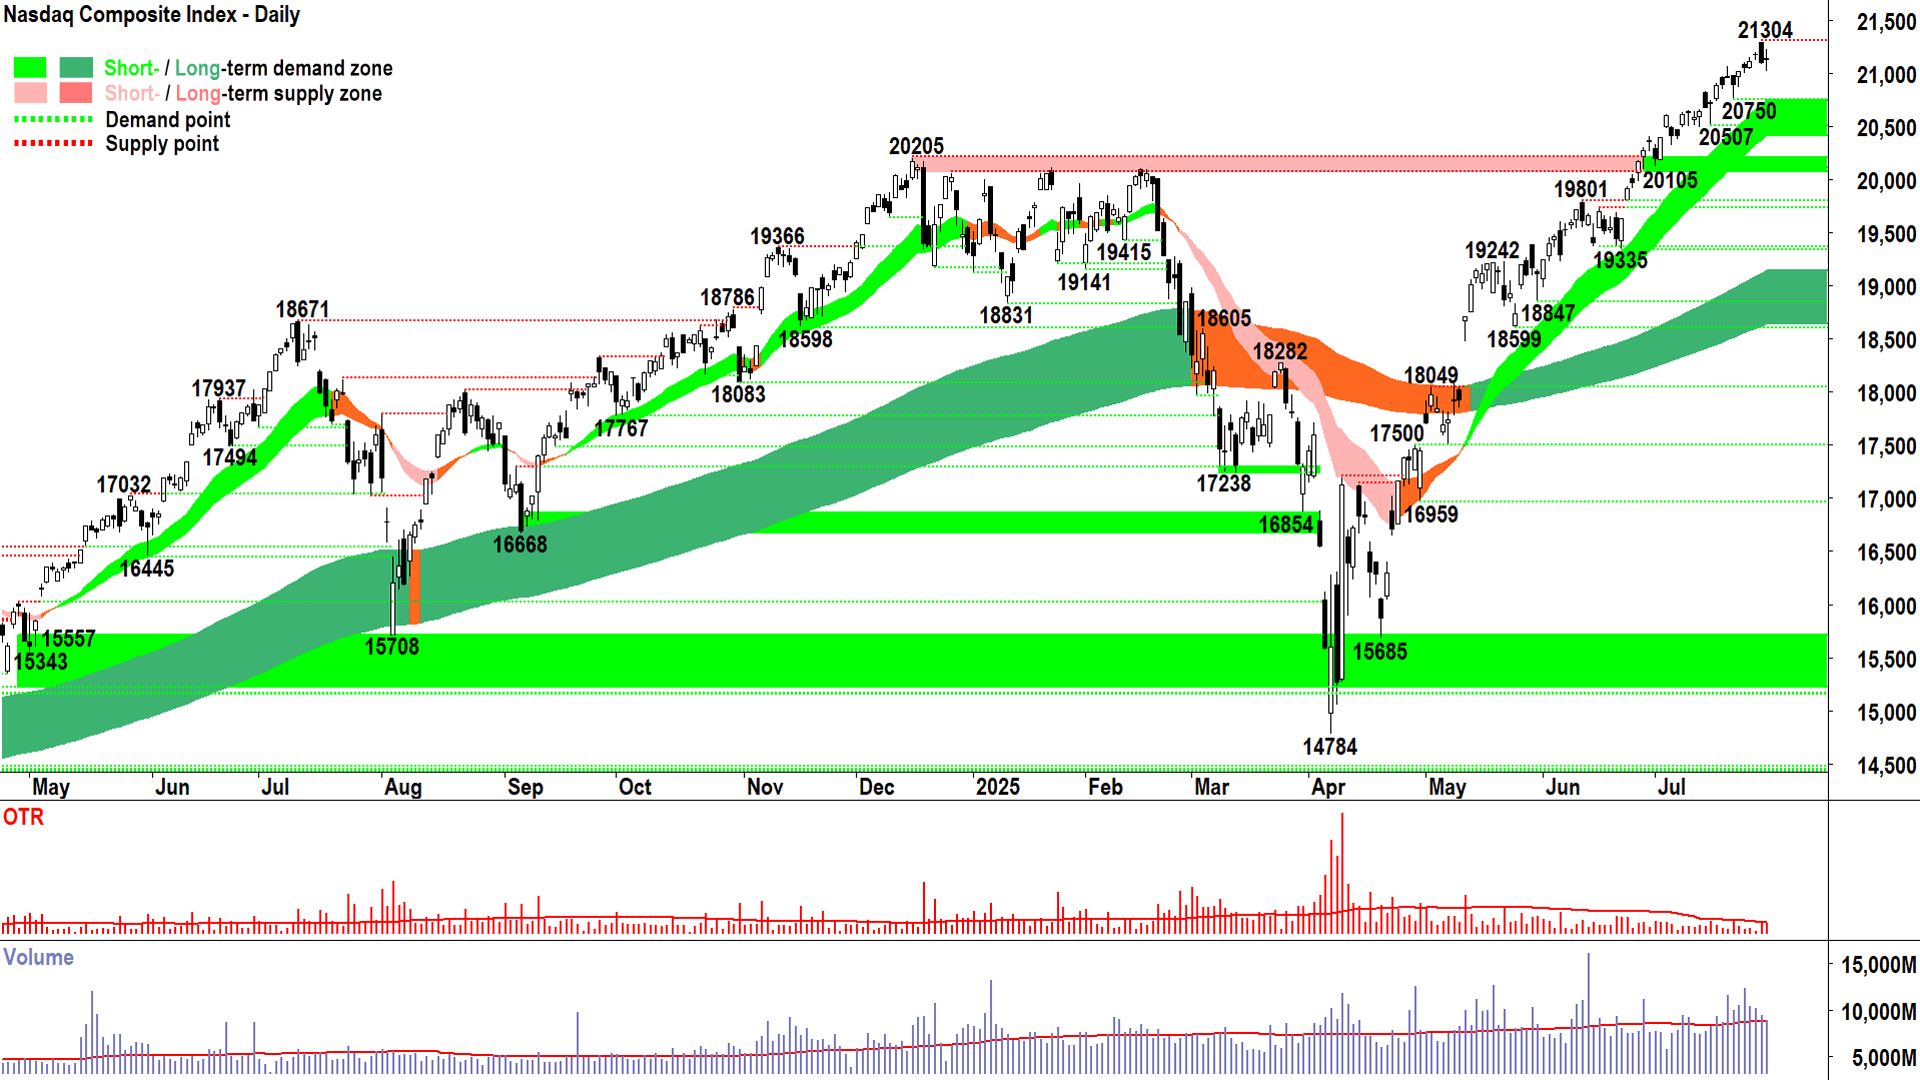
NASDAQ Composite Index

A dodgy doji! (click here for full size image)
Wednesday’s candle was far from the definitive demand-or-supply-sided signal we were wanting!
It is a “doji”, i.e., a candle with a small/no body and roughly equal upward and downward pointing shadows.
Doji’s represent indecision in the demand-supply environment. The upward shadow tells us that there was latent excess supply in the system at higher prices, while the downward shadow tells us that there was also latent excess demand in the system at lower prices.
By the close, neither the demand nor the supply-side’s could wrestle control of the price, and we closed roughly in the middle of the day’s trading range.
There’s a couple of points to note here:
Doji’s are just a candle… we should never overstate their importance against the broader technicals of trend, price action and broader candle picture.
The real value in doji’s, is the fact they represent indecision, and indecision is the opposite of what trend traders are looking for (we want consensus!!!)
We really wanted an emphatic response from the demand-side to Tuesday’s challenge, and unfortunately, we didn’t get it. We ended up with a lower high and a lower low on the session, and this sets 21304 as a minor point of supply.
So, net-net, I’d say the supply-side narrowly won the day on Wednesday. Still, given those “broader technicals”, they’re clearly up against it when it comes to turning the pervasive tide of demand-side control.
Wednesday’s dodgy little doji leaves us a smidge more cautious, but far from adjusting risk settings just yet. The Comp’s short and long term uptrends, as well as rising peaks and rising troughs price action remains intact.
20750 is shaping as an important point of demand as it is now coinciding perfectly with the dynamic demand we expect at the short term uptrend ribbon.
In conclusion, we’re still waiting for a clear supply-side candle to confirm the need for greater caution, a lower peak to 21304 would also be signal the supply-side is growing in power. Naturally, a close below 20750/short term uptrend ribbon is a big red flag.
Until we see any of these, I am happy to stay the course on the Comp.
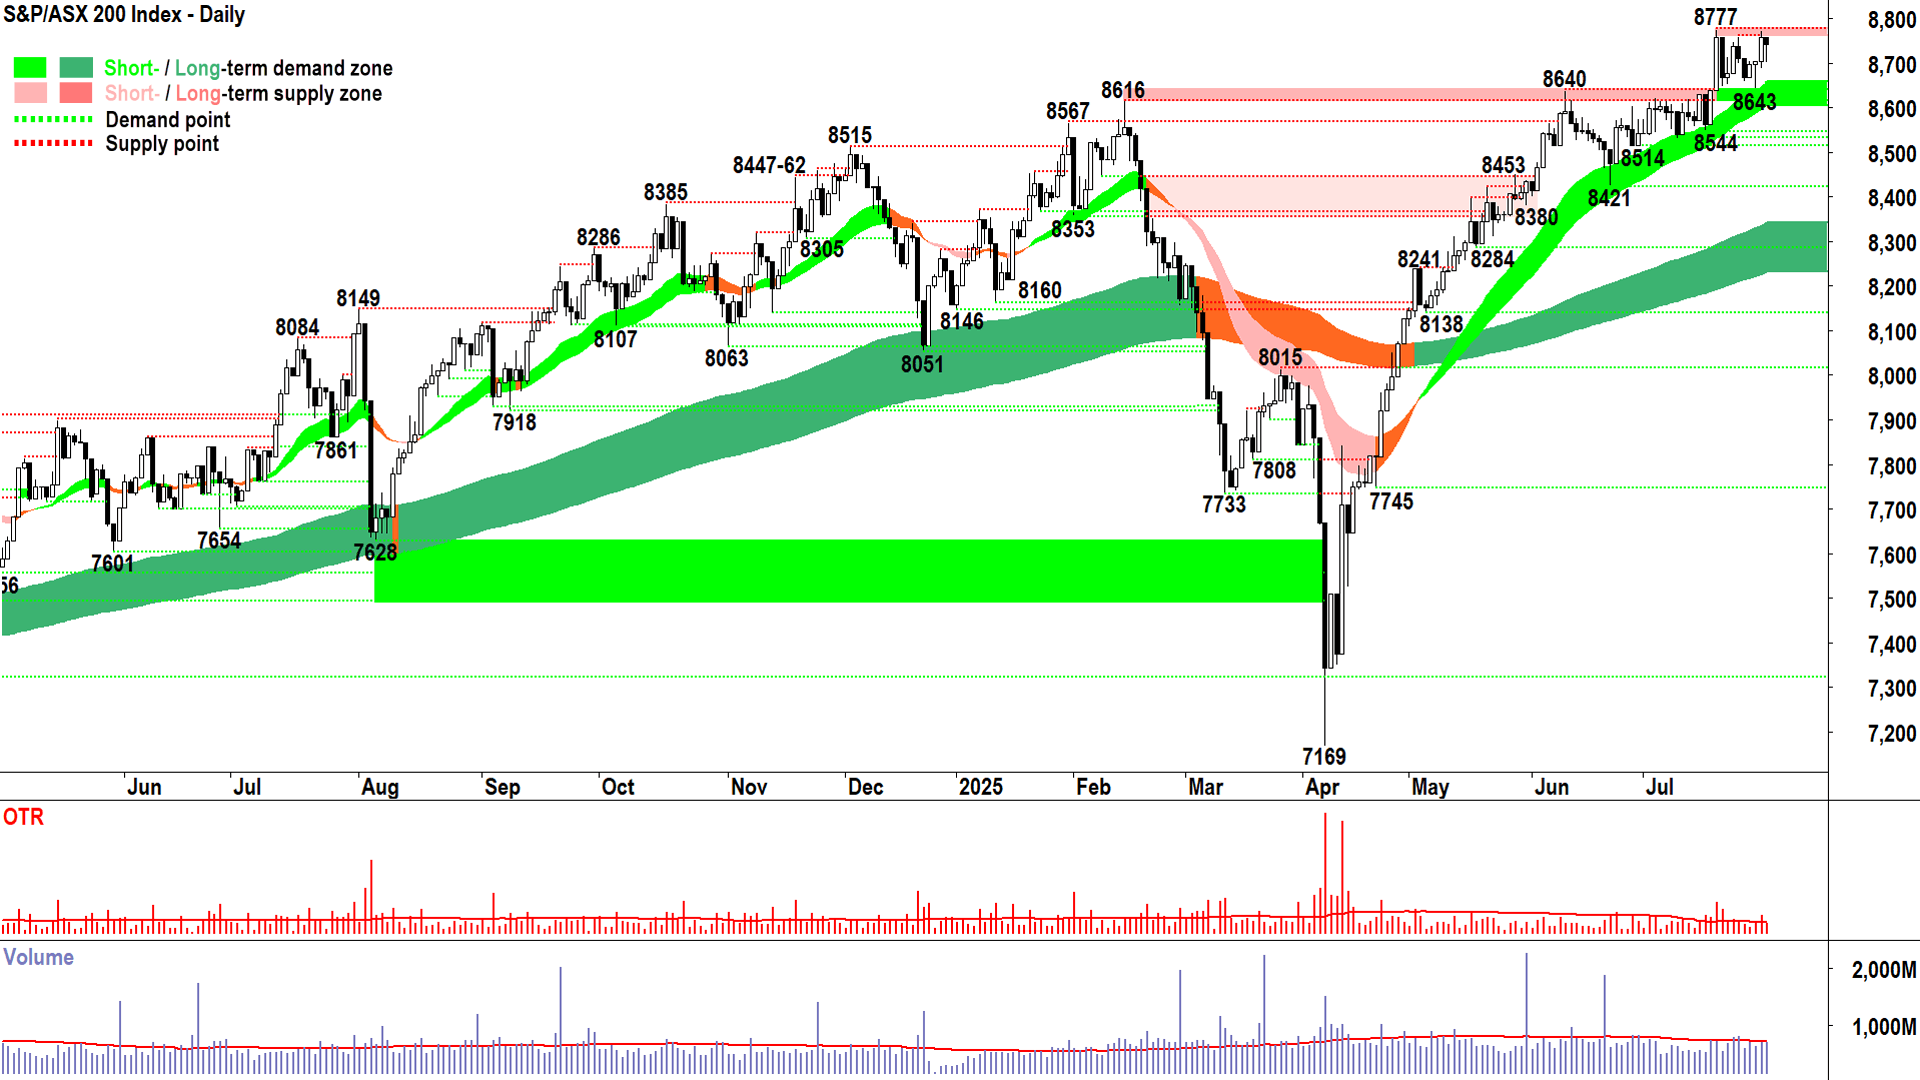
S&P/ASX 200 (XJO)
%20chart%2031%20Jul%202025.png)
Holding pattern (click here for full size image)
Nothing of any major note to update here either. Today’s downward pointing shadow is in keeping with the prevailing environment of demand-side control – i.e., a buy the dip mentality of market participants.
8643 is the most relevant point of demand, and it sits within the dynamic short term uptrend ribbon (the bottom of which presently sits at 8605). So then, I propose that as long as the price continues to close above 8605-8643 the short term uptrend remains intact.
Everything else, (i.e., trends, price action, and candles) remains supportive of the continuation of the prevailing demand-side controlled environment. Stay the course 🚢!
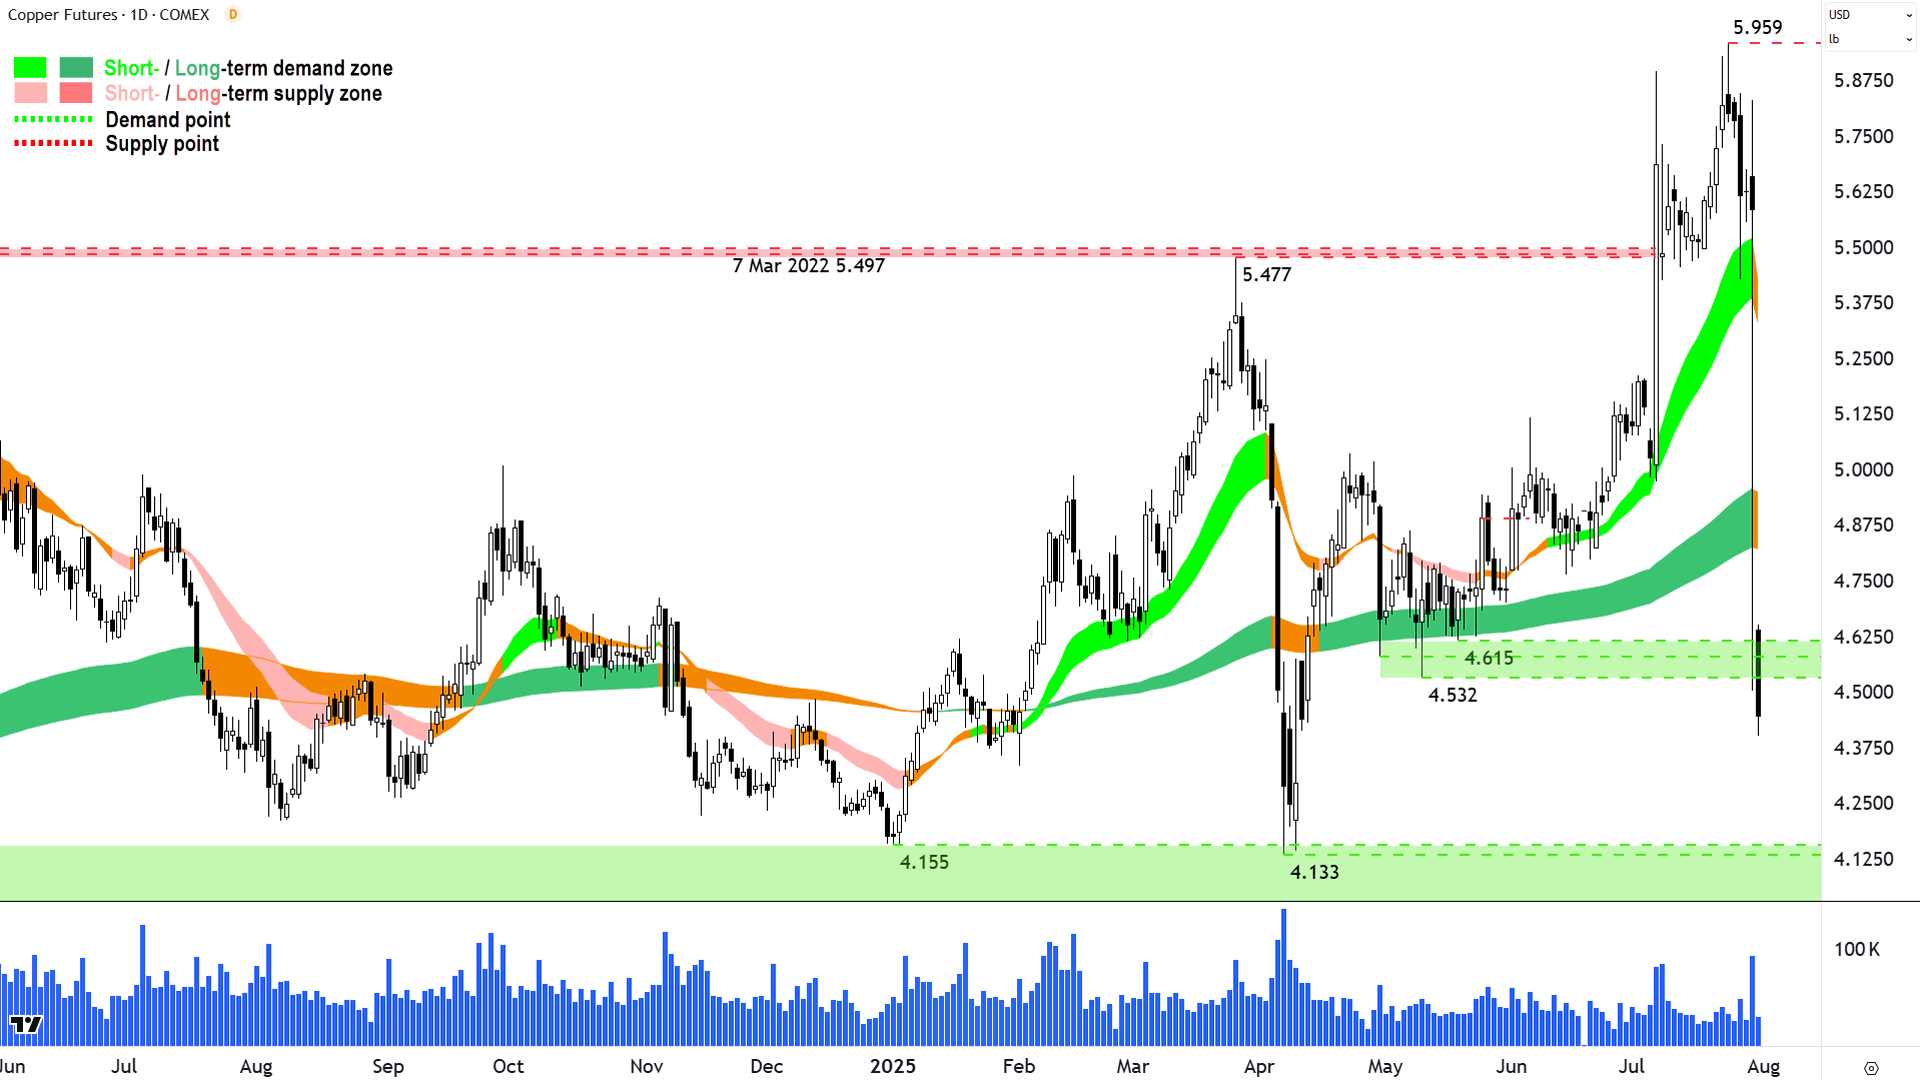
High Grade Copper Futures (Front month, back-adjusted) COMEX
%20COMEX%20chart%2031%20Jul%202025.png)
Full circle... (click here for full size image)
The last time we covered copper was all the way back in ChartWatch in the Evening Wrap on 10 June.
In that update, we were tracking an improving technical outlook for the red metal, noting “something is slowly building here”. The move did come, with copper breaking its 7 March 2022 high of 5.497 as well as its 2011 high of 5.637 – to set a new all-time high of 5.959.
But, as you already know from reading my article earlier today on the topic, tariff shenanigans have ensured the good times were only short-lived. To be fair, it was tariff shenanigans that helped copper to its recent heroics in the first place – so copper has really just gone full circle ♻️.
There’s not a great deal of point in analysing the above chart for COMEX copper. The massive, vertical decline into the current, live bar (right-most on screen) has made a mess of any hopes of trend analysis. I’m not sure how accurate the prior, Wednesday bar is (with it’s long downward pointing shadow), either…
Suffice it to say, copper is likely stuck back within the range it traded for most of the last 12-months – between 4.133 and 5.497. I suggest it’s more relevant to look at the LME copper chart, that is, copper sans tariff shenanigans!

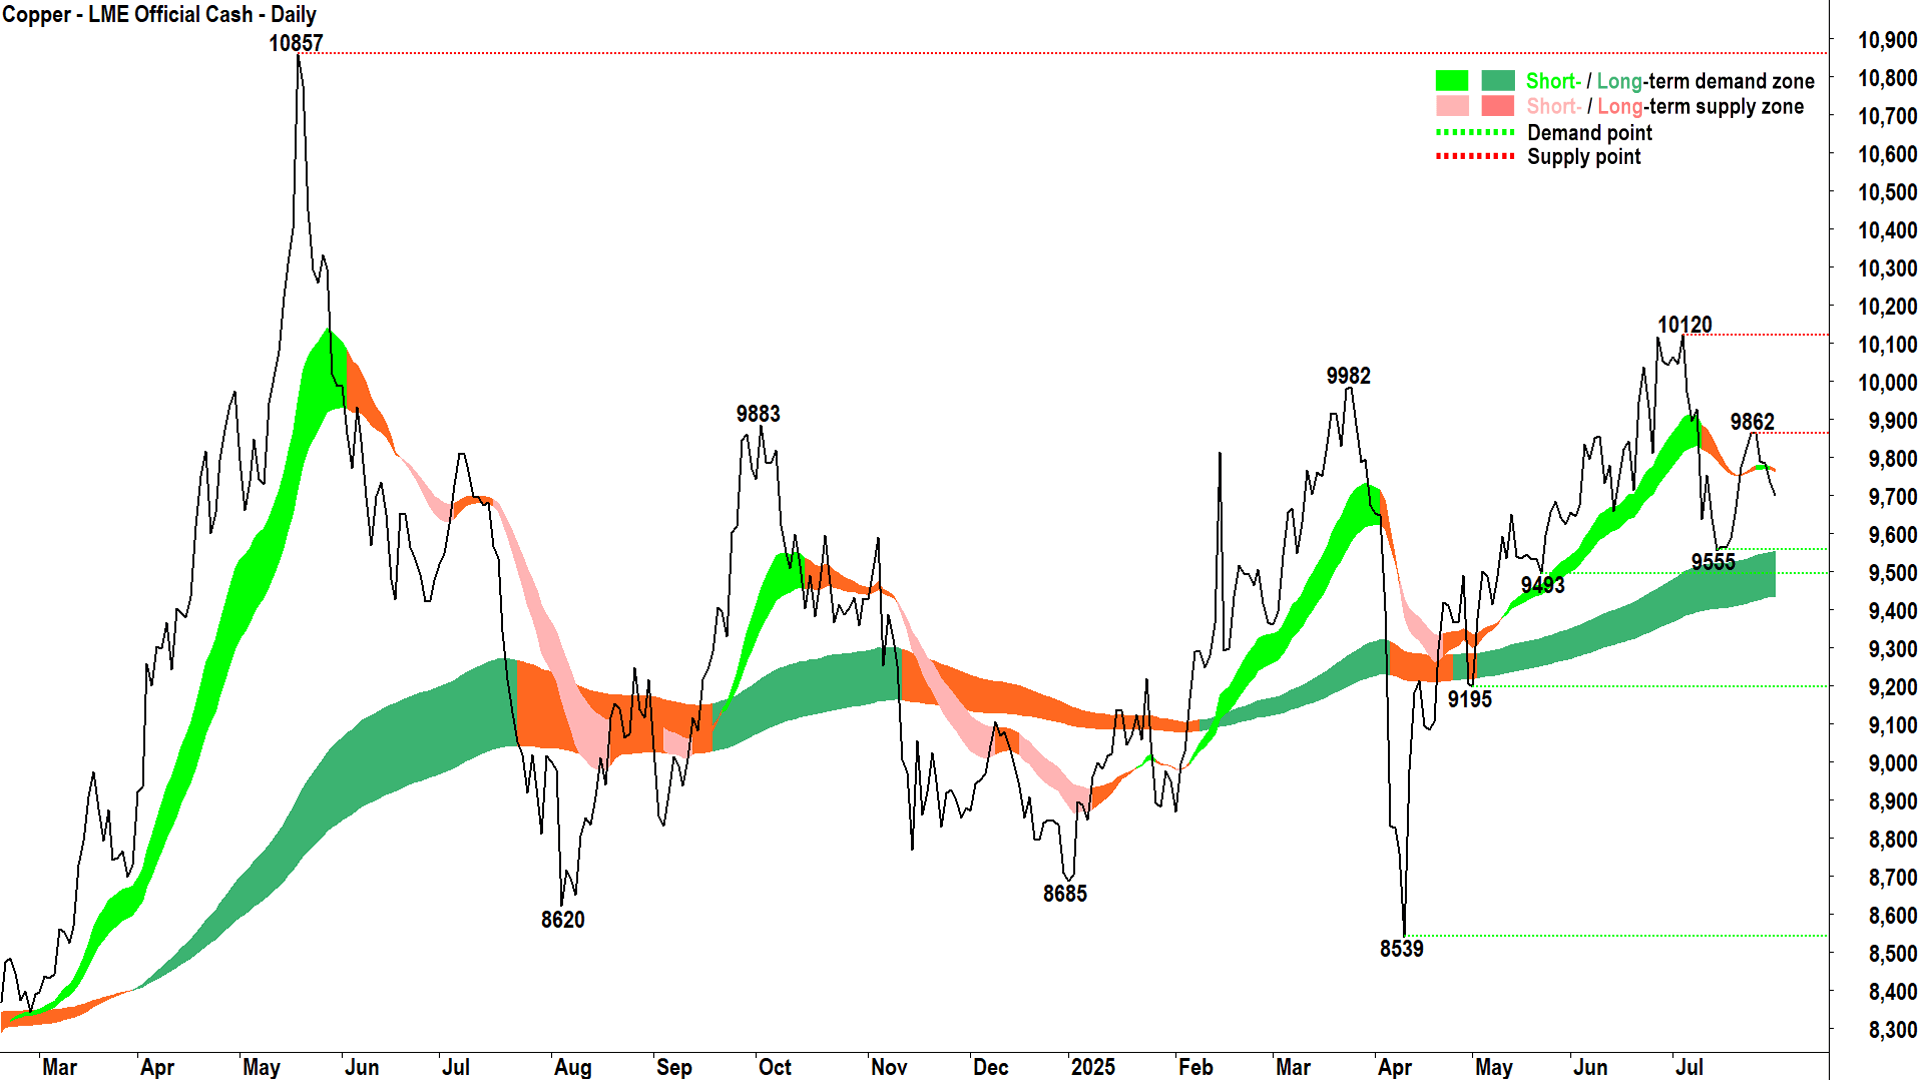
Copper - LME Official Cash (click here for full size image)
This chart suggests a moderate but well established underlying long term uptrend for copper, but a mixed short term picture with a neutral short term trend ribbon and mixed price action (falling peaks vs rising troughs). The rising long term uptrend does filter out some pretty massive swings both above and below it over the last 12-months, though – copper is a volatile beast...
It is encouraging that 9555 sits above the long term uptrend ribbon. So far this time around, the long term trend ribbon appears to be doing its job of acting as a dynamic zone of excess demand. It will need to continue to do so, or things will turn decisively sour should copper break below its key long term trend delineator.
10120 caps the upside, with 9862 a shorter term impediment. A close above 9862 in the next few sessions would be a strong indication the demand-side is regaining control.
9493-9555 is the key static demand zone, with the bottom of the long term uptrend ribbon (presently 9435) the lower bound of dynamic demand. The long term uptrend remains intact until a close below there.
Overall, not the worst chart going around, but neither is it a glowing endorsement of demand-side control in the copper market.
Economy
Today
AUS Retail Sales June
+1.2% m/m vs +0.4% forecast and +0.5% in May (revised higher from +0.2% m/m)
On the face of it appears like a strong result, but it was boosted from by one-off releases (like the new Nintendo Switch) and promotions
Interestingly, according to My Bui Economist at AMP, when accounting for population growth, spending per capita is 0.1% lower than last quarter, down 0.1% versus last year and 6% below the peak in June 2022.
Later this week
Thursday
22:30 USA Core PCE June
Price Index: +0.3% m/m vs +0.2% m/m in May
Personal Income: +0.2% m/m vs -0.4% m/m in May
Personal Spending: +0.4% m/m vs -0.1% m/m in May
Friday
00:00 USA Non-Farm Payrolls July
Employment Change: +108,000 forecast vs 147,000 in June
Average Hourly Earnings: +0.3% forecast vs +0.2% in June
Unemployment Rate: 4.2% forecast vs 4.1% in June
Saturday
00:00 USA ISM Manufacturing PMI (49.5 forecast vs 49.0 previous)
Latest News
Interesting Movers
Trading higher
+24.8% Sunrise Energy Metals (SRL) – No news since 28-Jul Further high-grade scandium assays returned at Syerston.
+19.2% Weebit Nano (WBT) – Quarterly Activities/Appendix 4C Cash Flow Report, rise is consistent with prevailing short term uptrend and long term trend is transitioning from down to up 🔎📈
+18.3% Droneshield (DRO) – Continued positive response to 30-Jan July 2025 Investor Presentation, rise is consistent with prevailing short and long term uptrends, a regular in ChartWatch ASX Scans Uptrends list 🔎📈
+6.7% Green Critical Minerals (GCM) – Continued positive response to 30-Jan GCM US Listing Scheduled for First Half 2026, rise is consistent with prevailing short and long term uptrends, a regular in ChartWatch ASX Scans Uptrends list 🔎📈
+5.3% Qoria (QOR) – No news, rise is consistent with prevailing short and long term uptrends 🔎📈
+5.2% Electro Optic Systems (EOS) – Quarterly Activity Report, rise is consistent with prevailing short and long term uptrends, a regular in ChartWatch ASX Scans Uptrends list 🔎📈
+4.3% Metal Powder Works (MPW) – No news, rise is consistent with prevailing short term uptrend and rising peaks and rising troughs 🔎📈
+4.0% Neuren Pharmaceuticals (NEU) – No news, rise is consistent with prevailing short term uptrend and long term trend is transitioning from down to up 🔎📈
+3.7% Superloop (SLC) – No news, rise is consistent with prevailing short and long term uptrends, a regular in ChartWatch ASX Scans Uptrends list 🔎📈
Trading lower
-23.5% Cettire (CTT) – US Tariff Policy Update, fall is consistent with prevailing short and long term downtrends, one of the most Featured (highest conviction) stocks in ChartWatch ASX Scans Downtrends list 🔎📉
-13.1% Champion Iron (CIA) – Continued negative response to 30-Jul Investor Presentation - Q1 FY2026, fall is consistent with prevailing long term downtrend 🔎📉
-12.9% Sun Silver (SS1) – Highest Grade Antimony Assay Returned at Maverick Springs, general weakness across the broader Precious Metals sector today.
-12.3% MTM Critical Metals (MTM) – Application for quotation of securities.
-11.6% Ora Banda Mining (OBM) – No news since 30-Jul Corporate Presentation, general weakness across the broader Precious Metals sector today.
-11.4% Coronado Global Resources (CRN) – No news, general weakness across the broader Energy sector today, fall is consistent with prevailing long term downtrend 🔎📉
-11.1% Meteoric Resources (MEI) – Quarterly Activities/Appendix 5B Cash Flow Report.
-9.3% Unico Silver (USL) – No news since 30-Jul June 2025 Quarterly Activities & Cashflow Report, general weakness across the broader Precious Metals sector today.
-9.3% Beach Energy (BPT) – FY25 Fourth Quarter Activities Report.
-9.1% Carnarvon Energy (CVN) – No news, general weakness across the broader Energy sector today, fall is consistent with prevailing short and long term downtrends 🔎📉
-8.5% Vulcan Energy Resources (VUL) – No news since 30-Jul Quarterly Activities Report, general weakness across the broader Lithium sector today, benchmark lithium carbonate futures were down over 4% in China today.
-8.1% 29METALS (29M) – No news, general weakness across the broader Copper sector today, Trump administration tariff news failed to meet market's expectations… see ChartWatch for more details.
-7.9% Aurelia Metals (AMI) – No news, general weakness across the broader Copper sector today.
-7.6% Core Lithium (CXO) – No news since 30-Jul Quarterly Activities and Cashflow Report, general weakness across the broader Lithium sector today.
-0.1% Kingsgate Consolidated (KCN) – June 2025 Quarterly Report, general weakness across the broader Precious Metals sector today.
-7.3% Flight Centre Travel Group (FLT) – FLT Releases Preliminary Unaudited Trading Results, fall is consistent with prevailing short and long term downtrends 🔎📉
-7.1% Mineral Resources (MIN) – No news since 30-Jul Quarterly Activity Report, general weakness across the broader Lithium sector today.
-7.0% Pilbara Minerals (PLS) – No news since 30-Jul June Quarter Activities Presentation, general weakness across the broader Lithium sector today.
-6.7% Boss Energy (BOE) – Continued negative response to 28-Jul June 2025 Quarterly Results Presentation, possibly also increased short seller interest as disclosed here….Change in substantial holding
Broker Moves
Life360 Inc (360)
Retained at Overweight at Morgan Stanley; Price Target: $40.00
Australian Clinical Labs (ACL)
Retained at Neutral at Macquarie; Price Target: $3.15
ALS (ALQ)
Downgraded to Neutral from Buy at Goldman Sachs; Price Target: $17.70 from $17.80
Retained at Underweight at Jarden; Price Target: $14.60
Retained at Outperform at Macquarie; Price Target: $19.26 from $18.20
Atlas Arteria (ALX)
Retained at Buy at Citi; Price Target: $5.70
Upgraded to Buy from Reduce at Jefferies; Price Target: $6.42 from $6.34
Upgraded to Outperform from Reduce at Macquarie; Price Target: $5.78 from $5.51
Retained at Equal-weight at Morgan Stanley; Price Target: $5.26
Retained at Hold at Morgans; Price Target: $5.05 from $5.09
Upgraded to Accumulate from Hold at Ord Minnett; Price Target: $5.20 from $5.30
Retained at Neutral at UBS; Price Target: $5.35 from $5.15
Ansell (ANN)
Retained at Neutral at Citi; Price Target: $33.50 from $38.00
Appen (APX)
Retained at Speculative Buy at Canaccord Genuity; Price Target: $1.60 from $2.35
Retained at Buy at Ord Minnett; Price Target: $1.65 from $3.30
Amplia Therapeutics (ATX)
Initiated at Speculative Buy at Bell Potter; Price Target: $0.42
AusGold (AUC)
Retained at Speculative Buy at Canaccord Genuity; Price Target: $1.80 from $1.65
Brazilian Rare Earths (BRE)
Retained at Speculative Buy at Ord Minnett; Price Target: $6.30
BlueScope Steel (BSL)
Downgraded to Neutral from Overweight at JPMorgan; Price Target: $25.90 from $26.00
Champion Iron (CIA)
Retained at Buy at Citi; Price Target: $6.20 from $6.50
Downgraded to Neutral from Outperform at Macquarie; Price Target: $5.00 from $5.60
Capricorn Metals (CMM)
Retained at Buy at Argonaut Securities; Price Target: $12.50 from $13.00
Retained at Hold at Bell Potter; Price Target: $9.30 from $9.10
Retained at Buy at Canaccord Genuity; Price Target: $12.20 from $12.30
Retained at Neutral at Macquarie; Price Target: $10.00
DroneShield (DRO)
Upgraded to Buy from Hold at Bell Potter; Price Target: $3.80
Upgraded to Buy from Hold at Shaw and Partners; Price Target: $3.60 from $2.00
Emerald Resources NL (EMR)
Retained at Buy at Canaccord Genuity; Price Target: $5.50 from $5.70
Experience Co (EXP)
Retained at Buy at Canaccord Genuity; Price Target: $0.21
Retained at Buy at Ord Minnett; Price Target: $0.28 from $0.32
Flight Centre Travel Group (FLT)
Retained at Buy at Citi; Price Target: $16.10
Retained at Sector Perform at RBC Capital Markets; Price Target: $16.00 from $18.00
Healius (HLS)
Retained at Neutral at Citi; Price Target: $0.85 from $1.05
Retained at Neutral at Macquarie; Price Target: $1.20
Integral Diagnostics (IDX)
Retained at Outperform at Macquarie; Price Target: $3.20
IGO (IGO)
Retained at Hold at Canaccord Genuity; Price Target: $4.60 from $4.80
Retained at Neutral at Citi; Price Target: $4.10
Retained at Outperform at RBC Capital Markets; Price Target: $4.75 from $6.00
ikeGPS Group (IKE)
Retained at Buy at Shaw and Partners; Price Target: $1.30
Mineral Resources (MIN)
Retained at Overweight at Barrenjoey; Price Target: $33.00 from $31.00
Retained at Neutral at Citi; Price Target: $31.00 from $20.00
Downgraded to Underperform from Hold at Jefferies; Price Target: $25.00 from $22.00
Downgraded to Underweight from Neutral at JPMorgan; Price Target: $24.00 from $19.00
Downgraded to Underperform from Neutral at Macquarie; Price Target: $29.00 from $22.00
Retained at Overweight at Morgan Stanley; Price Target: $37.50 from $35.00
Upgraded to Hold from Trim at Morgans; Price Target: $31.00 from $30.00
Retained at Buy at Ord Minnett; Price Target: $33.00 from $31.00
Retained at Outperform at RBC Capital Markets; Price Target: $38.00 from $36.00
Monash IVF Group (MVF)
Retained at Outperform at Macquarie; Price Target: $1.30
National Australia Bank (NAB)
Retained at Neutral at Macquarie; Price Target: $35.00
Newmont Corporation (NEM)
Retained at Buy at Citi; Price Target: $115.00 from $95.00
Nickel Industries (NIC)
Retained at Overweight at Barrenjoey; Price Target: $1.80 from $1.65
Upgraded to Outperform from Neutral at Macquarie; Price Target: $0.75
Retained at Neutral at Macquarie; Price Target: $0.75
Origin Energy (ORG)
Retained at Buy at Citi; Price Target: $13.00
Pointsbet Holdings (PBH)
Downgraded to Neutral from Overweight at JPMorgan; Price Target: $1.20 from $0.90
Pilbara Minerals (PLS)
Retained at Underweight at Barrenjoey; Price Target: $1.20 from $1.15
Retained at Buy at Bell Potter; Price Target: $2.00
Retained at Neutral at Citi; Price Target: $1.80 from $1.30
Retained at Positive at E&P; Price Target: $2.60 from $3.90
Downgraded to Underweight from Neutral at JPMorgan; Price Target: $1.25 from $1.60
Retained at Outperform at Macquarie; Price Target: $1.90 from $1.50
Retained at Buy at Morgans; Price Target: $2.30 from $2.20
Retained at Outperform at RBC Capital Markets; Price Target: $2.70 from $2.60
QPM Energy (QPM)
Retained at Speculative Buy at Ord Minnett; Price Target: $0.13 from $0.14
Rio Tinto (RIO)
Retained at Overweight at Barrenjoey; Price Target: $121.00 from $120.00
Retained at Hold at Morgans; Price Target: $110.00 from $109.00
Retained at Buy at Ord Minnett; Price Target: $121.00 from $120.00
Ramelius Resources (RMS)
Retained at Buy at Canaccord Genuity; Price Target: $3.95 from $4.20
SiteMinder (SDR)
Retained at Buy at Citi; Price Target: $6.45
Sims (SGM)
Downgraded to Underweight from Neutral at JPMorgan; Price Target: $15.10 from $16.00
Synlait Milk (SM1)
Retained at Hold at Bell Potter; Price Target: $0.58 from $0.92
Syrah Resources (SYR)
Retained at Hold at Shaw and Partners; Price Target: $0.60
Transurban Group (TCL)
Retained at Neutral at Citi; Price Target: $14.30
The Lottery Corporation (TLC)
Downgraded to Neutral from Overweight at JPMorgan; Price Target: $5.55 from $5.40
Tuas (TUA)
Retained at Overweight at Morgan Stanley; Price Target: $7.00
Vitrafy Life Sciences (VFY)
Retained at Speculative Buy at Bell Potter; Price Target: $2.00
Viridis Mining and Minerals (VMM)
Retained at Speculative Buy at Ord Minnett; Price Target: $1.60 from $0.75
West African Resources (WAF)
Retained at Speculative Buy at Argonaut Securities; Price Target: $5.60
Retained at Buy at Canaccord Genuity; Price Target: $4.70
Retained at Buy at Euroz Hartleys; Price Target: $4.15
Retained at Outperform at Macquarie; Price Target: $3.30
Scans
Top Gainers
Code | Company | Last | % Chg |
|---|---|---|---|
| I88 | Infini Resources Ltd | $0.17 | +36.00% |
| TOU | Tlou Energy Ltd | $0.024 | +33.33% |
| SRL | Sunrise Energy Metals Ltd | $1.31 | +24.76% |
| BDG | Black Dragon Gold Corp | $0.086 | +22.86% |
| IS3 | I Synergy Group Ltd | $0.011 | +22.22% |
Top Fallers
Code | Company | Last | % Chg |
|---|---|---|---|
| MHK | Metal Hawk Ltd | $0.17 | -54.05% |
| CTT | Cettire Ltd | $0.26 | -23.53% |
| 3DP | Pointerra Ltd | $0.046 | -19.30% |
| AIV | Activex Ltd | $0.013 | -18.75% |
| GRE | Greentech Metals Ltd | $0.065 | -18.75% |
52 Week Highs
Code | Company | Last | % Chg |
|---|---|---|---|
| BCA | Black Canyon Ltd | $0.323 | +19.44% |
| PEC | Perpetual Resources Ltd | $0.027 | +17.39% |
| SOM | Somnomed Ltd | $0.815 | +15.60% |
| KGL | KGL Resources Ltd | $0.115 | +15.00% |
| MXO | Motio Ltd | $0.06 | +13.21% |
52 Week Lows
Code | Company | Last | % Chg |
|---|---|---|---|
| CTT | Cettire Ltd | $0.26 | -23.53% |
| CGR | CGN Resources Ltd | $0.048 | -12.73% |
| CVN | Carnarvon Energy Ltd | $0.10 | -9.09% |
| VHM | VHM Ltd | $0.185 | -5.13% |
| BGL | Bellevue Gold Ltd | $0.81 | -4.71% |
Near Highs
Code | Company | Last | % Chg |
|---|---|---|---|
| WVOL | Ishares MSCI World Ex Aust Minimum Volatility ETF | $43.57 | +0.53% |
| IPX | Iperionx Ltd | $6.25 | 0.00% |
| GCI | Gryphon Capital Income Trust | $2.07 | 0.00% |
| IHD | Ishares S&P/ASX DIV Opportunities Esg Screened ETF | $15.33 | +0.66% |
| MGX | Mount Gibson Iron Ltd | $0.385 | +1.32% |
Relative Strength Index (RSI) Oversold
Code | Company | Last | % Chg |
|---|---|---|---|
| BOE | Boss Energy Ltd | $1.865 | +3.61% |
| SHV | Select Harvests Ltd | $3.41 | 0.00% |
| LSGE | Loomis Sayles Global Equity Fund - Active ETF | $2.38 | -0.83% |
| BAP | Bapcor Ltd | $3.83 | +0.79% |
| IMU | Imugene Ltd | $0.28 | 0.00% |
