
News | Market Wraps
Evening Wrap: ASX 200 thumbs nose at Trump's trade war, sets another record as greed triumphs over fear!
The S&P/ASX 200 closed 71.5 points higher, up 0.84%.

Mentioned
The S&P/ASX 200 closed 71.5 points higher, up 0.84%.
Record high or not (you know the ASX 200 closed at a record high on a total return basis back on May 30!), one cannot understate just how impressive the recovery from President Trump's Trade War Correction is!
Since the 7 April low, the ASX 200 Total Return Index has risen 17.2%. It's also now 6.8% higher for the calendar year and a very handy 13.0% higher on a 12-month basis. Nice 👍.
Today's gains were driven largely by +1% gains in the major banks (National Australia Bank (NAB) (+1.5%) was the best), blue-chip consumer stocks like JB Hi-fi (JBH) (+2.0%) and Wesfarmers (WES) (+1.4%), as well as big techs like NextDC (NXT) (+5.2%), Wisetech Global (WTC) (+2.4%), and Xero (XRO) (+1.8%).
Really, only the Gold sub-Index (XGD) (-1.7%) missed out in any meaningful way, as heavy falls in sector leaders Evolution Mining (EVN) (-3.8%) and Newmont Corp. (NEM) (-3.5%) dragged on the sector.
To make sense of all the above, I have detailed technical analysis on the Nasdaq Composite, S&P/ASX 200, and Copper in today's ChartWatch.
Be sure to click/scroll through for the usual reporting of the major sector and stock-specific moves, the broker responses to them, as well as all the key upcoming economic data in tonight's Evening Wrap.
Let's dive in!
Today in Review
Tue 10 Jun 25, 5:00pm (AEST)
Name | Value | % Chg |
|---|---|---|
Major Indices | ||
| ASX 200 | 8,587.2 | +0.84% |
| All Ords | 8,812.7 | +0.81% |
| Small Ords | 3,249.3 | +0.15% |
| All Tech | 4,067.4 | +1.60% |
| Emerging Companies | 2,311.0 | -0.20% |
Currency | ||
| AUD/USD | 0.6516 | 0.00% |
US Futures | ||
| S&P 500 | 6,011.0 | +0.01% |
| Dow Jones | 42,786.0 | -0.02% |
| Nasdaq | 21,820.25 | -0.01% |
Name | Value | % Chg |
|---|---|---|
Sector | ||
| Consumer Discretionary | 4,159.3 | +1.82% |
| Information Technology | 2,955.8 | +1.64% |
| Financials | 9,419.2 | +1.11% |
| Health Care | 41,918.0 | +1.05% |
| Real Estate | 3,969.0 | +0.92% |
| Energy | 8,173.0 | +0.91% |
| Consumer Staples | 12,464.9 | +0.53% |
| Communication Services | 1,842.3 | +0.46% |
| Materials | 16,502.6 | +0.19% |
| Utilities | 9,223.8 | +0.10% |
| Industrials | 8,385.6 | -0.08% |
ChartWatch is going *LIVE*
If you want to LEARN MORE about technical analysis and trend following using real case studies on the ASX stocks you're interested in, be sure to register for this upcoming lunchtime webinar on Wednesday 18 June at 12pm AEST. Hosted by our resident technical analyst, Carl Capolingua.
ChartWatch *LIVE* Webinar - REGISTER NOW!
(Last chance...Registrations close tomorrow! Register now!)
Markets
%20intraday%20chart%2010%20Jun%202025.png)
ASX 200 Session Chart
The S&P/ASX 200 (XJO) finished 71.5 points higher at 8,587.2, 0.84% from its session low and just 0.06% from its high. Importantly, the positivity in the benchmark was also reflected in the broader-based S&P/ASX 300 (XKO) where advancers beat decliners by 184 to 96.
Despite what you’ve read in every other market wrap today, the Australian stock market has been logging new highs since Friday 30 May. Yes, the S&P/ASX 200 price only index closed at a record high for the first time in a while today – but it doesn’t reflect the total return of the 200 biggest ASX listed stocks. Stocks pay dividends – particularly our stocks.
So, to say the S&P ASX 200 is at a “record today", and that this actually means something, is a little naïve.
Either way, one thing we can say that has far more meaning is this: There's presently a healthy imbalance between the demand for Australian shares and the supply of them.
Healthy imbalance. Strong price appreciation. Think about what that means for a second. 🤔
Does it represent consensus or disagreement? 🤔
And, what about equilibrium...what does that mean? 🤔
I could talk to you about moats and margins of safety, or of historically high overvaluations and looming crises…but none of that talk would make a lick of difference when it comes to changing the prevailing demand-supply environment.
The demand and supply that's causing the prices of Aussie stocks to rise (well most of them!) is doing what it’s doing without mine/your help or influence.
And it’s going to keep doing it that way…
It already knows / has computed / has acted upon all those things (like moats, margins of safety, and “rather stick pins in my eyes than buy” overvaluations!).
For the record, the stronger the imbalance between demand and supply – the greater is the consensus among market participants. This is important!!! 💯
I won’t spell it out, because I want you to really think about what this says about the market’s current performance. What do short and long term trends of the ASX 200 say about the market's degree of consensus?
On the other hand, I propose that we need to be attentive to equilibrium. It's just as much a fact that prices go sideways because demand and supply have moved into balance. Therefore, ask yourself if equilibrium is an environment of consensus or contention?
As a technical analyst I can only tell you what’s happened, sure. But if you think the investors who are creating demand and supply are only acting on their views on the past, and not their views of the future, then perhaps it is you that is “a little naïve”! I contend that trends reflect the market's view of the future just as much as they reflect what's happened in the past.
Hey, things can change – as they say in the classics “change is the only constant”. So, news may appear to modify the prevailing balance / imbalance between demand and supply.
And this will change the price. And the price changing over time will lead to trend change...
My conclusion is this: You could have found 100 reasons back in April why us setting a record high so quickly would be impossible. Stop worrying too much about the why and just focus on the what is. Follow the trend, meticulously manage your risk, and everything else should pretty much take care of itself! *
Today's blue-chip winners:
Company | Last Price | Change $ | Change % | 1mo % | 1yr % |
|---|---|---|---|---|---|
Pilbara Minerals (PLS) | $1.350 | +$0.07 | +5.5% | -8.2% | -63.6% |
Nextdc (NXT) | $13.86 | +$0.68 | +5.2% | +2.1% | -21.7% |
Mineral Resources (MIN) | $24.92 | +$1.21 | +5.1% | +18.3% | -64.2% |
IDP Education (IEL) | $3.74 | +$0.15 | +4.2% | -61.2% | -76.2% |
Aristocrat Leisure (ALL) | $64.57 | +$2.26 | +3.6% | -3.2% | +40.5% |
Paladin Energy (PDN) | $6.61 | +$0.23 | +3.6% | +3.8% | -57.6% |
Light & Wonder (LNW) | $135.27 | +$4.63 | +3.5% | +7.1% | -6.8% |
Metcash (MTS) | $3.51 | +$0.12 | +3.5% | +5.7% | -7.1% |
REA Group (REA) | $239.66 | +$7.14 | +3.1% | -2.2% | +28.7% |
Pro Medicus (PME) | $283.48 | +$7.45 | +2.7% | +12.6% | +130.6% |
Dyno Nobel (DNL) | $2.70 | +$0.07 | +2.7% | +5.1% | -9.4% |
The A2 Milk Company (A2M) | $8.23 | +$0.21 | +2.6% | -1.9% | +15.1% |
Suncorp Group (SUN) | $21.71 | +$0.54 | +2.6% | +5.5% | +36.1% |
Lynas Rare Earths (LYC) | $9.37 | +$0.22 | +2.4% | +21.7% | +40.7% |
Wisetech Global (WTC) | $108.01 | +$2.49 | +2.4% | +12.3% | +13.2% |
Today's blue-chip losers:
Company | Last Price | Change $ | Change % | 1mo % | 1yr % |
|---|---|---|---|---|---|
Evolution Mining (EVN) | $8.55 | -$0.34 | -3.8% | -0.9% | +120.9% |
Newmont Corporation (NEM) | $81.62 | -$2.98 | -3.5% | -2.3% | +33.8% |
SGH (SGH) | $54.24 | -$0.81 | -1.5% | +7.4% | +38.2% |
Ramsay Health Care (RHC) | $37.18 | -$0.47 | -1.2% | +1.4% | -24.1% |
Life360 (360) | $32.85 | -$0.4 | -1.2% | +39.3% | +112.5% |
Qantas Airways (QAN) | $10.64 | -$0.12 | -1.1% | +7.9% | +73.9% |
Hub24 (HUB) | $83.11 | -$0.89 | -1.1% | +5.1% | +86.8% |
Whitehaven Coal (WHC) | $5.73 | -$0.06 | -1.0% | +11.0% | -28.6% |
Bluescope Steel (BSL) | $23.53 | -$0.24 | -1.0% | +2.2% | +11.2% |
Scentre Group (SCG) | $3.68 | -$0.03 | -0.8% | -0.8% | +15.7% |
Washington H Soul Pattinson & Company (SOL) | $39.76 | -$0.32 | -0.8% | +6.5% | +25.8% |
Transurban Group (TCL) | $14.27 | -$0.11 | -0.8% | -0.6% | +12.1% |
Lendlease Group (LLC) | $5.72 | -$0.04 | -0.7% | +5.7% | -3.2% |
APA Group (APA) | $8.30 | -$0.05 | -0.6% | -3.6% | -2.0% |
Sandfire Resources (SFR) | $11.65 | -$0.07 | -0.6% | +13.7% | +31.5% |
ChartWatch
NASDAQ Composite Index

No talk of bears here please! 🐻 (click here for full size image)
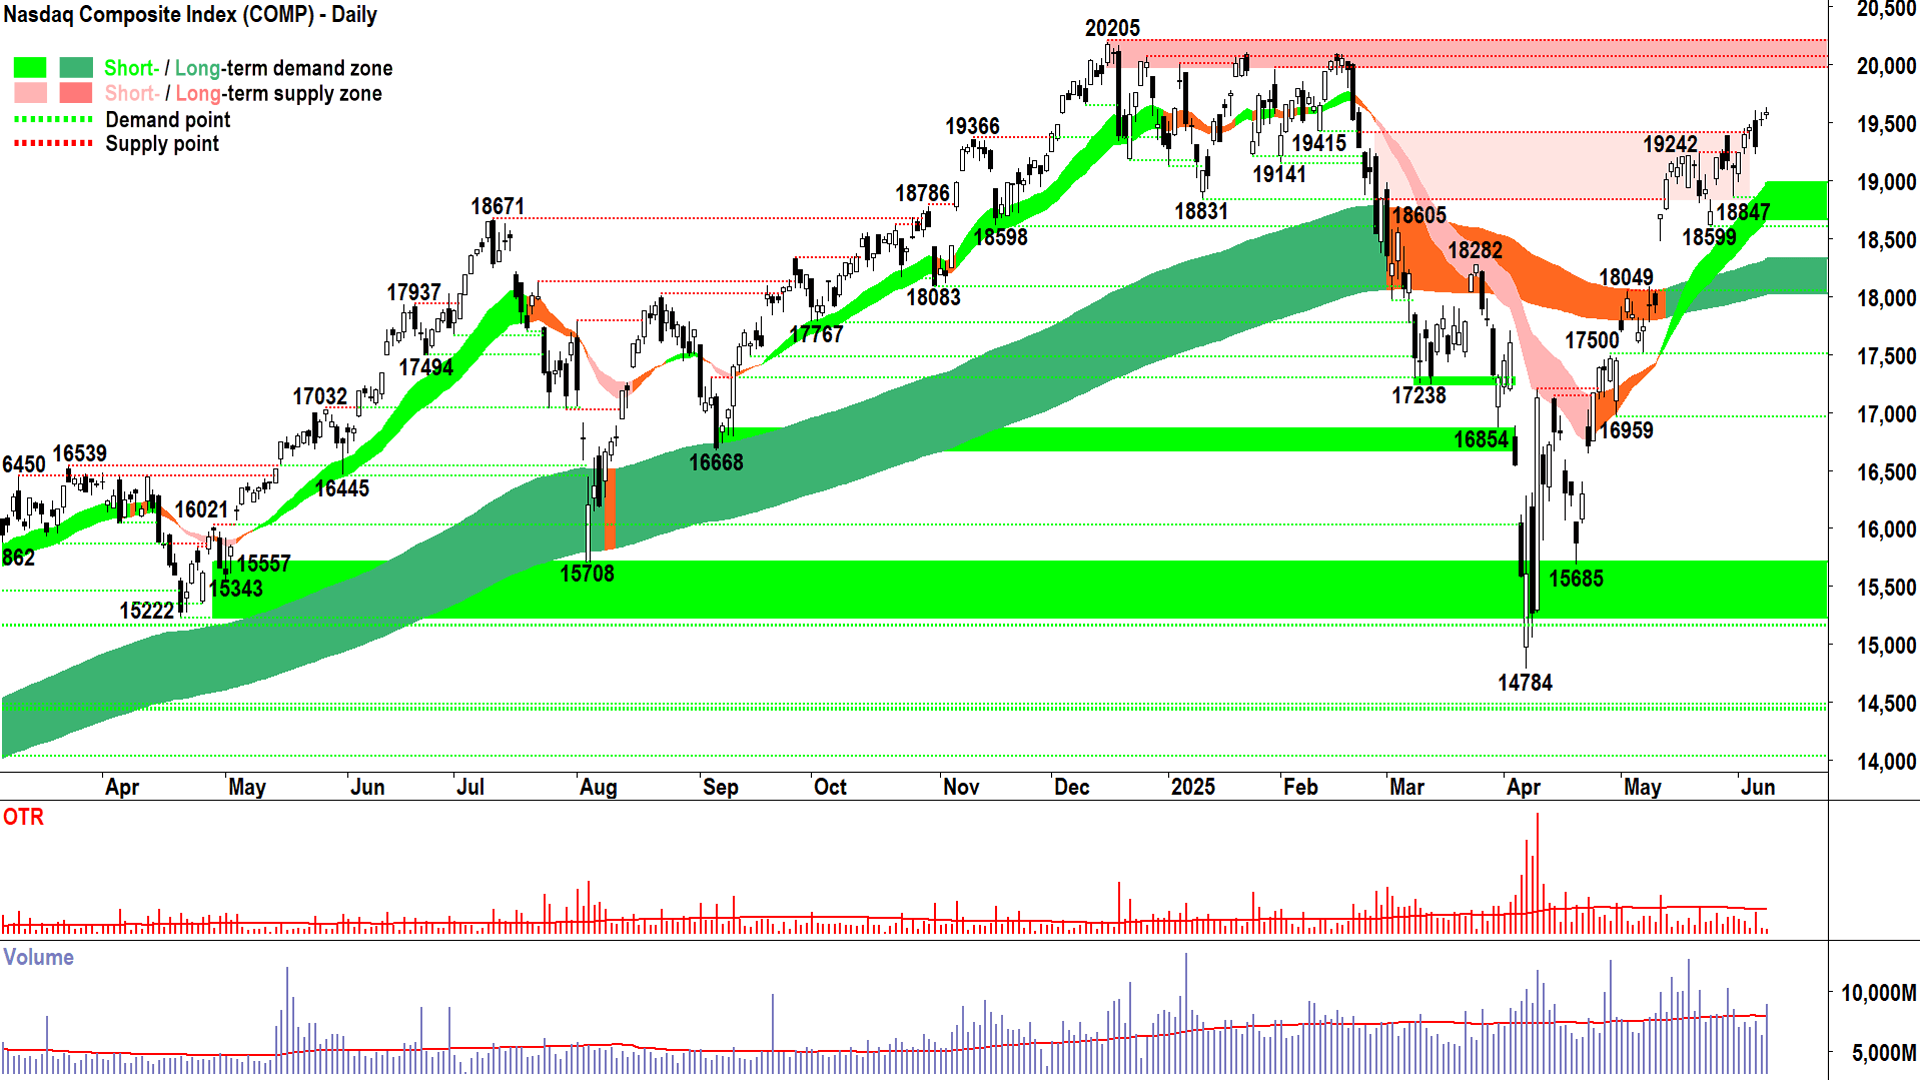
I proposed Friday’s Comp analysis, and more generally extending to the XJO – that Thursday’s potentially dangerous supply-side candle was “not great but probably no reason to panic”
Pretty spot on ✅.
Well, anyways, history seems to align with that conclusion – because the outcome was pure chance / coincidence, and therefore I cannot take any real credit for it*.
So, here we are…two trading sessions / candles later, still ebbing along above the short and long term uptrend ribbons which continue to rise and act as zones of dynamic excess demand, with demand-side control oriented price action (i.e., rising peaks and rising troughs), and demand-side oriented candles (i.e., white-bodied and or downward pointing shadows).
20205 remains the big dance. Given the miniscule last couple of candles, it’s clearly starting to weigh on the market’s mind.
All things considered, my conclusion is: Demand-side control is intact. I’m staying the course here. I see no reason for concern until the Comp closes below 18599-18847 / short term uptrend ribbon | or prints a massive supply-side candle | or prints lower peaks.
*FYI, this is My Mantra: The outcome is completely independent of you, your thoughts, your perceived intelligence, your methodology, your actions, your opinions and biases, and most importantly – your predictions! Get used to it. Embrace your insignificance and the futility of caring about the outcome. Understand your place as a price taker, not a price maker. Follow trend, manage risk, accept the outcome, and MOVE ON**.
**I suggest this is something you might want to print out in big letters and stick on the wall wherever you do your analysis***.
***Or better still, get it tattooed on your forehead – preferably backwards – so you can read it each morning when you look in the mirror! 😁
S&P/ASX 200 (XJO)
%20chart%2010%20Jun%202025.png)
Consensus = ✅ (click here for full size image)
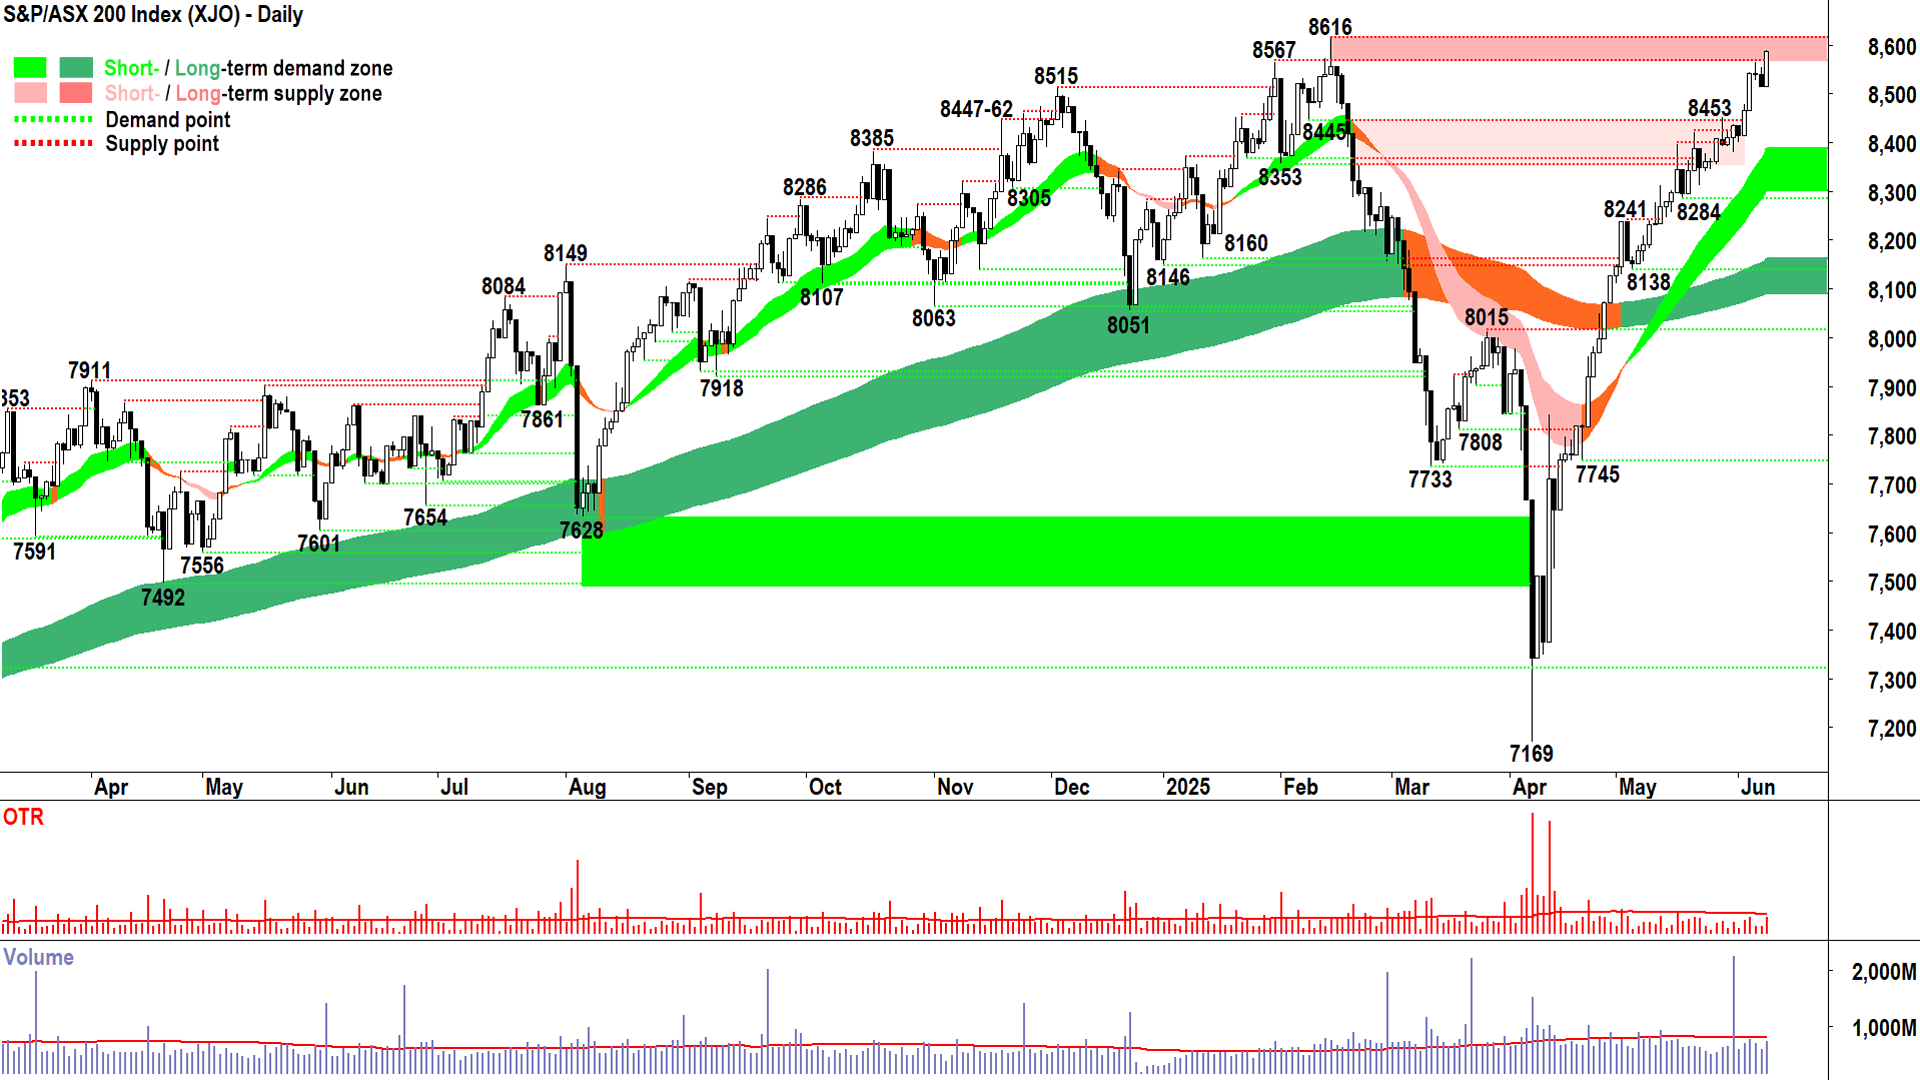
Here, this will help 👍.
Waffle about record highs aside, let’s stick to what we actually know.
Demand-side candle today = Decent sized white body starting at the session's low (i.e., there was excess demand at lower prices) and closing near the session’s high (i.e., there was excess demand at higher prices, too).
Close inside the 8567-8616 supply zone = The demand-side was not afraid to keep buying into this zone (i.e., for fear of the excess supply that might reside there)…and the supply-side…well…just wasn’t there in any force.
Conclusion 1: Strong demand, not fazed by higher prices – versus lack of supply, not enticed/tempted by price.
Conclusion 2: Demand wants to get in. Supply wants to stay in. Consensus ✅
Trends, price action, and the broader candle picture are all strongly indicative of demand-side control = I have no reason to doubt this contention, nor for concern until the XJO closes below 8284 / short term uptrend ribbon | or prints a massive supply-side candle | or prints lower peaks.
High Grade Copper Futures (Front month, back-adjusted) COMEX
%20COMEX%20chart%2010%20Jun%202025.png)
⬜🕯️ = the catalyst copper bulls need to see 🤞! (click here for full size image)

The last time we covered copper was in ChartWatch in the Evening Wrap on 30 May.
In that update, we were tracking a largely sideways grind in the copper price, just above the long term uptrend ribbon.
It has since pushed off that dynamic demand zone, only to be repelled by the 4.981 point of supply. The long upward pointing shadow of the 5-Jun candle confirms there is indeed credible excess supply from that price, upwards.
That’s not always a death sentence. Supply zones can be broken – if demand is large and motivated enough. Often, it will take the demand-side a couple, or even a few goes, to dislodge the supply associated with a historical peak.
Each time, the demand-side removes more, and more supply, until there’s no supply left at that area. If demand remains sufficiently large and motivated, then in the resultant supply vacuum – price can move higher relatively quickly.
You’ll probably read about these scenarios as “breakouts” in your plain-vanilla technical analysis book 📖.
So, with the long term uptrend intact and as per the last blip-up and clearly doing its job of acting as a zone of dynamic excess demand, the short term trend ribbon turning higher, the resumption of rising peaks and troughs, and now much less squinting required to ascertain an environment of demand-side candle predominance…you’d have to conclude that copper is again under demand-side control.
I propose that something is slowly building here…but for now…even the optimist must concede the copper chart still smacks a little of ranges within ranges.
Clearly, 4.981-5.062 is the key supply zone. It might be the next probe that dislodges it, or the next…or it may not happen at all…but a long white candle closing at its high smack bang in that range would be your signal copper’s good to go…that’s the catalyst copper bulls need to see 🤞!
Economy
Today
AUS Westpac Consumer Sentiment June
+0.5% to 92.6 vs +2.2% in May
Readings below 100 indicate overall pessimism vs above 100 overall optimism
Lower inflation and lower interest rates perking up Aussie consumers
But global trade headlines and still-high risk aversion dragging

AUS NAB Business Confidence June
Confidence: +3 points to 2 points
NAB - "Confidence rose in all industries except manufacturing, mining and wholesale. In trend terms, confidence remains weakest in retail and wholesale."
Conditions: -1 point to 0 points
NAB - "conditions fell across most industries, led by significant declines in retail and manufacturing."
NAB - "Overall, this survey highlights that business conditions remain weak amid ongoing profitability pressures and soft demand, with signs of a further softening in labour demand."

Later this week
Wednesday
22:30 USA Core Consumer Price Index (CPI) May (+0.3% m/m and +2.9% p.a. forecast vs +0.2% m/m and +2.8% p.a. in April)
Thursday
03:01 USA 10-year Bond Auction (US$39 billion forecast for auction, May's high yield 4.34% p.a. and 2.6x bid-cover ratio)
11:00 AUS MI Inflation Expectations (+4.1% p.a. previous)
22:30 USA Core Producer Price Index (PPI) May (+0.3% m/m vs -0.4% m/m and +2.8% p.a. in April)
Friday
03:01 USA 30-year Bond Auction (US$22 billion forecast for auction, May's high yield 4.82% p.a. and 2.3x bid-cover ratio)
Saturday
00:00 USA Prelim UoM Consumer Sentiment June (52.5 forecast vs 52.2 in May)
00:00 USA Prelim UoM Inflation Expectations June (+6.6% p.a. previous)
Latest News
Interesting Movers
Trading higher
+14.8% Zimplats 10c US (ZIM) – No news, general strength across the broader Critical Minerals sector today, platinum price up strongly last week.
+11.6% Australian Strategic Materials (ASM) – No news since 5/6 June Growing momentum in metal and alloy sales and Refinance of Korean Development Bank corporate debt facility, general strength across the broader Critical Minerals sector today.
+11.0% Chalice Mining (CHN) – No news, general strength across the broader Critical Minerals sector today.
+9.7% Anteris Technologies (AVR) – Board Appointments.
+8.2% GR Engineering Services (GNG) – No news, rise is consistent with prevailing long term uptrend 🔎📈
+7.7% Minerals 260 (MI6) – No news, general strength across the broader Critical Minerals sector today.
+7.3% Austal (ASB) – Update on Hanwha request for regulatory approval and S&P DJI Announces June 2025 Quarterly Rebalance, rise is consistent with prevailing short and long term uptrends, one of the most Featured (highest conviction) stocks in ChartWatch ASX Scans Uptrends list 🔎📈
+6.8% Metals X (MLX) – No news, general strength across the broader Tin sector today, bounced perfectly from long term uptrend ribbon! 🔎📈
+6.5% Droneshield (DRO) – No news, rise is consistent with prevailing short and long term uptrends, a regular in ChartWatch ASX Scans Uptrends list 🔎📈
+6.4% Zip Co. (ZIP) – No news, general strength across the broader Financials sector today, rise is consistent with prevailing short term uptrend and long term trend is transitioning from down to up 🔎📈
+6.3% BetaShares Crypto Innovators ETF (CRYP) – No news, Bitcoin and other major cryptos rallied on Monday.
+6.3% Mesoblast (MSB) – No news, today's move is consistent with recent volatility.
+5.5% Pilbara Minerals (PLS) – No news, general strength across the broader Critical Minerals sector today.
+5.4% Nexgen Energy (NXG) – No news, general strength across the broader Uranium sector today, rise is consistent with prevailing short term uptrend and long term trend is transitioning from down to up, a recent regular in ChartWatch ASX Scans Uptrends list 🔎📈
+5.4% Mayne Pharma Group (MYX) – Becoming a substantial holder from MUFG, today's move is consistent with recent volatility.
+5.2% Nextdc (NXT) – Contracted Utilisation & Forward Order Book Update, general strength across the broader Information Technology sector today.
+5.1% Mineral Resources (MIN) – No news, general strength across the broader Critical Minerals sector today.
+5.0% BetaShares Global Uranium ETF (URNM) – No news, general strength across the broader Uranium sector today, uranium miners ETF.
+4.8% Liontown Resources (LTR) – No news, general strength across the broader Critical Minerals sector today.
Trading lower
-26.8% Monash IVF Group (MVF) – Clinic Incident, fall is consistent with prevailing short and long term downtrends, one of the most Featured (highest conviction) stocks in ChartWatch ASX Scans Downtrends list 🔎📉
-20.0% Dateline Resources (DTR) – U.S. Government Support for Colosseum Rare Earths, general weakness across the broader Gold sector today.
-12.9% Trigg Minerals (TMG) – MASSIVE STIBNITE CONFIRMED AT ANTIMONY CANYON PROJECT, USA.
-11.8% PWR Holdings (PWH) – Response to ASX Price Query, fall is consistent with prevailing short and long term downtrends, a regular in ChartWatch ASX Scans Downtrends list 🔎📉
-8.1% Coronado Global Resources (CRN) – Stanwell Transaction, fall is consistent with prevailing short and long term downtrends, a regular in ChartWatch ASX Scans Downtrends list 🔎📉
-7.5% Black Cat Syndicate (BC8) – No news, general weakness across the broader Gold sector today.
-7.1% Platinum Asset Management (PTM) – Funds Under Management - May 2025, fall is consistent with prevailing short and long term downtrends, a regular in ChartWatch ASX Scans Downtrends list 🔎📉
-5.6% Adriatic Metals (ADT) – No news, general weakness across the broader Precious Metals sector today.
Broker Moves
Life360 (360)
Retained at overweight at Morgan Stanley; Price Target: $32.00
ANZ Group (ANZ)
Retained at neutral at Citi; Price Target: $27.50
Austal (ASB)
Downgraded to neutral from outperform at Macquarie; Price Target: $5.90 from $4.75
BHP Group (BHP)
Retained at buy at Citi; Price Target: $45.00
Commonwealth Bank of Australia (CBA)
Retained at sell at Citi; Price Target: $100.00
Cuscal Group (CCL)
Retained at buy at Ord Minnett; Price Target: $3.75 from $3.61
Collins Foods (CKF)
Retained at overweight at Morgan Stanley; Price Target: $11.60
Domino's Pizza Enterprises (DMP)
Retained at neutral at Citi; Price Target: $23.82
Downgraded to equal-weight from overweight at Morgan Stanley; Price Target: $24.00 from $37.40
Develop Global (DVP)
Retained at buy at Bell Potter; Price Target: $5.00 from $4.00
EBR Systems (EBR)
Retained at buy at Bell Potter; Price Target: $2.25
Evolution Mining (EVN)
Downgraded to sell from hold at Argonaut Securities; Price Target: $7.00 from $7.50
Retained at neutral at Citi; Price Target: $8.50
Retained at underweight at Morgan Stanley; Price Target: $5.60
Guzman y Gomez (GYG)
Retained at overweight at Morgan Stanley; Price Target: $41.90
Insurance Australia Group (IAG)
Upgraded to hold from trim at Morgans; Price Target: $8.78 from $8.02
Monash IVF Group (MVF)
Retained at sector perform at RBC Capital Markets; Price Target: $1.000
National Australia Bank (NAB)
Retained at sell at Citi; Price Target: $30.50
Netwealth Group (NWL)
Downgraded to hold from buy at Jefferies; Price Target: $32.10 from $29.11
Nextdc (NXT)
Retained at positive at E&P; Price Target: $28.14
Rio Tinto (RIO)
Retained at equal-weight at Morgan Stanley; Price Target: $119.50
Regis Resources (RRL)
Retained at hold at Morgans; Price Target: $5.20 from $5.24
Steadfast Group (SDF)
Retained at outperform at Macquarie; Price Target: $6.80
Sims (SGM)
Initiated at neutral at E&P; Price Target: $16.33
Suncorp Group (SUN)
Retained at overweight at Morgan Stanley; Price Target: $25.00 from $22.65
The Lottery Corporation (TLC)
Downgraded to neutral from buy at Bank of America; Price Target: $5.40 from $5.50
Retained at buy at UBS; Price Target: $6.20 from $5.80
Temple & Webster Group (TPW)
Retained at sell at Ord Minnett; Price Target: $20.00 from $14.00
Westpac Banking Corporation (WBC)
Retained at sell at Citi; Price Target: $27.75
Xero (XRO)
Retained at overweight at Morgan Stanley; Price Target: $225.00
Scans
Top Gainers
Code | Company | Last | % Chg |
|---|---|---|---|
| ICE | Icetana Ltd | $0.03 | +87.50% |
| VPR | Volt Group Ltd | $0.185 | +37.04% |
| NH3 | NH3 Clean Energy Ltd | $0.031 | +34.78% |
| LIT | Livium Ltd | $0.012 | +33.33% |
| LYK | Lykos Metals Ltd | $0.022 | +29.41% |
Top Fallers
Code | Company | Last | % Chg |
|---|---|---|---|
| MVF | Monash Ivf Group Ltd | $0.545 | -26.85% |
| DTR | Dateline Resources Ltd | $0.10 | -20.00% |
| LKY | Locksley Resources Ltd | $0.085 | -19.05% |
| REZ | Resources & Energy Group Ltd | $0.013 | -18.75% |
| AZI | Altamin Ltd | $0.024 | -17.24% |
52 Week Highs
Code | Company | Last | % Chg |
|---|---|---|---|
| VPR | Volt Group Ltd | $0.185 | +37.04% |
| NH3 | NH3 Clean Energy Ltd | $0.031 | +34.78% |
| KTA | Krakatoa Resources Ltd | $0.012 | +20.00% |
| WGR | Western Gold Resources Ltd | $0.098 | +15.29% |
| ZIM | Zimplats Holdings Ltd | $16.90 | +14.81% |
52 Week Lows
Code | Company | Last | % Chg |
|---|---|---|---|
| MVF | Monash Ivf Group Ltd | $0.545 | -26.85% |
| TALDE | Talius Group Ltd | $0.06 | -14.29% |
| GLH | Global Health Ltd | $0.066 | -13.16% |
| AUA | Audeara Ltd | $0.023 | -11.54% |
| INF | Infinity Lithium Corporation Ltd | $0.016 | -11.11% |
Near Highs
Code | Company | Last | % Chg |
|---|---|---|---|
| WVOL | Ishares MSCI World Ex Aust Minimum Volatility ETF | $43.90 | -0.25% |
| AII | Almonty Industries Inc | $3.48 | +0.87% |
| GCI | Gryphon Capital Income Trust | $2.04 | +0.49% |
| IHD | Ishares S&P/ASX DIV Opportunities Esg Screened ETF | $15.00 | +0.27% |
| CNEW | Vaneck China New Economy ETF | $7.02 | 0.00% |
Relative Strength Index (RSI) Oversold
Code | Company | Last | % Chg |
|---|---|---|---|
| IPG | Ipd Group Ltd | $2.95 | -1.99% |
| DMP | Domino's PIZZA Enterprises Ltd | $21.04 | -1.22% |
| BBOZ | Betashares Aus Equities Strong Bear Complex ETF | $22.97 | -1.80% |
| AOF | Australian Unity Office Fund | $0.483 | +0.52% |
| AN3PK | Australia and New Zealand Banking Group Ltd | $101.75 | -0.23% |
