
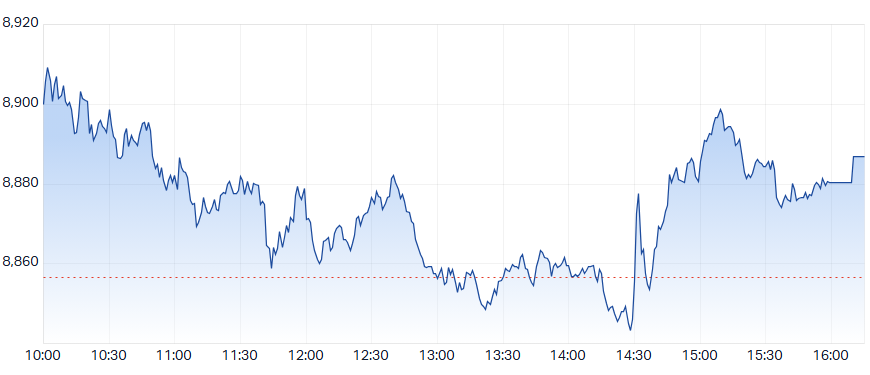
The ASX 200 edged higher after the RBA raised the cash rate to an 18-year high of 4.85 per cent, with investors reading a dovish pivot into the statement and rotating sharply into rate-sensitive stocks. Real estate and consumer discretionary surged on the decision; energy was sold off heavily as the oil price plunged.
Be sure to click/scroll through for the usual reporting of the major sector and stock-specific moves, the broker responses to them, as well as all the key economic data in tonight's Evening Wrap. Also, I have detailed technical analysis on the Nasdaq Composite and the S&P/ASX 200 in today's ChartWatch.
Let’s dive in!
Today in Review
Name | Value | % Chg |
|---|---|---|
Major Indices | ||
| ASX 200 | 8,886.8 | +0.34% |
| All Ords | 9,008.9 | +0.35% |
| Small Ords | 3,151.8 | +0.32% |
| All Tech | 2,830.9 | +0.66% |
| Emerging Companies | 2,696.4 | -0.23% |
Currency | ||
| AUD/USD | 0.6984 | -0.19% |
US Futures | ||
| S&P 500 | 7,562.5 | -0.16% |
| Dow Jones | 51,920.0 | -0.41% |
| Nasdaq | 28,120.0 | -0.03% |
Name | Value | % Chg |
|---|---|---|
Sector | ||
| Real Estate | 3,447.2 | +2.88% |
| Consumer Discretionary | 3,776.9 | +1.87% |
| Communication Services | 1,618.7 | +1.72% |
| Consumer Staples | 13,152.9 | +1.22% |
| Information Technology | 1,630.1 | +0.77% |
| Industrials | 8,344.4 | +0.67% |
| Financials | 9,802.3 | +0.42% |
| Utilities | 10,690.7 | -0.16% |
| Materials | 21,877.0 | -0.17% |
| Health Care | 34,313.6 | -0.58% |
| Energy | 10,662.7 | -3.45% |
ASX 200 Intraday Chart
Markets
The S&P/ASX 200 (XJO) finished 30.3 points higher at 8,886.8, 0.5% from its session low and 0.25% from its high. In the broader-based S&P/ASX 300 (XKO) advancers beat decliners by a decent 176 to 114.
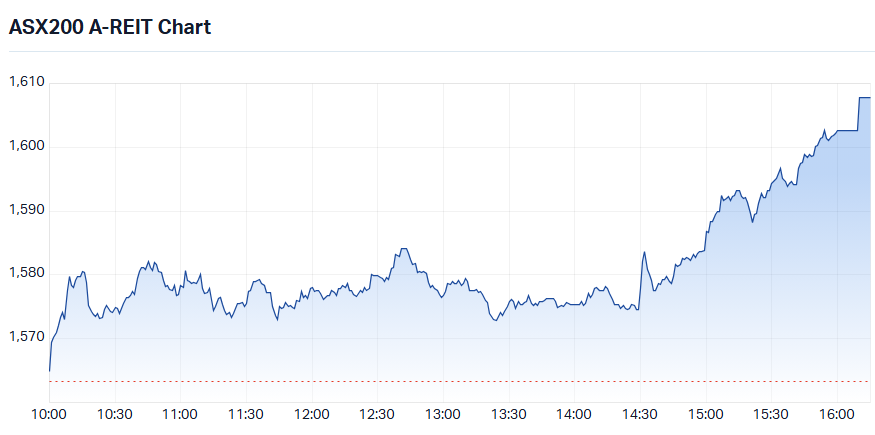
Real Estate (XPJ) (+2.8%) was the session’s standout, with the vast majority of gains stacking in the 90 minutes following the RBA announcement. The central bank raised rates as expected — but it was what the RBA didn’t say that mattered: the board quietly dropped its prior guidance that further hikes may be needed, and bond markets immediately repriced towards “they’re done.”
For real estate stocks, lower expected future rates mean lower discount rates on future cash flows — and valuations jump. Lendlease (LLC) (+5.5%), Stockland (SGP) (+4.0%), Scentre Group (SCG) (+3.7%), and GPT Group (GPT) (+3.6%) led the charge.
S&P/ASX 200 Real Estate Sector Index (XJR) intraday chart
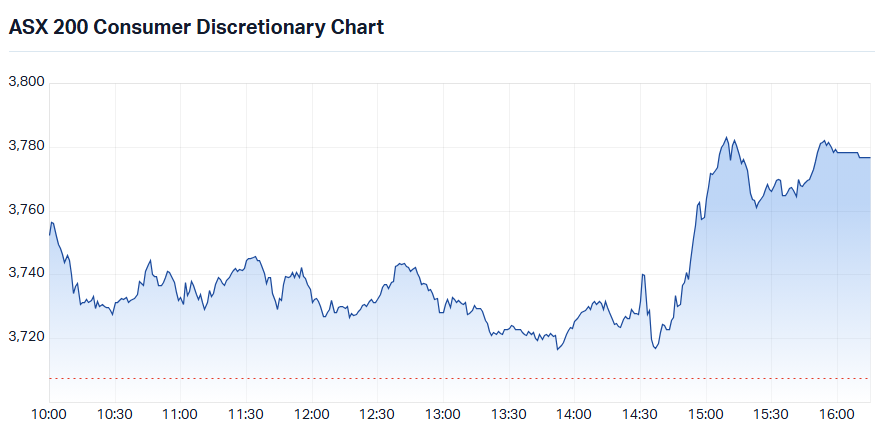
Consumer Discretionary (XDJ) (+1.9%) was the other big winner from the RBA’s perceived peak-rate signal. Intraday charts show flat trading before the announcement — after it, the sector ran. Lower borrowing costs mean more disposable income in consumers’ pockets, and rate-sensitive retailers moved hard. Myer (MYR) (+7.5%), Cettire (CTT) (+7.4%), Temple & Webster (TPW) (+7.0%), and Kogan.com (KGN) (+6.0%) all surged. JB Hi-Fi (JBH) (+3.1%) extended its rebound from last week’s sell-off.
S&P/ASX 200 Consumer Discretionary Sector Index (XDJ) intraday char
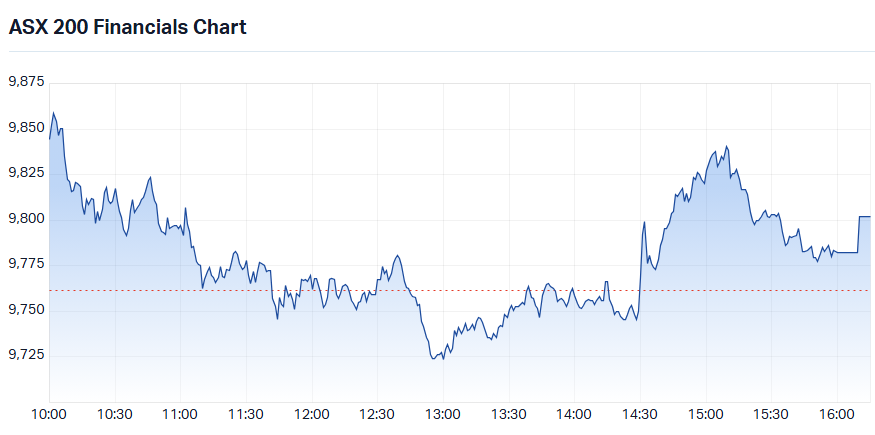
Financials (XFJ) (+0.4%) provided quiet support. Banks are generally seen as beneficiaries of a rate hike — they pass higher rates on to mortgage holders faster than they lift deposit rates — and continued to attract flows rotating out of resources. Hub24 (HUB) (+4.8%), MA Financial (MAF) (+4.7%), Commonwealth Bank of Australia (CBA) (+1.3%), and Macquarie Group (MQG) (+1.2%) all advanced.
S&P/ASX 200 Financials Sector Index (XFJ) intraday chart
Energy (XEJ) (-3.5%) was the session’s biggest drag — ICE benchmark Brent crude oil futures plunged 7.6% overnight after Iran’s supreme leader signalled an openness to diplomacy to resolve the Middle East conflict, before steadying with a +1.1% bounce to US$105.87/bbl in Asian trade.
Oil and gas stocks were hit hardest: Woodside Energy (WDS) (-3.5%) and Santos (STO) (-1.8%) both fell. Coal names also sold off sharply: Yancoal Australia (YAL) (-6.4%), New Hope Corp (NHC) (-5.4%), and Whitehaven Coal (WHC) (-5.1%) all retreated — globalCoal Newcastle coal futures fell -3.0% to US$151.70/t and SGX Australian Premium Coking Coal dropped -1.3% to US$260.50/t. Viva Energy (VEA) (-6.6%) was the worst of the refiners.
Materials (XMJ) (-0.2%) fell steadily from its opening high and — importantly — did not participate in any post-RBA bounce. The sector continues to see capital rotate away toward the big banks (and anywhere else!). COMEX copper futures fell -2.7% to US$6.39/lb in Asian trade, while SGX iron ore futures dipped -0.7% to US$90.80/t. Metals X (MLX) (-3.6%), Sandfire Resources (SFR) (-1.8%), Nickel Industries (NIC) (-1.7%), and Champion Iron (CIA) (-1.6%) all fell.
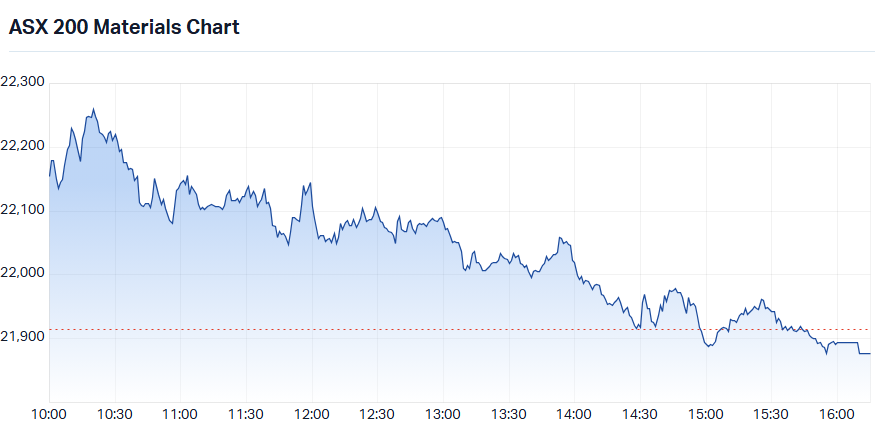
S&P/ASX 200 Materials Sector Index (XMJ) intraday chart
The Gold Sub-Index (XGD) (+0.3%) logged a modest gain — COMEX gold futures rose 1.8% overnight as the oil price plunge provided a tailwind for bullion, though the move faded in Asian trade with gold slipping -1.0% to US$3,930/oz by session’s end. The result was a muted positive for gold stocks that belied the intraday volatility. Newmont (NEM) (+1.2%), Perseus Mining (PRU) (+0.7%), and Ramelius Resources (RMS) (+0.6%) were among the better performers.
Today's best ASX Top 300 gainers
Company | Last Price | Change $ | Change % | 1mo % | 1yr % |
|---|---|---|---|---|---|
| Virgin Australia Holdings (VGN) | $2.70 | +$0.22 | +8.9% | -0.7% | -18.7% |
| Netwealth Group (NWL) | $19.49 | +$1.26 | +6.9% | +13.2% | -36.8% |
| Qantas Airways (QAN) | $9.36 | +$0.56 | +6.4% | +6.5% | -9.7% |
| Barrenjoey Group (BJY) | $8.47 | +$0.49 | +6.1% | +4.7% | -12.8% |
| Harvey Norman Holdings (HVN) | $4.37 | +$0.24 | +5.8% | +4.5% | -40.7% |
| Nick Scali (NCK) | $13.12 | +$0.69 | +5.6% | -6.7% | -48.0% |
| LendLease Group (LLC) | $2.49 | +$0.13 | +5.5% | -5.7% | -54.6% |
| NEXTDC (NXT) | $6.27 | +$0.32 | +5.4% | -41.6% | -59.7% |
| HMC Capital (HMC) | $3.16 | +$0.16 | +5.3% | +8.2% | -2.8% |
| Zip Co (ZIP) | $1.91 | +$0.095 | +5.2% | -7.7% | -51.5% |
| Digico Infrastructure REIT (DGT) | $2.38 | +$0.11 | +4.8% | -3.6% | -10.2% |
| HUB24 (HUB) | $76.50 | +$3.53 | +4.8% | +17.7% | -33.2% |
| MA Financial Group (MAF) | $4.95 | +$0.22 | +4.7% | +5.5% | -48.0% |
| ARB Corporation (ARB) | $17.22 | +$0.75 | +4.6% | -2.1% | -52.1% |
| Flight Centre Travel Group (FLT) | $12.20 | +$0.50 | +4.3% | +18.7% | +0.1% |
| Generation Development Group (GDG) | $3.26 | +$0.13 | +4.2% | +19.9% | -54.7% |
| Eagers Automotive (APE) | $19.86 | +$0.79 | +4.1% | +8.8% | -42.3% |
| Charter Hall Social Infrastructure REIT (CQE) | $2.58 | +$0.10 | +4.0% | +17.8% | -19.6% |
| Credit Corp Group (CCP) | $15.30 | +$0.59 | +4.0% | +7.8% | +5.4% |
| Stockland (SGP) | $4.46 | +$0.17 | +4.0% | +8.5% | -28.8% |
Today's worst ASX Top 300 losers
Company | Last Price | Change $ | Change % | 1mo % | 1yr % |
|---|---|---|---|---|---|
| AMP (AMP) | $2.13 | -$0.22 | -9.4% | -16.5% | +21.0% |
| Smartgroup Corporation (SIQ) | $11.08 | -$0.96 | -8.0% | -1.9% | +34.3% |
| 4DMedical (4DX) | $2.41 | -$0.19 | -7.3% | -44.5% | +51.1% |
| Viva Energy Group (VEA) | $2.70 | -$0.19 | -6.6% | -16.7% | +45.6% |
| Yancoal Australia (YAL) | $5.68 | -$0.39 | -6.4% | -0.5% | +1.6% |
| Benz Mining Corp (BNZ) | $3.85 | -$0.24 | -5.9% | -18.1% | +148.4% |
| McMillan Shakespeare (MMS) | $19.30 | -$1.13 | -5.5% | +6.3% | +19.9% |
| NexGen Energy (Canada) (NXG) | $11.21 | -$0.64 | -5.4% | -12.6% | -25.7% |
| New Hope Corporation (NHC) | $5.61 | -$0.32 | -5.4% | -3.8% | +35.2% |
| PYC Therapeutics (PYC) | $1.80 | -$0.10 | -5.3% | -26.8% | +51.1% |
| EQ Resources (EQR) | $0.27 | -$0.015 | -5.3% | -32.5% | +575.0% |
| Stanmore Resources (SMR) | $2.37 | -$0.13 | -5.2% | -8.5% | +8.7% |
| Whitehaven Coal (WHC) | $7.33 | -$0.39 | -5.1% | -3.4% | +1.5% |
| Helia Group (HLI) | $4.74 | -$0.25 | -5.0% | -6.5% | -11.2% |
| Ampol (ALD) | $37.08 | -$1.93 | -4.9% | -16.1% | +20.5% |
| BCI Minerals (BCI) | $0.515 | -$0.025 | -4.6% | -16.3% | +35.5% |
| Bannerman Energy (BMN) | $3.39 | -$0.16 | -4.5% | +1.5% | -5.3% |
| Megaport (MP1) | $16.92 | -$0.79 | -4.5% | -24.3% | -1.1% |
| Silex Systems (SLX) | $3.34 | -$0.15 | -4.3% | -19.9% | -66.5% |
| Macmahon Holdings (MAH) | $0.975 | -$0.04 | -3.9% | -2.5% | +101.0% |
Chartwatch
Nasdaq Composite Index
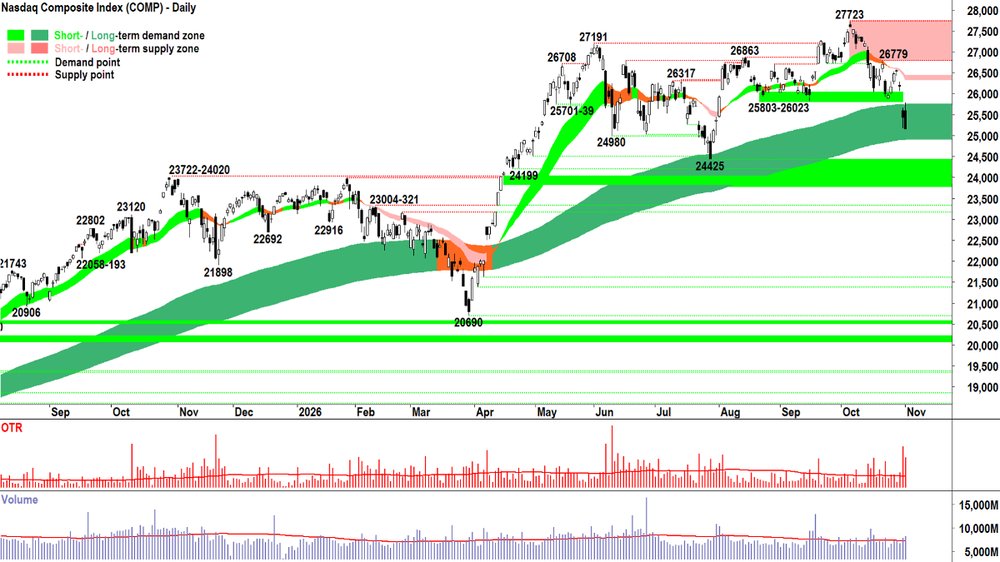
Nasdaq Composite Index chart
Analysis
If you are new to ChartWatch, that last candle… the big black one with the upward pointing shadow and close very, very near the session’s low is the near-perfect manifestation of excess supply.
It shows:
STR = upward pointing shadow, the Comp opened up vs Monday, rallied a bit, then tanked… latent supply was waiting to soak up any optimistic excess demand that was foolish to enter the system early in the session!
NUTE = as prices declined through the session, demand was lurking from those dumb enough to attempt to BTD (the “but surely it’s too low now, it must bounce!?” crowd), but it backed away, and away, far too easily as the day wore on (hence the long black body)
FOHO = desire to continue to hold risk dissolved… those with stock wanted out… with little concern about the price they received… the selling persisted until… ding, ding, ding… the closing bell.
🚫 FOMO = no fear that if one didn’t buy now, one would have to pay a higher price down the track
🚫 HOFU = no inkling in the minds of holders that if they just stuck it out a little longer, they would achieve a better outcome
🚫 BTD = look at the above average volume. Make no mistake — some tried to buy the dip. Volume is buying and selling… simply the above-average demand that was in the system was hit with a wall of motivated selling.
If you’re not new, well, you already knew all that stuff. And you’re not surprised by the candle (consider how many AI trade faithful are bewildered and scared right now! 😱). And if you’re following my risk management model, then probably at least 50% of your potential capital that may be allocated to US stocks is in already cash.💰
Tuesday’s candle is not a good look for the longevity of the current bull market. It’s close is mighty near the bottom of the long term trend ribbon, and the short term trend as measured by the short term trend ribbon, price action, and candles is unequivocally down. 📉
So, that’s it.
Ring the bell on the bull market. 🛎️
It’s cooked! 🍳
Not exactly.
A cursory look at the chart above will observe two recent occasions where the Comp looked “cooked”, but then performed a 180 degree polar opposite reversal... scroll further back and you’ll see plenty more similar instances.
Never count the Comp out. It’s a beast. It can do anything at any time under any circumstance.
Of course, none of that changes our RP. Because it’s not like we’re going to take a punt and allocate risk on the basis of “well the Comp is a beast”.
As trend followers, it simply doesn’t work like that. If anything, my question for you (long suffering ChartWatch readers!) is: Do we cut RP? Do we anticipate that the long term trend is cactus and go to 1/3RP? 🤔
I’m going with: sticking with 50-50 for now, but on that remaining 50… super conservative… and with some strategic shorts! 🌵
View
I am 1/2RP on US stocks (RP = Risk Position – it reflects my personal allowable capital allocation limit for my investments in US stocks. So 1/2RP is 50%, 2/3RP is 67% and FRP is 100%).
Key Levels
26779 is the closest key point of supply, but the short term trend ribbon will also likely act as a dynamic zone of supply (presently 26558–26586). 25803-26023 is the closest key zone of demand.
S&P/ASX 200 (XJO)
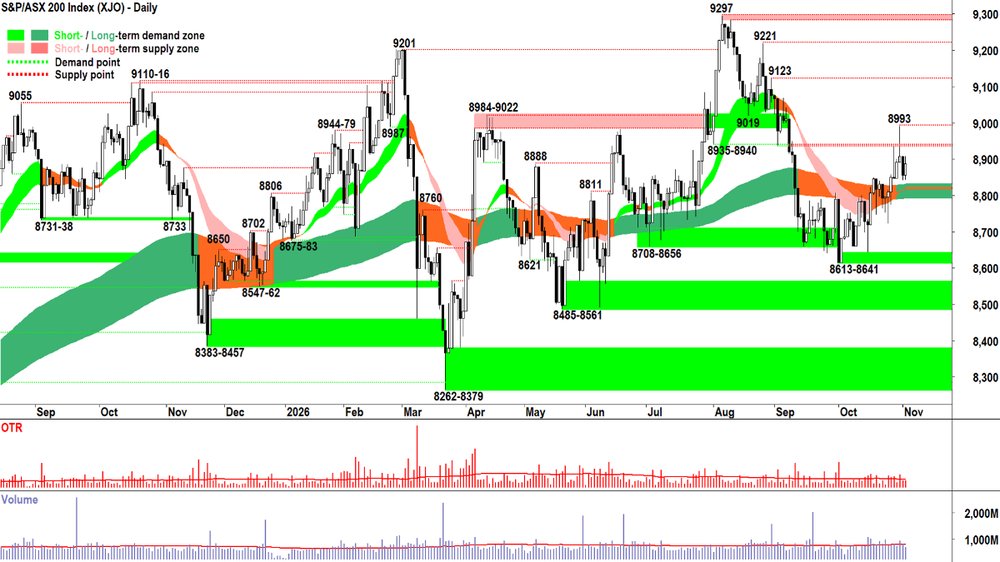
S&P/ASX 200 (XJO) chart
Analysis
No change versus yesterday's analysis. A decent candle on the OTP today considering collective US indices' performance. Although, as noted here many times: an AI trade implosion means little for us...
Unless it becomes a credit / financial system issue. Then = ⚠️🚨
But that doesn't appear to be the case today. 🤞
Be sure to catch the ChartWatch LIVE webinar tomorrow for the Whip Around the Grounds! (link to join in session below 👇)
View
I am 1/2RP on Australian shares (i.e., 50% cash vs 50% invested, with some of the invested portion allocated to shorts).
Key Levels
8935-8940 is the closest zone of supply vs 8613-8641 is the critical zone of demand.
(Glossary of acronyms! Old Tin Pot (OTP): S&P/ASX 200 | MOTN: More Often Than Not | FOMO: Fear Of Missing Out | HOFU: Holding On For Upside | BTD: Buy The Dip | NUTE: No Urgency To Enter | FOHO: Fear Of Holding On | STR: Sell The Rally | RP: Risk Position | FFS: Fund Flow Shenanigans!)
***CHARTWATCH LIVE IS BACK — AND IT KINDA WARNED YOU ABOUT THE AI CRASH!***
ChartWatch LIVE Webinars – WEEKLY Wednesday's @ 12pm AEDT
Learn more about technical analysis and trend following through real case studies on ASX stocks. Australia's premier technical analyst, Carl Capolingua, shares his unique insights on stocks as requested by viewers. Ask about a company in your portfolio or anything related to trading and investing and get Carl's expert opinion.
Places are limited so >REGISTER NOW!<
Economy
TODAY
RBA Board meeting
Cash rate: +0.25% p.a. as forecast to 4.85% p.a.
Press conference with Gov Bullock:
These hikes are aimed at addressing domestic capacity measures (not because of high oil prices).
Parts of demand have also been stronger... in particular, investment into data centres.
Spending in the economy has slowed, housing prices have come down and conditions in the labour market have eased. We expect though, that growth will need to remain subdued and the labour market will need to ease further to bring overall demand and supply back into balance and inflation back into target.
High inflation is particularly painful for those on low incomes… there is nowhere left to cut spending… this is why getting inflation down matters so much. If affects everyone – but the burden is not felt equally.
I know this interest rate rise is tough news for many households, but this is the right thing for the Australian economy. It is critical that we stop inflation expectations from being embedded or the problem will only get worse. Some pain now will prevent even worse pain down the track.
LATER THIS WEEK
TONIGHT
USA October ISM Manufacturing PMI (54.5 forecast, unchanged)
TUESDAY
All Day US Congressional Elections
WEDNESDAY
08:30 AUS October Consumer Spending (+0.2% m/m forecast vs +0.0% m/m in September)
USA October ISM Service PMI (54.9 forecast, unchanged)
THURSDAY
UK Bank of England Official Rate (+0.25% p.a. forecast to 4.00% p.a.)
FRIDAY
21:30 USA October Non-Farm Payroll Data
Employment change: +63,000 forecast v s+29,000 in September
Average hourly earnings: +0.3% m/m forecast vs +0.1% m/m in September
Unemployment rate: +4.2% forecast, unchanged
Interesting Movers
Trading higher
- Cettire (CTT) $0.37+7.4%
No news. Performance reflected general strength in the broader consumer discretionary sector that received a boost after the RBA interest rate decision.
- Kogan.com (KGN) $4.21+6.1%
No news. Performance reflected general strength in the broader consumer discretionary sector.
- Zip Co (ZIP) $1.91+5.2%
No news. Performance reflected general strength in the broader consumer discretionary sector.
Trading Lower
- AMP (AMP) $2.13-9.4%
No news, continued negative response from yesterday's news regarding China Life Pension Company. AMP has a 20% stake in the company.
- NexGen Energy (Canada) (NXG) $11.21-5.4%
No news. Performance reflected general weakness in the broader uranium sector. The URNM ETF was lower overnight after rising early in the session.
- Stanmore Resources (SMR) $2.37-5.2%
No news. Performance reflected general weakness in the broader energy sector. Coal prices down today in sympathy with a sharp decline in the oil price overnight.
- Whitehaven Coal (WHC) $7.33-5.0%
No news. Performance reflected general weakness in the broader energy sector.
Broker Moves
Company | Broker | Action | Rating | Price Target |
|---|---|---|---|---|
A4NAlpha HPA | Bell Potter | Retained | Speculative Buy | $1.20(from $1.50) |
| Ord Minnett | Retained | Speculative Buy | $0.90 | |
AMAAMA Group | Bell Potter | Retained | Buy | $0.83(from $0.85) |
| Morgans | Retained | Buy | $0.74(from $0.75) | |
AMPAMP | Ord Minnett | Downgraded | Hold(from Buy) | $2.60(from $2.80) |
| UBS | Retained | Neutral | $2.60(from $2.61) | |
APXAppen | Ord Minnett | Retained | Buy | $2.40(from $2.60) |
AR1Austral Resources Australia | Shaw and Partners | Retained | Buy | $0.22(from $0.28) |
ARFArena REIT | UBS | Upgraded | Buy(from Neutral) | $2.92 |
BOEBoss Energy | Morgans | Upgraded | Trim(from Sell) | $1.35(from $1.30) |
CBECobre | Shaw and Partners | Initiated | Buy | $0.85 |
CBOCobram Estate Olives | Ord Minnett | Retained | Buy | $3.48(from $3.58) |
CHCCharter Hall Group | UBS | Retained | Buy | $24.00 |
CNICenturia Capital Group | UBS | Retained | Buy | $1.80 |
CQRCharter Hall Retail REIT | UBS | Retained | Neutral | $4.20 |
CWPCedar Woods Properties | Bell Potter | Retained | Buy | $9.45(from $9.60) |
DRRDeterra Royalties | Ord Minnett | Retained | Buy | $4.80 |
DYLDeep Yellow | Morgans | Retained | Speculative Buy | $1.50 |
HSNHansen Technologies | Ord Minnett | Retained | Buy | $5.26 |
JHXJames Hardie Industries Plc | Macquarie | Retained | Outperform | $45.30(from $45.20) |
LMGLatrobe Magnesium | Shaw and Partners | Retained | Buy | $0.06 |
MGRMirvac Group | UBS | Retained | Neutral | $1.99 |
NHFNIB Holdings | Macquarie | Retained | Neutral | $6.60 |
NTUNorthern Minerals | Ord Minnett | Retained | Speculative Buy | $0.05 |
ORGOrigin Energy | Citi | Retained | Buy | $13.40(from $13.25) |
PXAPEXA Group | Macquarie | Retained | Outperform | $13.90 |
RMDResMed Inc. | Morgans | Downgraded | Accumulate(from Buy) | $40.00(from $39.50) |
RMYRMA Global | Bell Potter | Downgraded | Hold(from Speculative Buy) | $0.02(from $0.05) |
SGPStockland | UBS | Retained | Buy | $5.01 |
TCGTuraco Gold | Morgans | Retained | Speculative Buy | $1.45(from $1.18) |
WBCWestpac Banking Corporation | Citi | Retained | Neutral | $35.80(from $36.10) |
| Morgan Stanley | Retained | Underweight | $31.00(from $30.00) | |
| Morgans | Retained | Trim | $32.32(from $31.67) | |
| Ord Minnett | Retained | Lighten | $31.00 | |
| UBS | Retained | Buy | $41.50(from $45.00) | |
WTCWisetech Global | Citi | Retained | Buy | $58.75 |
Scans
Top Gainers
Code | Company | Last | % Chg |
|---|---|---|---|
| CBY | Canterbury Resources Ltd | $0.036 | +33.33% |
| TAT | Tartana Minerals Ltd | $0.011 | +22.22% |
| VFY | Vitrafy Life Sciences Ltd | $2.86 | +21.70% |
| RPM | RPM Automotive Group Ltd | $0.013 | +18.18% |
| B4P | Beforepay Group Ltd | $1.37 | +16.10% |
Top Fallers
Code | Company | Last | % Chg |
|---|---|---|---|
| T3D | 333D Ltd | $0.026 | -25.71% |
| BEO | Beonic Ltd | $0.075 | -25.00% |
| A4N | Alpha Hpa Ltd | $0.335 | -24.72% |
| WMG | Western Mines Group Ltd | $0.125 | -19.36% |
| CC5 | Clever Culture Systems Ltd | $0.016 | -15.79% |
52 Week Highs
Code | Company | Last | % Chg |
|---|---|---|---|
| ATS | Australis Oil & Gas Ltd | $0.038 | +11.77% |
| ASV | Asset Vision Co Ltd | $0.057 | +3.64% |
| REH | Reece Ltd | $18.56 | +2.49% |
| IXI | iShares Global Consumer Staples ETF | $103.70 | +1.70% |
| NUF | Nufarm Ltd | $3.40 | +1.49% |
52 Week Lows
Code | Company | Last | % Chg |
|---|---|---|---|
| A4N | Alpha Hpa Ltd | $0.335 | -24.72% |
| FUL | Fulcrum Lithium Ltd | $0.06 | -14.29% |
| ML8 | Moonlight Resources Ltd | $0.12 | -14.29% |
| SBZ | Schoolblazer Ltd | $0.10 | -13.04% |
| MRZ | Mont Royal Resources Ltd | $0.061 | -12.86% |
Near Highs
Code | Company | Last | % Chg |
|---|---|---|---|
| BEAR | Betashares Australian Equities Bear Complex ETF | $7.41 | -0.14% |
| RHC | Ramsay Health Care Ltd | $55.22 | -0.95% |
| OZBD | Betashares Australian Composite Bond ETF | $43.09 | +0.16% |
| AN3PI | Australia and New Zealand Banking Group Ltd | $102.65 | -0.06% |
| PCI | Perpetual Credit Income Trust | $1.075 | +0.47% |
Relative Strength Index (RSI) Oversold
Code | Company | Last | % Chg |
|---|---|---|---|
| FANG | Global X Fang+ ETF | $33.78 | -2.40% |
| ETPMPM | Global X Metal Securities Australia Ltd | $331.50 | +0.44% |
| RAC | Racura Oncology Ltd | $1.45 | -1.36% |
| AMP | AMP Ltd | $2.13 | -9.36% |
| BHM | Broken Hill Mines Ltd | $0.405 | -5.81% |