News | Market Wraps
Evening Wrap: Trade war losses recouped! ASX 200 closes at fresh record high on surging gold, banking stocks
The S&P/ASX 200 closed 52.6 points higher, up 0.63%.

Mentioned
The S&P/ASX 200 closed 52.6 points higher, up 0.63%.
Another rampaging day for gold stocks underscored a strong overall performance from the Australian stock market today as 10 of the 12 major ASX sectors logged gains. Newmont Mining (NEM) (+4.2%) and Evolution Mining (EVN) (+3.9%) were golden standouts.
The big banks were also notable winners today, with each of the majors and regionals logging gains of +1.2% (Macquarie Group (MQG) (+2.6%) and Bendigo and Adelaide Bank (BEN) (2.5%). Elsewhere within the sector, insurers also rose strongly (Insurance Australia Group (IAG) (2.9%) and Suncorp (SUN) (+2.4%).
IDP Education (IEL) (-48%) was the worst stock in the ASX 200, as it reported a sharp drop in its student enrolment pipeline. Mineral Resources (MIN) (-5.5%) was also in the dumps, as the beleaguered company continues to sag under the weight of softer iron ore and lithium prices.
To make sense of all the above, I have detailed technical analysis on the Nasdaq Composite, S&P/ASX 200, and Gold in today's ChartWatch.
Be sure to click/scroll through for the usual reporting of the major sector and stock-specific moves, the broker responses to them, as well as all the key upcoming economic data in tonight's Evening Wrap.
Let's dive in!
Today in Review
Tue 03 Jun 25, 4:55pm (AEST)
Name | Value | % Chg |
|---|---|---|
Major Indices | ||
| ASX 200 | 8,466.7 | +0.63% |
| All Ords | 8,690.9 | +0.62% |
| Small Ords | 3,242.9 | +0.71% |
| All Tech | 3,993.7 | +0.31% |
| Emerging Companies | 2,287.0 | +0.25% |
Currency | ||
| AUD/USD | 0.649 | 0.00% |
US Futures | ||
| S&P 500 | 5,925.75 | -0.36% |
| Dow Jones | 42,205.0 | -0.40% |
| Nasdaq | 21,465.0 | -0.32% |
Name | Value | % Chg |
|---|---|---|
Sector | ||
| Financials | 9,249.8 | +1.24% |
| Consumer Staples | 12,521.2 | +0.80% |
| Communication Services | 1,844.7 | +0.76% |
| Industrials | 8,358.5 | +0.66% |
| Real Estate | 3,892.9 | +0.65% |
| Energy | 7,896.0 | +0.61% |
| Utilities | 9,232.3 | +0.50% |
| Information Technology | 2,880.7 | +0.35% |
| Materials | 16,284.9 | +0.27% |
| Consumer Discretionary | 4,064.1 | -0.11% |
| Health Care | 41,805.5 | -0.37% |
Markets
%20intraday%20chart%2003%20Jun%202025.png)
ASX 200 Session Chart
The S&P/ASX 200 (XJO) finished 52.6 points higher at 8,466.7, 0.63% from its session low and just 0.15% from its high. In the broader-based S&P/ASX 300 (XKO) advancers beat decliners by a solid 178 to 94.
Hello all, I'm back on deck after the WA Day long weekend during which I celebrated everything WA – hands down the greatest state in the Commonwealth! 💪 (If only the Eagles were able to stick it out in the last quarter against the Cats, it would have been the perfect weekend!)
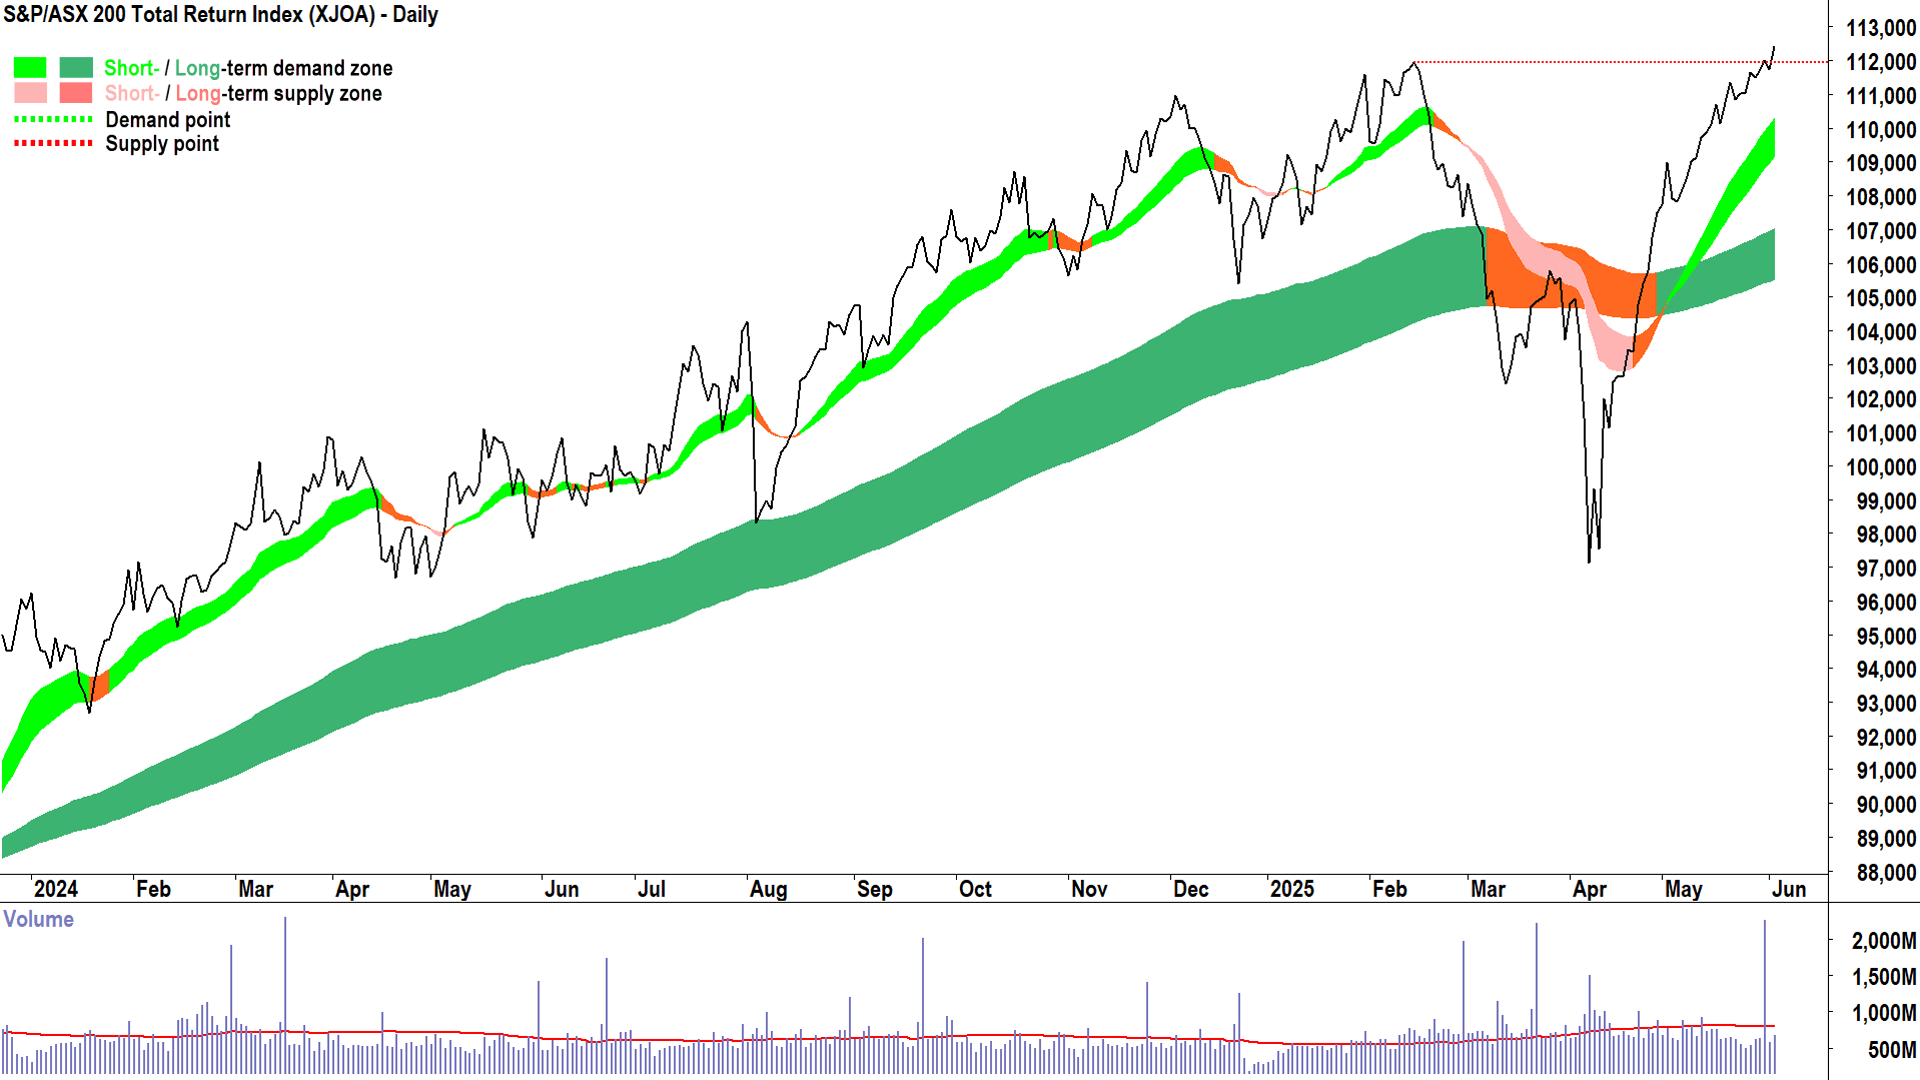
In my last update on Friday, I noted that the All Ordinaries Total Return Index (XAOA) closed just 0.1% from a record high – "total return", i.e, adding back dividends – being the only valid way to measure these things. It escaped me that the narrower S&P/ASX 200 Total Return Index (XJOA) (i.e., 200 vs XAOA's 500 stocks) did in fact close at a new record high. How about that!?
So anyway you look at it, in theory, it has never been better for Aussie shareholders 🥳.

S&P/ASX 200 Total Return Index - closed at a new record high today 🙌🍾 (click here for full size image)
Of course, how it feels for you depends on whether you're holding more of the stocks that have revelled in the post-correction environment like: Gold (+25.2%) Telecommunication Services (+11.3%), Utilities (+9.0%), Consumer Staples (+5.3%), Industrials (+4.3%), and Financials (+1.1%). Or, if you're stuck in the laggards like: Energy (-6.5%), Resources (-3.5%), Consumer Discretionary (-3.3%), and Healthcare (-2.1%).

ASX Total Return Sectors since the Valentines Day peak. Legend: Consumer Discretionary Total Return (XDJA) Energy Total Return (XEJA) Financials Total Return (XFJA) Health Care Total Return (XHJA) Information Technology Total Return (XIJA) ASX 200 Total Return (XJOA) Resources Total Return (XJRA) Industrials Total Return (XNJA) A-REIT Total Return (XPJA) Consumer Staples Total Return (XSJA) Communication Services Total Return (XTJA) Utilities Total Return (XUJA) (click here for full size image)
Some of these moves are skewed by performance heading into that 14-Feb peak, so Utilities have rallied off a low base, whereas Financials and Information Technology are coming off very tough comparisons. Regardless, it's clear that the big fund managers continue to play their favourites.
In the stock market, the rising tide doesn't necessarily lift all boats...
It does challenge the notion one must always have a diversified portfolio of stocks ranging across all sectors. Would it be better to simply have a diversified portfolio of stocks ranging across just the sectors that are in vogue with the fund managers? 🤔
Obviously, for that to work, you'd need some way of explicitly determining which sectors are in vogue and when that switches to not being the case. If only we had such a methodology? Wouldn't that be amazing!? 🤷
I'll let you ponder that tantalising prospect as you scroll past the next couple of blue-chip performance tables TO CHARTWATCH BELOW...(do I need to spell it out for you 😁!?)
Company | Last Price | Change $ | Change % | 1mo % | 1yr % |
|---|---|---|---|---|---|
Newmont Corporation (NEM) | $85.10 | +$3.48 | +4.3% | +4.6% | +37.2% |
Insurance Australia Group (IAG) | $8.80 | +$0.25 | +2.9% | +5.6% | +42.6% |
Suncorp Group (SUN) | $21.14 | +$0.5 | +2.4% | +5.1% | +36.2% |
Sigma Healthcare (SIG) | $3.09 | +$0.07 | +2.3% | -1.9% | +150.2% |
James Hardie Industries (JHX) | $36.71 | +$0.77 | +2.1% | -1.6% | -21.2% |
Qantas Airways (QAN) | $10.87 | +$0.21 | +2.0% | +19.1% | +80.9% |
Bluescope Steel (BSL) | $24.19 | +$0.44 | +1.9% | +2.8% | +15.6% |
Medibank Private (MPL) | $4.96 | +$0.09 | +1.8% | +6.2% | +35.9% |
Northern Star Resources (NST) | $21.26 | +$0.38 | +1.8% | +10.5% | +52.3% |
Westpac Banking Corporation (WBC) | $32.62 | +$0.44 | +1.4% | +0.5% | +25.8% |
Computershare (CPU) | $40.59 | +$0.53 | +1.3% | +4.2% | +55.7% |
ANZ Group (ANZ) | $29.36 | +$0.38 | +1.3% | -2.3% | +5.1% |
Commonwealth Bank of Australia (CBA) | $178.64 | +$2.22 | +1.3% | +7.0% | +51.4% |
National Australia Bank (NAB) | $38.19 | +$0.45 | +1.2% | +6.5% | +13.6% |
Coles Group (COL) | $22.09 | +$0.25 | +1.1% | +0.7% | +36.9% |
Goodman Group (GMG) | $32.99 | +$0.35 | +1.1% | +7.4% | -3.2% |
Telstra Group (TLS) | $4.87 | +$0.05 | +1.0% | +7.5% | +41.6% |
Macquarie Group (MQG) | $214.06 | +$1.94 | +0.9% | +10.1% | +13.6% |
Woolworths Group (WOW) | $32.37 | +$0.27 | +0.8% | -0.5% | +5.7% |
Wesfarmers (WES) | $84.10 | +$0.69 | +0.8% | +6.5% | +31.1% |
Tuesday's blue-chip best 💪
Company | Last Price | Change $ | Change % | 1mo % | 1yr % |
|---|---|---|---|---|---|
Cochlear (COH) | $268.35 | -$3.38 | -1.2% | -0.4% | -16.1% |
Amcor (AMC) | $14.04 | -$0.14 | -1.0% | -2.5% | -4.1% |
CSL (CSL) | $245.45 | -$2.35 | -0.9% | -4.4% | -11.8% |
Aristocrat Leisure (ALL) | $61.49 | -$0.54 | -0.9% | -8.6% | +40.0% |
Mirvac Group (MGR) | $2.30 | -$0.02 | -0.9% | +0.9% | +18.9% |
Rio Tinto (RIO) | $110.02 | -$0.73 | -0.7% | -4.8% | -13.8% |
Sonic Healthcare (SHL) | $26.53 | -$0.16 | -0.6% | +1.9% | +10.5% |
BHP Group (BHP) | $37.56 | -$0.22 | -0.6% | -0.5% | -15.2% |
Pilbara Minerals (PLS) | $1.135 | -$0.005 | -0.4% | -23.3% | -70.1% |
Tuesday's blue-chip worst 😭
ChartWatch
NASDAQ Composite Index

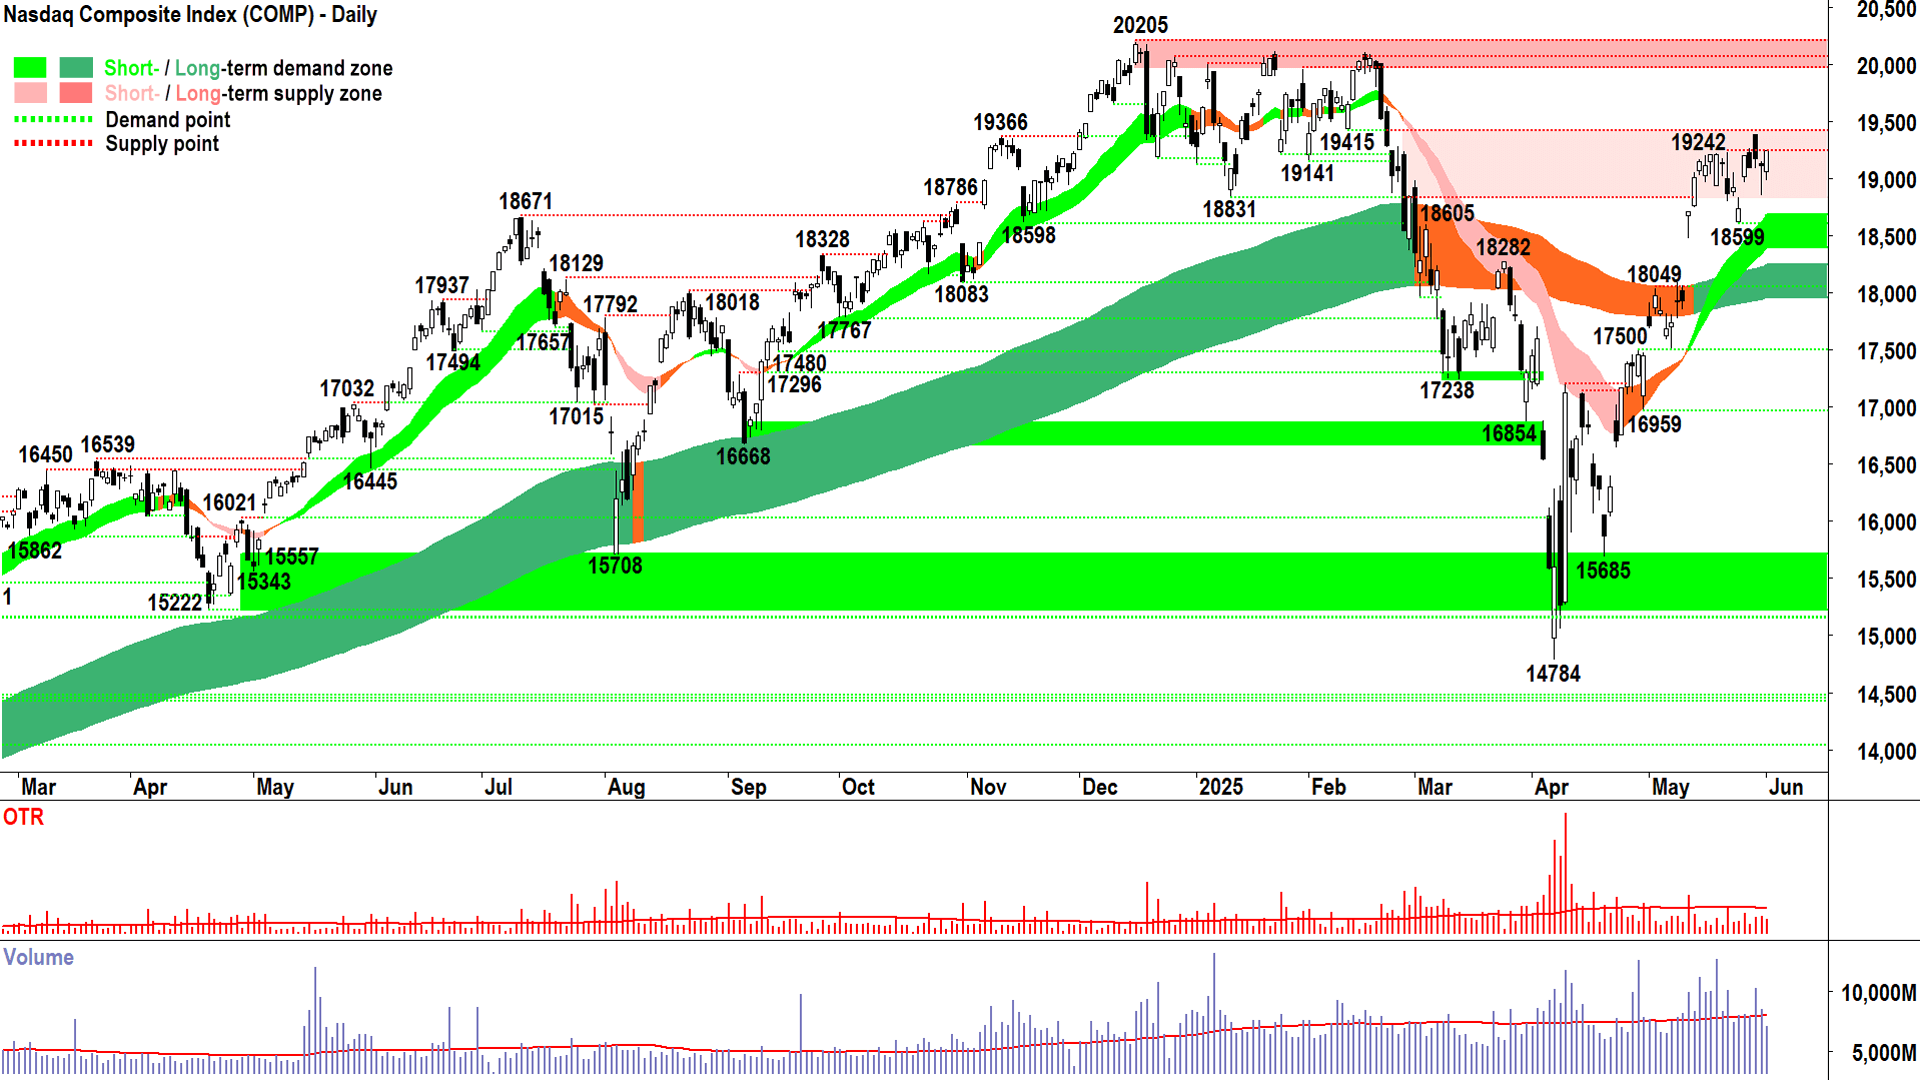
Demand-side control is intact 💪 (click here for full size image)
Looking at Friday’s candle on Saturday morning (i.e., the second last on chart above)…and knowing I wouldn’t be writing an update on Monday, I had every confidence that you would be able to read it as easily as any of the words in this sentence.
And really that’s what candles are…
They’re like words…
And the price action is like sentences…
And the short term trend ribbon is like paragraphs…
And the long term trend ribbon is like chapters…
In the book of whichever chart you happen to be looking at.
Each candle, each swing in the price action, and each adjustment of the trend, tells the story of how demand and supply are shifting in the market to create price. It’s a truly beautiful thing in my opinion 😍.
Before I get too carried away, Friday’s candle…What did it tell you? 🤔
Long downward pointing shadow, close near the high, but still down compared to Thursday’s close…?
= Substantial supply-side push on the open
+ Met with equally substantial demand-side resistance, i.e., buy the dip mentality, soaking up all of that excess supply, and then…
+ Excess demand continued through to pretty much the close of the session.
Always try to think how the market is thinking 🧠:
If I am on the demand-side, I’m going to look at Friday's candle and think: Geez, I’ve got quite a bit of competition here buying the dip…I better be on my toes for opportunities to get liquidity, or I may have to just bit the bullet and pay up to get it…
If I am on the supply-side, I’m going to look at Friday's candle and think: Geez, do I really need to panic out on the slightest bad news? Hey, given all that demand in the market, do I really need to sell at all? Why don’t I hang in there…at least until we get back to the old highs…
Each time we see a candle like Friday’s it emboldens the demand-side and reassures the supply-side. The result is an environment of excess demand – and the result of that is a higher probability of price increases than not.
And that’s all we need to know.
Skip now to Monday’s candle (i.e., the last on the chart above), and it just really confirmed everything we knew concluded from Friday’s candle 👍. It was an emphatic demand-side showing (i.e., downward pointing shadow, white body, close at high of session ✅✅✅).
Add:
Strong uptrends remain intact (rising short and long term uptrend ribbons, ribbons acting as zones of dynamic excess demand).
Price action is flattening, but hey – nothing goes up in a straight line! The candles within this modest stagnation – at a logical zone of supply – continue to demonstrate demand-side resilience.
And so, my conclusion is: Demand-side control is intact. I’m staying the course here. I see no reason for concern until the Comp closes below the short term uptrend ribbon, or prints a massive supply-side candle, or prints lower peaks.
S&P/ASX 200 (XJO)
%20chart%2003%20Jun%202025.png)
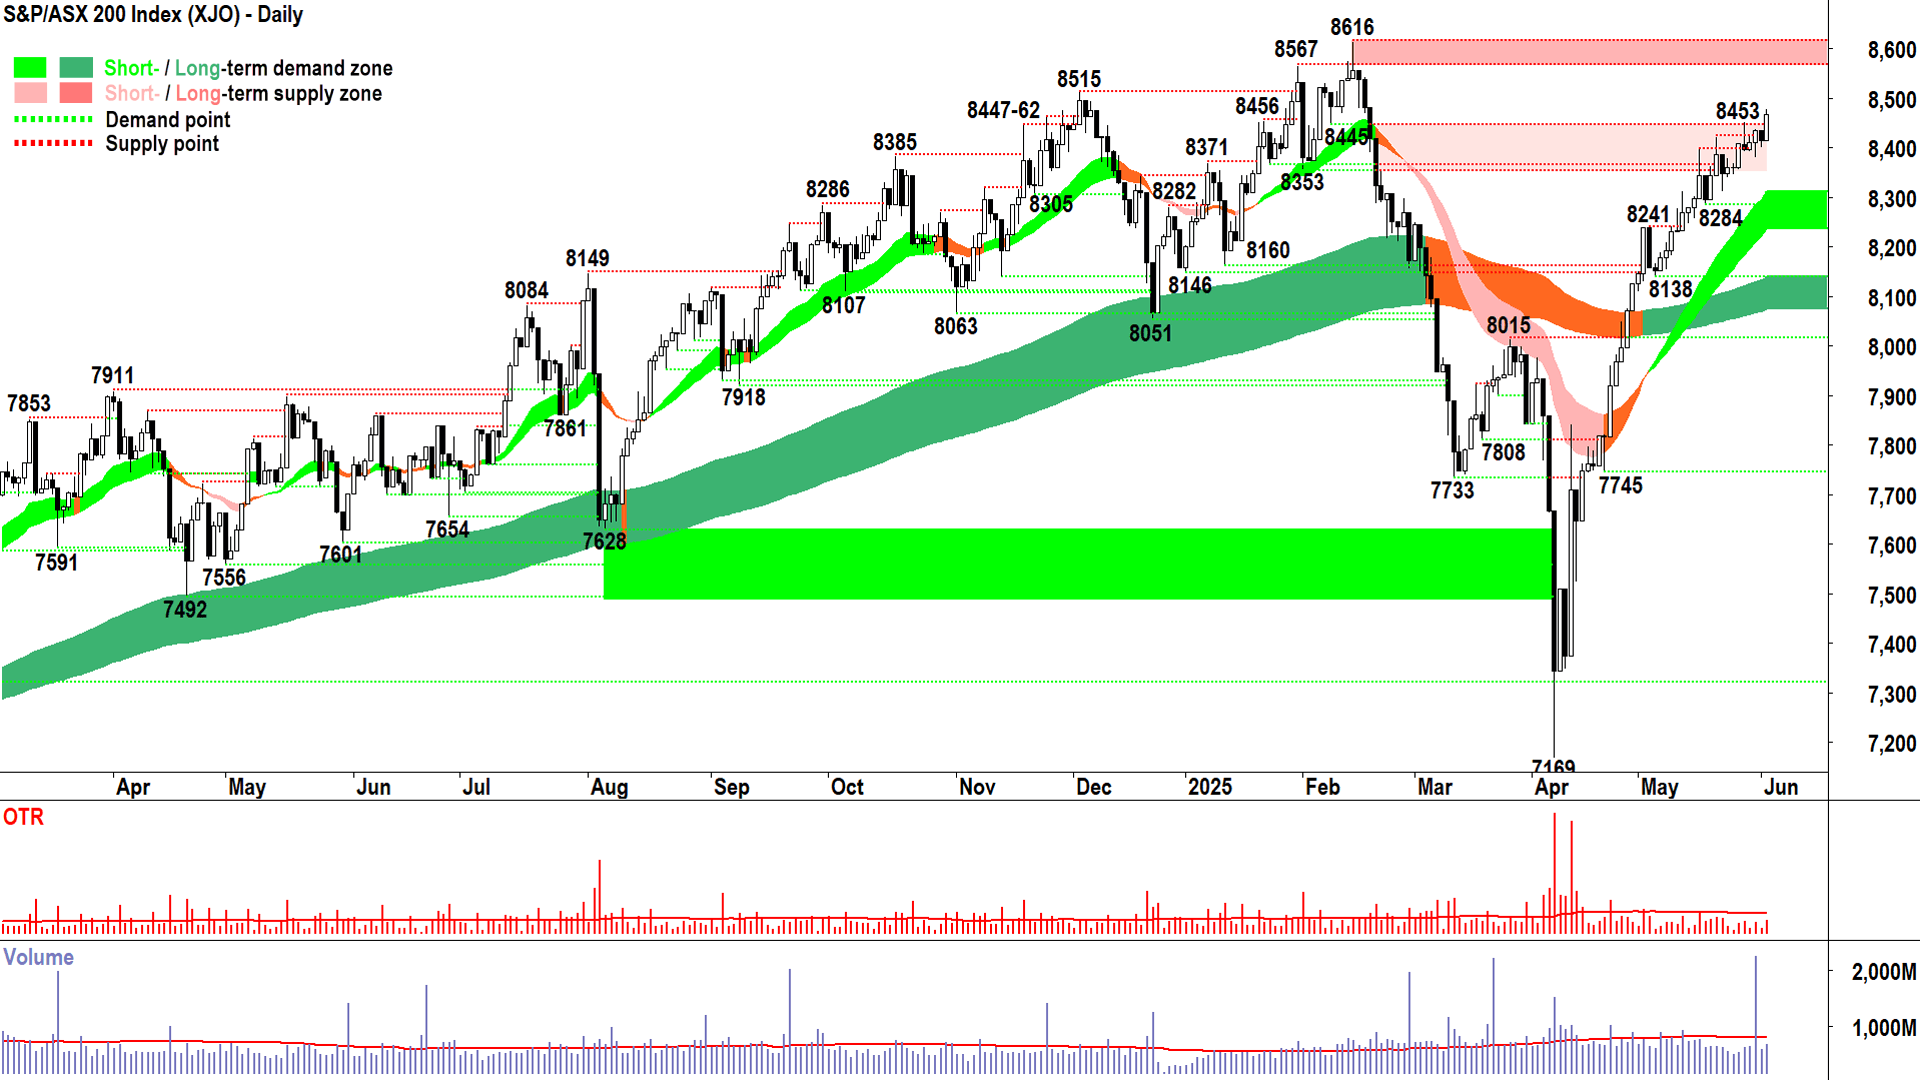
A candle befitting of a bull market 🕯️🐂 (click here for full size image)
It was a candle befitting of a bull market. Decent size, white-body, close near session high.
Bull market I hear you say?
Yes, I believe that’s an accurate description of the current market conditions by any measure – mine or otherwise.
Obviously, as you know, my model says that if short term trend is up, the price action is rising peaks and rising troughs, there is a predominance of demand side candles, the long term trend ribbon is not down, and a trough has been formed above the long term uptrend ribbon (demonstrating it is behaving as a zone of dynamic excess demand), then it is a bull market. I prefer to use the term long term uptrend.
That occurred, as discussed here, on 7 May with the formation of the 8138 trough.
Others might argue a rally of +10% from the correction low constitutes the resumption of the bull market (I think is a little weak given 10% back up is always going to be less than the initial 10% down). Some would argue that only when the price makes a new high that a bull market has begun. Either way, it’s a check in all these boxes (on a total return basis for the new high – which is the stat that matters!).
No reason to doubt the prevailing trends, price action, or candles here. With the close above 8445, 8616 is now the only major point of supply that could cause issues. I expect we’ll get a look at it soon enough.
Until then, happy to stay the course until the XJO closes below the short term uptrend ribbon, or prints a massive supply-side candle, or prints lower peaks.
Gold Futures (Front month, back-adjusted) COMEX
%20COMEX%20chart%2003%20Jun%202025.png)
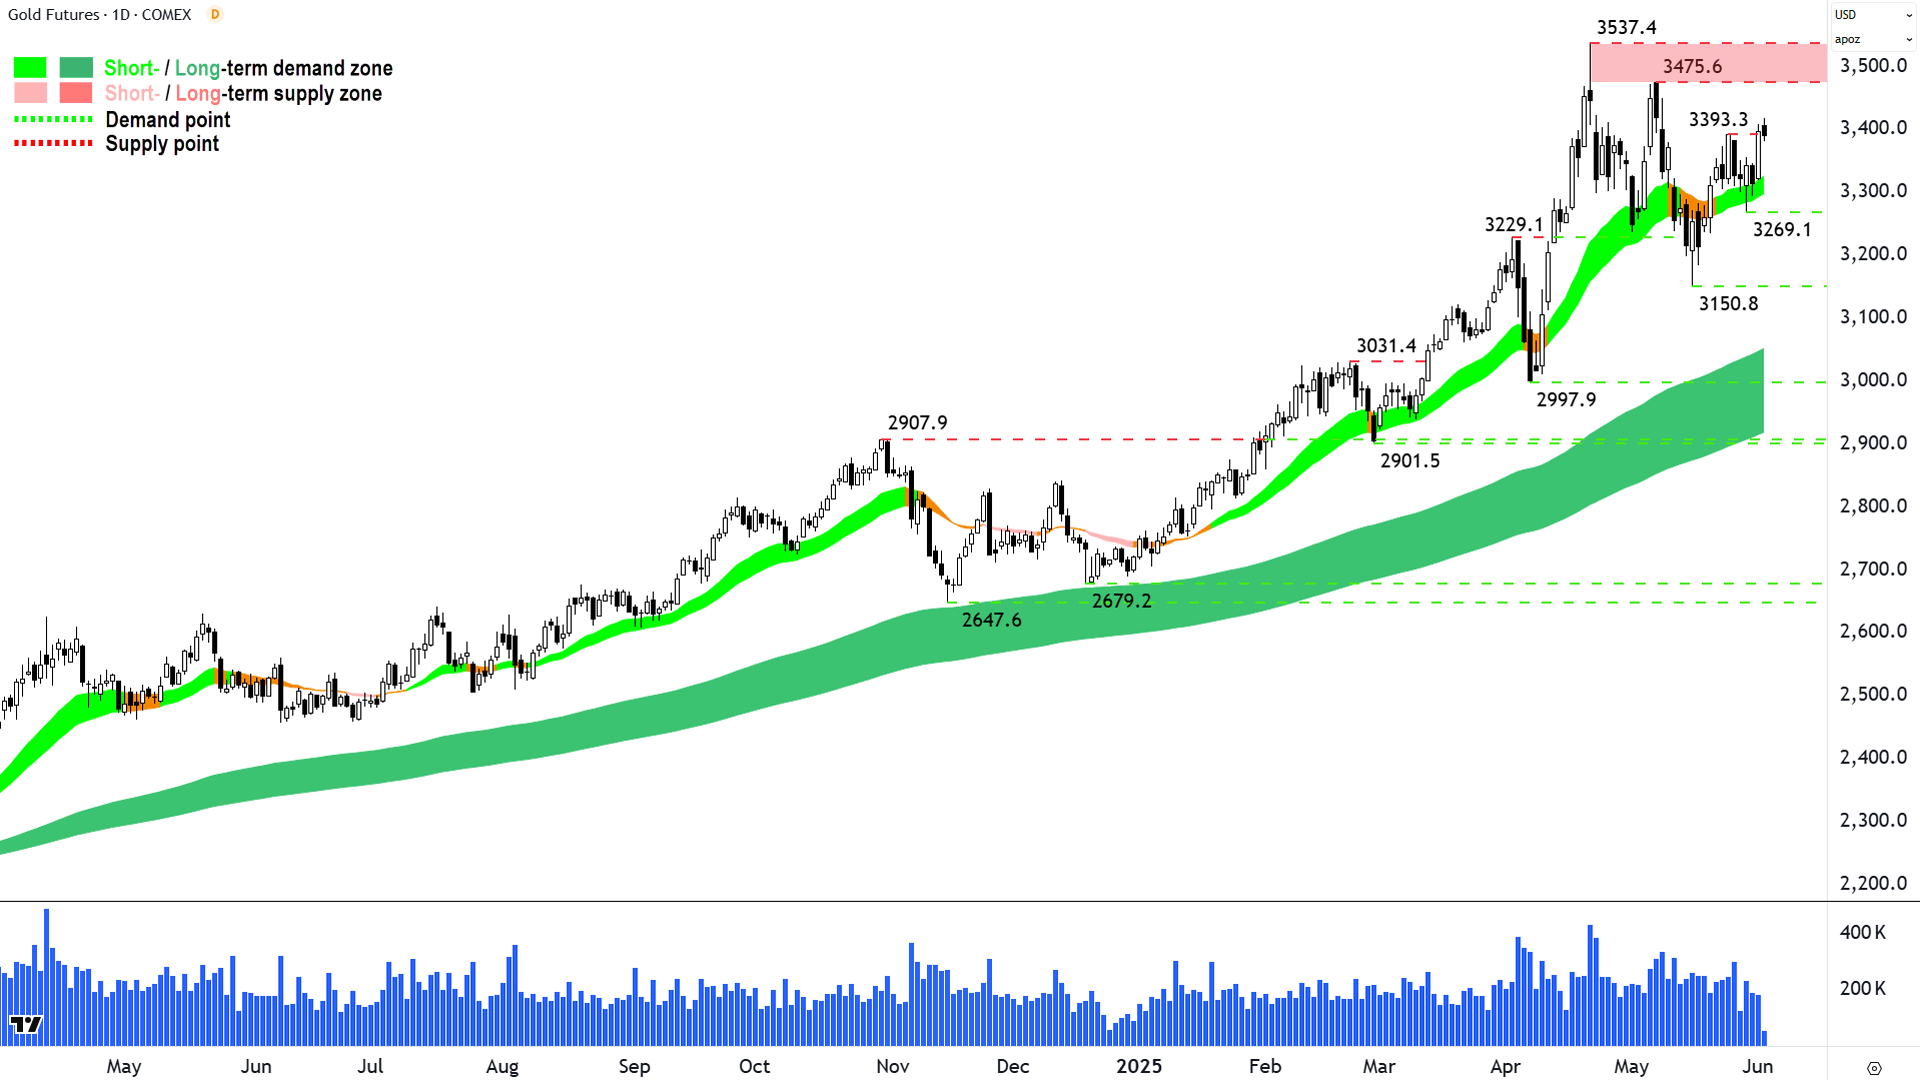
Price is the sum of all theories 🧐 (click here for full size image)
The last time we covered gold was in ChartWatch in the Evening Wrap on 28-May.
In that update, I noted that I was still a “sceptic” on gold, pointing to then-price action of falling peaks and falling troughs.
I have to say, given that gold has subsequently logged a higher trough at 3269.1 – and then on Monday’s candle has eclipsed the 3393.3 peak – my scepticism is waning fast (Monday’s candle is second from last in chart above because today’s candle is last, live candle). So:
We are back to rising peaks and rising troughs (Consider: we don’t know at what price the next trough will form, but it absolutely must be higher than 3393.3!).
We are showing double green on the short / long term trends. Both trend ribbons appear to be doing their job of acting as zones of dynamic excess demand.
Candles are swinging back to strong demand-side showings, and arguably are very close to a equating to a predominance of candles generally.
Each of the above points add up to a re-establishment of demand-side control – and this is a positive for the gold price.
However, I remain wary of the 3475.6-3537.4 supply zone. Given the price action and candles that formed this zone, I suspect there will be some credible supply there that could impede upside progress.
In conclusion, I am once again comfortable entertaining gold longs on the basiswe have a logical and tight stop, i.e., a close below 3269.1. I’ll be watching the candles and price action closely between 3475.6-3537.4 for any signs of motivated excess supply – particularly if an initial supply-side signal is confirmed by another.
It looks like my initial working theory we’d see the long term uptrend ribbon touched before a new high might play out the other way. But theories in trading should never be more than a curiosity – because all that matters is price – it is the sum of all theories!
Economy
Today
CHN Caixin Manufacturing Purchasing Managers Index (PMI) May
48.3 vs 50.7 forecast and 50.4 in April
Readings +/- 50 indicate expansion/contraction in the sector, so this is a major miss and a sharp dip into contraction for the Chinese Manufacturing sector!
Later this week
Tuesday
19:00 EUR Core Consumer Price Index (CPI) Flash Estimate May (+2.4% p.a. forecast vs +2.7% p.a. previous)
Wednesday
00:00 USA JOLTS Job Openings May (7.11 million forecast vs 7.19 million in April)
11:30 AUS Gross Domestic Product (GDP) March q/q (+0.4% q/q forecast vs +0.6% q/q December)
Thursday
00:00 ISM Services PMI May (52.1 forecast vs 51.6 in April)
22:15 EUR Main Refinancing Rate & Monetary Policy Statement (-0.25% to 2.15% forecast)
Friday
00:00 USA Non-Farm Employment Data May
Employment Change m/m: +130,000 forecast vs +177,000 in April
Average Hourly Earnings m/m: +0.3% m/m forecast vs +0.2% m/m in April)
Unemployment Rate: 4.2% forecast, unchanged from April
Latest News
Interesting Movers
Trading higher
+14.9% MTM Critical Metals (MTM) – High-Grade Antimony Recovered at 98% from U.S. E-Waste, rise is consistent with prevailing short and long term uptrends, a regular in ChartWatch ASX Scans Uptrends list 🔎📈
+9.4% Droneshield (DRO) – No news, rise is consistent with prevailing short and long term uptrends, a regular in ChartWatch ASX Scans Uptrends list 🔎📈
+8.6% Tasmea (TEA) – TEA Special Dividend of 12.0 cents per share (fully franked) and Acquisition of Vertex Group, rise is consistent with prevailing short and long term uptrends, a regular in ChartWatch ASX Scans Uptrends list 🔎📈
+7.8% Catalyst Metals (CYL) – No news, general strength across the broader Gold sector today, rise is consistent with prevailing short and long term uptrends, one of the most Featured (highest conviction) stocks in ChartWatch ASX Scans Uptrends list 🔎📈
+7.6% Kelsian Group (KLS) – No news, rise is consistent with prevailing short term uptrend and rising peaks and rising troughs 🔎📈
+6.9% Pepper Money (PPM) – Declaration of a Fully Franked Special Dividend, rise is consistent with prevailing short and long term uptrends, a regular in ChartWatch ASX Scans Uptrends list 🔎📈
+6.7% Titomic (TTT) – Titomic opens its new U.S. facility in Huntsville, Alabama, general strength across the broader Gold sector today, rise is consistent with prevailing short and long term uptrends, a regular in ChartWatch ASX Scans Uptrends list 🔎📈
+6.5% Meeka Metals (MEK) – No news, general strength across the broader Gold sector today, rise is consistent with prevailing short and long term uptrends, a regular in ChartWatch ASX Scans Uptrends list 🔎📈
+6.1% Silver Mines (SVL) – No news, general strength across the broader Precious Metals sector today, rise is consistent with prevailing short term uptrend and long term trend is transitioning from down to up 🔎📈
+5.9% Ora Banda Mining (OBM) – No news, general strength across the broader Gold sector today, rise is consistent with prevailing short and long term uptrends, a recent regular in ChartWatch ASX Scans Uptrends list 🔎📈
+5.8% Tabcorp (TAH) – No news, retained at overweight at Morgan Stanley and price target increased to $0.780 from $0.700, rise is consistent with prevailing short and long term uptrends, a regular in ChartWatch ASX Scans Uptrends list 🔎📈
Trading lower
-48.1% IDP Education (IEL) – Market and Trading Update, fall is consistent with prevailing short and long term downtrends, one of the most Featured (highest conviction) stocks in ChartWatch ASX Scans Downtrends list 🔎📉
-20.7% Dateline Resources (DTR) – Potential Cluster of Breccia Pipes at Colosseum.
-9.5% Findi (FND) – No news 🤔.
-9.2% Audinate Group (AD8) – No news, repelled perfectly from long term downtrend ribbon! 🔎📉
-7.1% Healthco Healthcare and Wellness Reit (HCW) – No news, fall is consistent with prevailing short and long term downtrends, a regular in ChartWatch ASX Scans Downtrends list 🔎📉
-5.5% Mineral Resources (MIN) – No news, fall is consistent with prevailing short and long term downtrends, one of the most Featured (highest conviction) stocks in ChartWatch ASX Scans Downtrends list 🔎📉
-4.3% Elders (ELD) – No news, fall is consistent with prevailing short and long term downtrends, a regular in ChartWatch ASX Scans Downtrends list 🔎📉
-4.3% Redox (RDX) – No news, fall is consistent with prevailing short and long term downtrends, a regular in ChartWatch ASX Scans Downtrends list 🔎📉
Broker Moves
Life360 (360)
Retained at outperform at RBC Capital Markets; Price Target: $30.00
The A2 Milk Company (A2M)
Retained at buy at Citi; Price Target: $8.20
Abacus Group (ABG)
Retained at buy at Citi; Price Target: $1.350
Ampol (ALD)
Retained at overweight at Morgan Stanley; Price Target: $30.00
Aristocrat Leisure (ALL)
Retained at outperform at Macquarie; Price Target: $70.00
Arena Reit. (ARF)
Retained at outperform at Macquarie; Price Target: $3.96
Aroa Biosurgery (ARX)
Retained at buy at Bell Potter; Price Target: $0.850
Retained at buy at Canaccord Genuity; Price Target: $0.900
Retained at speculative buy at Morgans; Price Target: $0.770 from $0.930
Retained at overweight at Wilsons; Price Target: $0.820 from $0.750
Abacus Storage King (ASK)
Retained at buy at Citi; Price Target: $1.400
Andean Silver (ASL)
Retained at speculative buy at Canaccord Genuity; Price Target: $3.05
Ausgold (AUC)
Retained at speculative buy at Morgans; Price Target: $0.940
Bega Cheese (BGA)
Retained at buy at Bell Potter; Price Target: $7.00
Retained at positive at E&P; Price Target: $6.18
Retained at neutral at UBS; Price Target: $6.15
Brickworks (BKW)
Downgraded to hold from outperform at CLSA; Price Target: $35.26 from $30.00
Downgraded to neutral from overweight at Jarden; Price Target: $32.30 from $25.00
Retained at neutral at Macquarie; Price Target: $32.20 from $26.00
Downgraded to hold from accumulate at Ord Minnett; Price Target: $34.90 from $30.00
Retained at buy at UBS; Price Target: $29.00
Beacon Lighting Group (BLX)
Retained at buy at Citi; Price Target: $3.96
Brazilian Rare Earths (BRE)
Retained at speculative buy at Ord Minnett; Price Target: $6.30 from $7.00
BWP Trust (BWP)
Retained at neutral at Citi; Price Target: $3.40
Charter Hall Group (CHC)
Retained at buy at Citi; Price Target: $18.50
Retained at neutral at Macquarie; Price Target: $17.15
Retained at overweight at Morgan Stanley; Price Target: $22.60 from $20.00
Champion Iron (CIA)
Retained at buy at Bell Potter; Price Target: $5.80 from $6.20
Retained at buy at Goldman Sachs; Price Target: $5.80 from $5.70
Retained at buy at Jarden; Price Target: $6.63 from $5.91
Retained at outperform at Macquarie; Price Target: $6.10
Centuria Industrial Reit (CIP)
Retained at outperform at Macquarie; Price Target: $3.34
Charter Hall Long Wale Reit (CLW)
Retained at buy at Citi; Price Target: $4.40
Retained at neutral at Macquarie; Price Target: $3.73
Centuria Capital Group (CNI)
Retained at outperform at Macquarie; Price Target: $1.780
Coles Group (COL)
Retained at buy at Citi; Price Target: $21.00
Charter Hall Retail Reit (CQR)
Retained at buy at Citi; Price Target: $4.00
Retained at neutral at Macquarie; Price Target: $3.51
Coronado Global Resources (CRN)
Retained at hold at Morgans; Price Target: $0.130 from $0.180
DigiCo REIT (DGT)
Retained at outperform at Macquarie; Price Target: $5.33
Domino's Pizza Enterprises (DMP)
Retained at sector perform at RBC Capital Markets; Price Target: $30.00
Droneshield (DRO)
Retained at buy at Shaw and Partners; Price Target: $1.200
Develop Global (DVP)
Retained at speculative buy at Canaccord Genuity; Price Target: $5.05
Dexus Industria Reit. (DXI)
Retained at outperform at Macquarie; Price Target: $3.18
Dexus (DXS)
Retained at neutral at Citi; Price Target: $7.80
Retained at outperform at Macquarie; Price Target: $8.08
EQT (EQT)
Retained at overweight at Wilsons; Price Target: $36.00 from $33.50
Firefly Metals (FFM)
Initiated at buy at Stifel; Price Target: $1.800
Findi (FND)
Retained at add at Morgans; Price Target: $7.55 from $8.35
Retained at buy at Ord Minnett; Price Target: $11.39 from $11.05
Fisher & Paykel Healthcare Corporation (FPH)
Upgraded to neutral from sell at Citi; Price Target: NZ$35.50 from NZ$32.00
Retained at outperform at Macquarie; Price Target: NZ$39.30 from NZ$38.90
Upgraded to overweight from equal-weight at Morgan Stanley; Price Target: $35.90 from $34.00
Generation Development Group (GDG)
Retained at add at Morgans; Price Target: $6.04 from $5.25
Goodman Group (GMG)
Retained at buy at Citi; Price Target: $40.00
Retained at outperform at Macquarie; Price Target: $36.06
Retained at buy at UBS; Price Target: $36.00
Growthpoint Properties Australia (GOZ)
Retained at buy at Citi; Price Target: $2.60
Retained at outperform at Macquarie; Price Target: $2.57
GPT Group (GPT)
Retained at buy at Citi; Price Target: $5.00
Retained at outperform at Macquarie; Price Target: $5.38
Healthco Healthcare and Wellness Reit (HCW)
Retained at outperform at Macquarie; Price Target: $1.050
Homeco Daily Needs Reit (HDN)
Retained at neutral at Macquarie; Price Target: $1.140
Insurance Australia Group (IAG)
Retained at equal-weight at Morgan Stanley; Price Target: $7.95
Integral Diagnostics (IDX)
Retained at buy at Bell Potter; Price Target: $3.65 from $3.59
IDP Education (IEL)
Retained at positive at E&P; Price Target: $17.80
Insignia Financial (IFL)
Upgraded to buy from neutral at UBS; Price Target: $4.50 from $4.00
Ikegps Group (IKE)
Retained at buy at Bell Potter; Price Target: $1.170 from $0.930
Retained at buy at Shaw and Partners; Price Target: $1.200 from $1.100
Ingenia Communities Group (INA)
Retained at buy at Citi; Price Target: $6.50
IPH (IPH)
Retained at outperform at Macquarie; Price Target: $6.75
Iress (IRE)
Retained at buy at Ord Minnett; Price Target: $10.70
Judo Capital (JDO)
Retained at overweight at Morgan Stanley; Price Target: $2.10
Lifestyle Communities (LIC)
Retained at buy at Citi; Price Target: $9.00
Lendlease Group (LLC)
Retained at buy at Citi; Price Target: $7.50
Retained at outperform at Macquarie; Price Target: $7.79
Light & Wonder (LNW)
Retained at outperform at Macquarie; Price Target: $187.00
Lotus Resources (LOT)
Initiated at underweight at JP Morgan; Price Target: $0.130
Lynas Rare Earths (LYC)
Retained at overweight at Morgan Stanley; Price Target: $10.00
Mirvac Group (MGR)
Retained at neutral at Citi; Price Target: $2.30
Retained at outperform at Macquarie; Price Target: $2.56
Mineral Resources (MIN)
Retained at buy at E&P; Price Target: $34.00
Retained at neutral at JP Morgan; Price Target: $22.00
Retained at outperform at RBC Capital Markets; Price Target: $39.00 from $40.00
Retained at neutral at UBS; Price Target: $25.70
Megaport (MP1)
Retained at buy at Citi; Price Target: $9.00
Medibank Private (MPL)
Retained at neutral at Macquarie; Price Target: $4.25
Nick Scali (NCK)
Retained at buy at Citi; Price Target: $20.64
Nine Entertainment (NEC)
Retained at neutral at Macquarie; Price Target: $1.290
NIB (NHF)
Retained at underperform at Macquarie; Price Target: $5.55
National Storage Reit (NSR)
Retained at buy at Citi; Price Target: $2.70
Retained at outperform at Macquarie; Price Target: $2.42
NRW (NWH)
Retained at buy at Citi; Price Target: $3.65
OOH!Media (OML)
Retained at outperform at Macquarie; Price Target: $2.00
Perenti (PRN)
Retained at buy at Citi; Price Target: $1.900 from $1.600
Qualitas (QAL)
Retained at outperform at Macquarie; Price Target: $3.10
QBE Insurance Group (QBE)
Retained at add at Morgans; Price Target: $26.76 from $24.07
Qualitas Real Estate Income Fund (QRI)
Retained at buy at Citi; Price Target: $1.600
Region Group (RGN)
Retained at buy at Citi; Price Target: $2.40
Retained at underperform at Macquarie; Price Target: $2.03
Resmed Inc (RMD)
Retained at buy at Citi; Price Target: $45.00 from $44.00
Scentre Group (SCG)
Retained at buy at Citi; Price Target: $3.90
Retained at neutral at Macquarie; Price Target: $3.24
Stockland (SGP)
Retained at buy at Citi; Price Target: $6.00
Retained at neutral at Macquarie; Price Target: $5.39
Select Harvests (SHV)
Upgraded to outperform from hold at CLSA; Price Target: $5.00 from $4.85
Retained at buy at Ord Minnett; Price Target: $6.05 from $5.80
Retained at buy at UBS; Price Target: $5.30 from $5.40
Retained at market-weight at Wilsons; Price Target: $4.83 from $4.73
Superloop (SLC)
Retained at buy at Citi; Price Target: $2.65
Washington H Soul Pattinson & Company (SOL)
Downgraded to hold from outperform at CLSA; Price Target: $35.26 from $30.00
Downgraded to neutral from overweight at Jarden; Price Target: $32.30 from $25.00
Retained at neutral at Macquarie; Price Target: $32.20 from $26.00
SRG Global (SRG)
Retained at buy at Bell Potter; Price Target: $1.700 from $1.650
Suncorp Group (SUN)
Retained at overweight at Morgan Stanley; Price Target: $22.75
Seven West Media (SWM)
Retained at neutral at Macquarie; Price Target: $0.180
Tabcorp (TAH)
Retained at overweight at Morgan Stanley; Price Target: $0.780 from $0.700
Temple & Webster Group (TPW)
Retained at buy at Citi; Price Target: $21.10
Trajan Group (TRJ)
Retained at buy at Bell Potter; Price Target: $1.500
Tuas (TUA)
Retained at buy at Citi; Price Target: $7.10
Treasury Wine Estates (TWE)
Retained at neutral at Citi; Price Target: $10.50
Retained at outperform at CLSA; Price Target: $13.20
Retained at neutral at Macquarie; Price Target: $8.90
Retained at outperform at RBC Capital Markets; Price Target: $11.00
Vicinity Centres (VCX)
Retained at neutral at Citi; Price Target: $2.40
Retained at neutral at Macquarie; Price Target: $2.11
Viva Energy Group (VEA)
Retained at equal-weight at Morgan Stanley; Price Target: $1.990
Westpac Banking Corporation (WBC)
Retained at underweight at Morgan Stanley; Price Target: $27.30
Woolworths Group (WOW)
Retained at neutral at Citi; Price Target: $33.00
Scans
Top Gainers
Code | Company | Last | % Chg |
|---|---|---|---|
| EPM | Eclipse Metals Ltd | $0.015 | +200.00% |
| G88 | Golden Mile Resources Ltd | $0.018 | +38.46% |
| BYH | Bryah Resources Ltd | $0.015 | +36.36% |
| BCA | Black Canyon Ltd | $0.079 | +29.51% |
| NC1 | Nico Resources Ltd | $0.093 | +27.40% |
Top Fallers
Code | Company | Last | % Chg |
|---|---|---|---|
| BMH | Baumart Holdings Ltd | $0.011 | -73.17% |
| IEL | Idp Education Ltd | $3.88 | -48.06% |
| FDV | Frontier Digital Ventures Ltd | $0.20 | -24.53% |
| UBI | Universal Biosensors Inc | $0.032 | -23.81% |
| EVEDA | EVE Health Group Ltd | $0.023 | -23.33% |
52 Week Highs
Code | Company | Last | % Chg |
|---|---|---|---|
| EPM | Eclipse Metals Ltd | $0.015 | +200.00% |
| BYH | Bryah Resources Ltd | $0.015 | +36.36% |
| SLS | Solstice Minerals Ltd | $0.245 | +19.51% |
| AGD | Austral Gold Ltd | $0.074 | +19.36% |
| MPW | Metal Powder Works Ltd | $1.09 | +17.20% |
52 Week Lows
Code | Company | Last | % Chg |
|---|---|---|---|
| BMH | Baumart Holdings Ltd | $0.011 | -73.17% |
| IEL | Idp Education Ltd | $3.88 | -48.06% |
| FDV | Frontier Digital Ventures Ltd | $0.20 | -24.53% |
| UBI | Universal Biosensors Inc | $0.032 | -23.81% |
| MML | Mclaren Minerals Ltd | $0.026 | -18.75% |
Near Highs
Code | Company | Last | % Chg |
|---|---|---|---|
| IHD | Ishares S&P/ASX DIV Opportunities Esg Screened ETF | $14.85 | +0.82% |
| KOV | Korvest Ltd | $10.70 | +1.33% |
| BILL | Ishares Core Cash ETF | $100.84 | +0.04% |
| HVN | Harvey Norman Holdings Ltd | $5.37 | +2.09% |
| GLDN | Ishares Physical Gold ETF | $41.53 | +1.10% |
Relative Strength Index (RSI) Oversold
Code | Company | Last | % Chg |
|---|---|---|---|
| KMD | KMD Brands Ltd | $0.27 | 0.00% |
| IPG | Ipd Group Ltd | $2.93 | -4.87% |
| DMP | Domino's PIZZA Enterprises Ltd | $21.76 | -2.20% |
| CRN | Coronado Global Resources Inc | $0.105 | 0.00% |
| AOF | Australian Unity Office Fund | $0.48 | +1.05% |
