
The ASX 200 barely held its ground as surging oil prices hammered mining and gold stocks, with the index rescued by a wave of buying in banks, utilities, and healthcare. Consumer discretionary stocks also surged on a standout trading update from Temple and Webster.
Be sure to click/scroll through for the usual reporting of the major sector and stock-specific moves, the broker responses to them, as well as all the key economic data in tonight's Evening Wrap. Also, I have detailed technical analysis on the Nasdaq Composite and the S&P/ASX 200 in today's ChartWatch.
Let’s dive in!
Today in Review
Name | Value | % Chg |
|---|---|---|
Major Indices | ||
| ASX 200 | 8,795.2 | +0.02% |
| All Ords | 8,905.8 | -0.13% |
| Small Ords | 3,066.5 | -2.29% |
| All Tech | 2,822.7 | -0.47% |
| Emerging Companies | 2,656.9 | -2.66% |
Currency | ||
| AUD/USD | 0.7012 | -0.11% |
US Futures | ||
| S&P 500 | 7,699.75 | -0.06% |
| Dow Jones | 52,947.0 | -0.23% |
| Nasdaq | 29,179.0 | +0.13% |
Name | Value | % Chg |
|---|---|---|
Sector | ||
| Consumer Discretionary | 3,772.4 | +2.58% |
| Financials | 9,721.8 | +2.21% |
| Communication Services | 1,598.9 | +1.15% |
| Utilities | 10,809.2 | +0.82% |
| Health Care | 34,549.7 | +0.69% |
| Industrials | 8,194.6 | +0.10% |
| Consumer Staples | 13,890.9 | +0.10% |
| Energy | 10,904.5 | -0.40% |
| Real Estate | 3,243.3 | -0.54% |
| Information Technology | 1,600.4 | -0.92% |
| Materials | 21,345.1 | -3.85% |
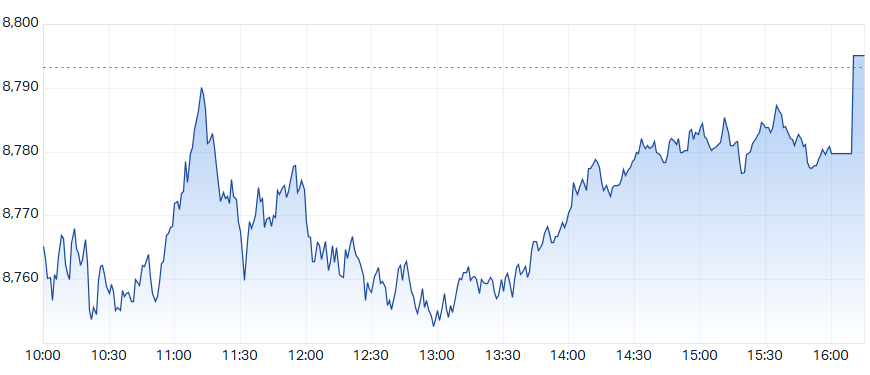
ASX 200 Intraday Chart
Markets
The S&P/ASX 200 (XJO) finished 2.0 points higher at 8,795.2, 0.50% from its session low and smack–bang on its session high. Sounds like a ripper come back, right? Well, consider that In the broader-based S&P/ASX 300 (XKO) advancers lagged decliners by a sizeable 118 to 171.
You might say: “Um, that’s a bid odd… how’s that possible?” 🤔
Okay, do you want the AFR-style "this went up that much and this went down that much" ASX market wrap? Or do the want the heavily biased, cynical "Well that's just how the Old Tin Pot works ladies and gentlemen" ASX market wrap?
I'll do both, because the cynical version only requires two charts (two pictures telling a thousand words!):
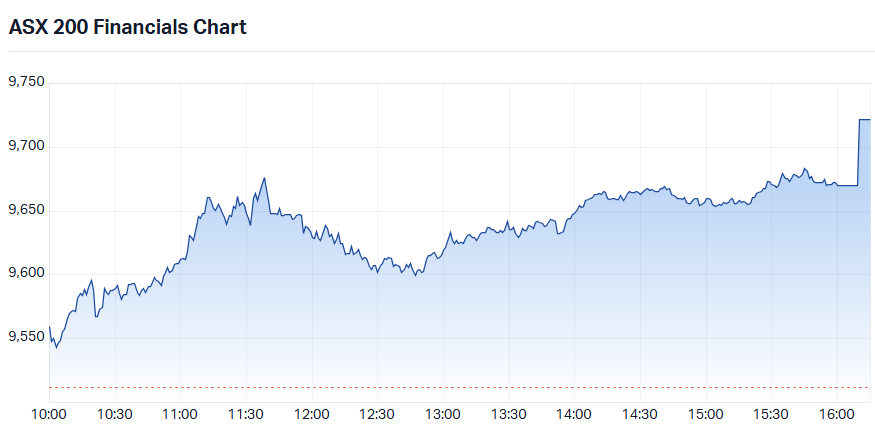
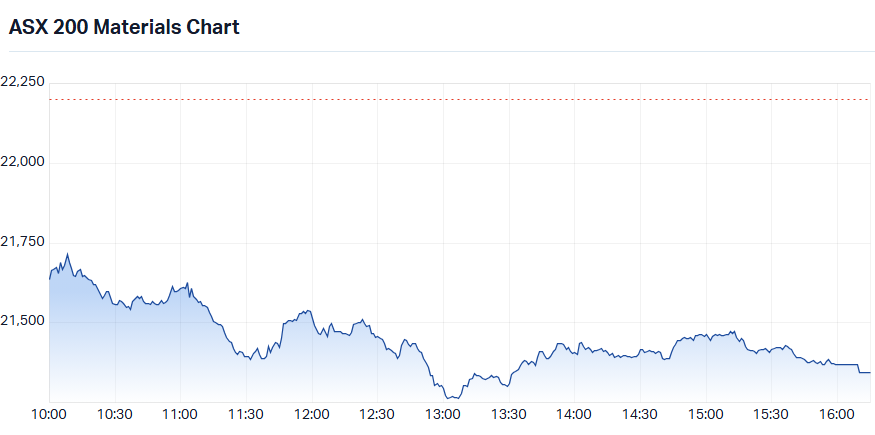
S&P-ASX 200 Financials Sector Index (XFJ) intraday chart (top), and S&P-ASX 200 Materials Sector Index (XMJ) intraday chart (bottom)
You all know what really happened today! Look at the pop in the banks in the closing price auction... Juicy! 🧃😉
Consumer Discretionary (XDJ) (+2.6%) was the session’s standout sector, driven almost entirely at the top by Temple & Webster (TPW) (+33.4%), which surged after its trading update revealed the online furniture retailer had returned to revenue growth. Nick Scali (NCK) (+5.2%) also rebounded sharply after yesterday’s heavy sell-off, while blue-chip retail stalwart Wesfarmers (WES) (+3.8%) added further ballast to the sector.
Financials (XFJ) (+2.2%) acted as the index’s safe-haven anchor, attracting capital withdrawn from the mining sector across the session. A closing auction surge helped consolidate the gains. Commonwealth Bank of Australia (CBA) (+4.3%) led the majors, with National Australia Bank (NAB) (+3.2%), Westpac Banking Corp (WBC) (+3.1%), and ANZ (ANZ) (+0.9%) all advancing.
Communication Services (XTJ) (+1.2%) was anchored by Telstra (TLS) (+1.9%), which also drew defensive flows as investors sought the reliability of a utility-style earnings profile amid the day’s broader risk-off tone.
Utilities (XUJ) (+0.8%) also attracted defensive buying, with AGL Energy (AGL) (+2.5%) the standout and Origin Energy (ORG) (+0.7%) also advancing.
Health Care (XHJ) (+0.7%) joined the defensive cohort, with Cochlear (COH) (+4.4%) the clear leader, followed by ResMed (RMD) (+3.2%) and Pro Medicus (PME) (+2.6%).
Consumer Staples (XSJ) (+0.1%) edged marginally higher, with Inghams (ING) (+0.9%) and Endeavour Group (EDV) (+0.9%) the modest gainers.
The Gold Sub-Index (XGD) (-5.6%) was the session’s worst performer as COMEX benchmark gold futures fell -2.2% overnight. A wave of September quarter updates compounded the damage, with the emerging theme of rising cost pressures weighing heavily. Ora Banda Mining (OBM) (-16.5%) and Black Cat Syndicate (BC8) (-15.8%) were the hardest hit, with Alkane Resources (ALK) (-10.9%) and Catalyst Metals (CYL) (-9.2%) also falling sharply.
Materials (XMJ) (-3.8%) suffered a broad sell-off as ICE benchmark Brent crude oil futures hit their highest level since the Iran conflict began, rising +1.2% to US$114.30/bbl in Asian trade after surging 4% overnight. A double headwind for miners: diesel is their largest direct cost input plus higher energy prices create a drag on global economic growth.
Capital rotated decisively out of the sector with South32 (S32) (-5.3%) the heaviest faller among the larger names. BHP (BHP) (-3.6%) and Rio Tinto (RIO) (-2.7%) were also lower.
Battery and specialty materials stocks were caught in the same sell-off. PLS Group (PLS) (-8.1%) and IGO (IGO) (-7.4%) led lithium names lower, while Lynas Rare Earths (LYC) (-5.9%) fell sharply and Mineral Resources (MIN) (-4.3%) dropped despite posting record lithium sales in the September quarter (a reminder that strong operational results offer little shelter on a day when the whole sector is being de-risked!)
In other commodities moves, COMEX benchmark copper futures fell -2.8% overnight — hitting their lowest level in more than five weeks as investors worried the AI infrastructure spending slowdown could crimp demand for key industrial metals — before partially recovering to US$6.469/lb, up +1.1% in Asian trade. COMEX benchmark gold futures rebounded +0.7% to US$4,034.10/oz in the Asian session after the overnight rout.
Today's best ASX Top 300 gainers
Company | Last Price | Change $ | Change % | 1mo % | 1yr % |
|---|---|---|---|---|---|
| Zimplats Holdings (ZIM) | $14.01 | +$1.01 | +7.8% | -9.6% | -25.0% |
| Nick Scali (NCK) | $12.65 | +$0.62 | +5.2% | -11.3% | -43.1% |
| Cochlear (COH) | $146.81 | +$6.22 | +4.4% | +4.1% | -49.6% |
| Commonwealth Bank of Australia (CBA) | $164.00 | +$6.83 | +4.3% | +7.7% | -4.5% |
| Premier Investments (PMV) | $13.93 | +$0.56 | +4.2% | +24.3% | -22.0% |
| Wesfarmers (WES) | $80.29 | +$2.91 | +3.8% | +9.5% | -12.7% |
| Whitehaven Coal (WHC) | $7.91 | +$0.26 | +3.4% | +1.8% | +12.8% |
| National Australia Bank (NAB) | $41.31 | +$1.30 | +3.2% | +7.0% | -4.8% |
| Harvey Norman Holdings (HVN) | $4.17 | +$0.13 | +3.2% | +0.7% | -42.7% |
| ResMed Inc. (RMD) | $35.91 | +$1.10 | +3.2% | +13.8% | -12.9% |
| Westpac Banking Corporation (WBC) | $36.79 | +$1.11 | +3.1% | +5.4% | -5.4% |
| Perpetual (PPT) | $17.08 | +$0.49 | +3.0% | +2.7% | -11.5% |
| Amcor Plc (AMC) | $65.99 | +$1.89 | +2.9% | +11.6% | +4.9% |
| Light & Wonder Inc. (LNW) | $130.00 | +$3.54 | +2.8% | +15.5% | +9.0% |
| Bendigo and Adelaide Bank (BEN) | $10.57 | +$0.27 | +2.6% | +1.4% | -16.7% |
| Charter Hall Group (CHC) | $20.03 | +$0.51 | +2.6% | +9.7% | -12.9% |
| McMillan Shakespeare (MMS) | $19.79 | +$0.50 | +2.6% | -0.2% | +12.4% |
| Pro Medicus (PME) | $198.38 | +$4.96 | +2.6% | +20.7% | -29.6% |
| New Hope Corporation (NHC) | $6.10 | +$0.15 | +2.5% | +1.8% | +56.0% |
| Dalrymple Bay Infrastructure (DBI) | $5.74 | +$0.14 | +2.5% | +5.7% | +31.1% |
Today's worst ASX Top 300 losers
Company | Last Price | Change $ | Change % | 1mo % | 1yr % |
|---|---|---|---|---|---|
| Zip Co (ZIP) | $1.46 | -$0.61 | -29.5% | -34.8% | -63.6% |
| Ora Banda Mining (OBM) | $1.11 | -$0.22 | -16.5% | -27.0% | -13.3% |
| WIA Gold (WIA) | $0.395 | -$0.065 | -14.1% | -14.1% | +17.9% |
| Sunrise Energy Metals (SRL) | $12.68 | -$2.01 | -13.7% | -38.1% | +166.9% |
| Alkane Resources (ALK) | $1.475 | -$0.18 | -10.9% | -24.4% | +37.9% |
| Minerals 260 (MI6) | $0.66 | -$0.075 | -10.2% | -26.3% | +112.9% |
| Benz Mining Corp (BNZ) | $3.88 | -$0.44 | -10.2% | -24.4% | +135.9% |
| Southern Cross Gold Consolidated (SX2) | $8.98 | -$0.94 | -9.5% | -31.2% | +7.5% |
| FireFly Metals (FFM) | $1.225 | -$0.125 | -9.3% | -31.0% | -20.6% |
| Catalyst Metals (CYL) | $4.75 | -$0.48 | -9.2% | -17.8% | -32.0% |
| Metals X (MLX) | $1.475 | -$0.145 | -9.0% | -28.7% | +71.5% |
| PLS Group (PLS) | $2.62 | -$0.23 | -8.1% | -36.6% | -11.5% |
| Kingsgate Consolidated (KCN) | $3.94 | -$0.34 | -7.9% | -25.8% | +1.8% |
| Capricorn Metals (CMM) | $12.39 | -$1.06 | -7.9% | -20.0% | -4.8% |
| PDI Gold (PDI) | $3.54 | -$0.30 | -7.8% | -26.4% | +24.2% |
| Genesis Minerals (GMD) | $6.16 | -$0.52 | -7.8% | -18.4% | +2.3% |
| GR Engineering Services (GNG) | $6.25 | -$0.50 | -7.4% | -16.9% | +72.7% |
| IGO (IGO) | $4.77 | -$0.38 | -7.4% | -29.7% | -11.5% |
| Liontown (LTR) | $0.64 | -$0.05 | -7.2% | -37.3% | -42.1% |
| Pantoro Gold (PNR) | $2.58 | -$0.20 | -7.2% | -9.5% | -53.9% |
Chartwatch
Nasdaq Composite Index
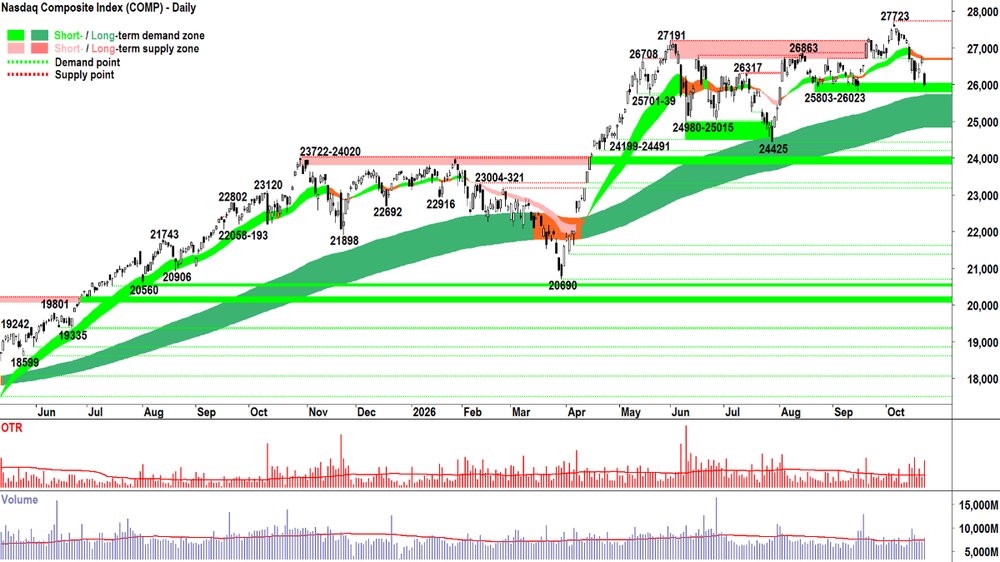
Nasdaq Composite Index chart
Analysis
Oof!
That was not the candle I was expecting. I assume you found yourself with at least one elevated eyebrow when you check the chart this morning! 😯
But, I wouldn’t say I’m surprised. As much as we respect the Comp as a beast, the technicals are the technicals. And all of the analysis we’ve done this week pointed to an equilibrium market.
Demand and supply roughly equally matched in terms of size and motivation. ⚖️
This means either was likely to throw and land the next punch.
That was quite a punch: Gap down. Open roughly the high. Long black candle from there. Close near the low. Close below the 16-Oct point of demand. ⚠️⚠️⚠️⚠️⚠️
And check out the OTR: a very decent punch landed by the supply side. Volume was above average, too.
Let’s add:
Lower peak now formed (Weds high of 26779 compared to 27723)
Short term trend ribbon confirmed as a point of dynamic supply (can I say… like bloody clockwork = how good are my ribbons!? 💪)
It looks like short term supply side control to me. Long term remains demand side control. But we’re now so definitive on the short term trend… compared to the rest of this week’s previous assumption of equilibrium.
Fortunately, through great luck or great judgement — I’m already at 1/2RP on my US portfolio.
And ST Trend ⬇️ vs LT Trend ⬆️ = ⚖️ = No change required.
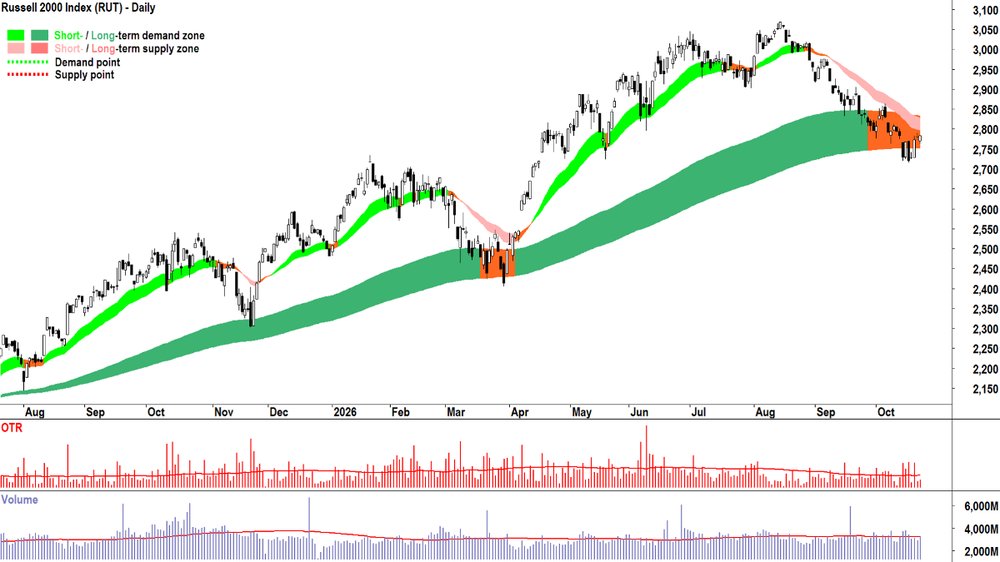
Russell 2000 chart
(The RUT fared far better than the Comp, which is a good sign... but it doesn't change the overall analysis or view here...)
View
I am 1/2RP on US stocks (RP = Risk Position – it reflects my personal allowable capital allocation limit for my investments in US stocks. So 1/2RP is 50%, 2/3RP is 67% and FRP is 100%).
Key Levels
26779 is the closest key point of supply, but the short term trend ribbon will also likely act as a dynamic zone of supply (presently 26690-26727). 25803 as the closest key point of demand, then it's the long term uptrend ribbon (presently 24836-25712).
S&P/ASX 200 (XJO)
S&P/ASX 200 (XJO) chart
Analysis
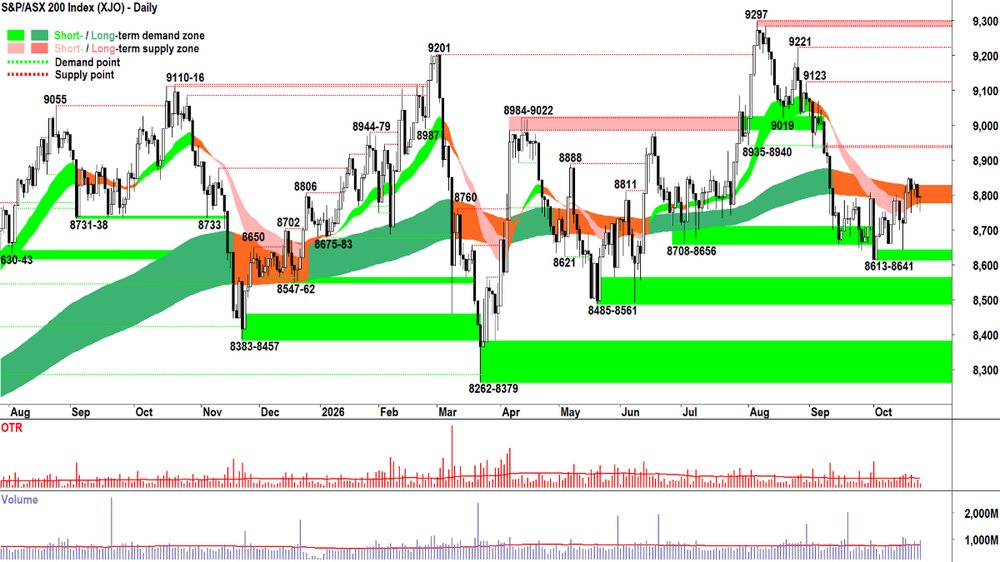
For the week, the XJO finished down 11.5 points or 0.13% lower, roughly in the middle of its intraweek range, 0.6% from its intraweek high/low. Looking at the above chart... roughly in the middle seems like an appropriate result of a frustrating week where (probably) half your portfolio went up quite a bit and half of it went down quite a bit.
"I'm trying to make some sense of it all... but I can see it makes no sense at all... clowns to the left... jokers to the right..." 🎶🎵
And here we are... stuck in the middle with the OTP! 🤦
View
I am 1/3RP on Australian shares (i.e., 67% cash vs 33% invested, with some of the invested portion allocated to shorts).
Key Levels
8935-8940 is the closest zone of supply vs 8613-8641 is the critical zone of demand.
(Glossary of acronyms! Old Tin Pot (OTP): S&P/ASX 200 | MOTN: More Often Than Not | FOMO: Fear Of Missing Out | HOFU: Holding On For Upside | BTD: Buy The Dip | NUTE: No Urgency To Enter | FOHO: Fear Of Holding On | STR: Sell The Rally | RP: Risk Position | FFS: Fund Flow Shenanigans!)
ChartWatch LIVE Webinars – WEEKLY Wednesday's @ 12pm AEDT
Learn more about technical analysis and trend following through real case studies on ASX stocks. Australia's premier technical analyst, Carl Capolingua, shares his unique insights on stocks as requested by viewers. Ask about a company in your portfolio or anything related to trading and investing and get Carl's expert opinion.
Places are limited so >REGISTER NOW!<
Economy
TODAY
09:00 AUS Flash October Purchasing Managers Index ("PMI")
Manufacturing: 49.7 vs 49.6 previous (revised up from 49.3)
Services: 47.8 vs 51.9 previous (revised up from 51.4)
Reader: PMI readings below 50 indicate contraction in a sector / above 50 indicate expansion. So, manufacturing contracted at a slightly slower rate this month compared to September. Services is the big surprise — it tanked, moving into contraction.
LATER THIS WEEK
SATURDAY
09:00 USA Flash October PMI's
Manufacturing: 55.5 forecast vs 55.9 previous (revised down from 57.0)
Services: 58.0 forecast vs 58.8 previous (revised up from 58.7)
Interesting Movers
Trading higher
- Temple & Webster Group (TPW) $5.43+33.4%
Issued a trading update at its AGM held today. Management reaffirmed FY27 EBITDA guidance of $33m–$40m (midpoint above consensus). Contribution margin dollars rose 16% despite an 8% revenue decline. Now expects return to revenue growth from mid‑February and plans NZ AI‑led site launch.
- Commonwealth Bank of Australia (CBA) $164.00+4.4%
No news. Which bank is the biggest of a very JUICY Financials sector today? 🧃 The cash bleeding from the mining sector had to find a home today, and CBA and Co. were major beneficiaries.
- Whitehaven Coal (WHC) $7.91+3.4%
Released September quarter results. Ramped up production (11Mt q/q vs +22% y/y) and earned $226/t vs $188 previous corresponding period on strong coal prices. Management maintained full-year production, sales and cost guidance despite port disruptions and higher inventories.
Trading Lower
- Zip Co (ZIP) $1.46-29.5%
Issued a September quarter results and trading update. Management maintained FY27 cash EBTDA guidance of $340m despite a $10.1m hit from a US fraud incident. However, net bad debts rose to 1.97% and analysts questioned onboarding controls after the US fraud event.
- Ora Banda Mining (OBM) $1.11-16.5%
Released September quarter results. Sold 33,939 oz and produced 33,305 oz at an AISC of A$4,214/oz. Unit costs were elevated due to an extended mill shutdown and weather impacts. Management maintained FY27 guidance. Closing cash of $207.0 million, with $83.3 million in operating cash flows.
- Black Cat Syndicate (BC8) $0.59-15.8%
Released September quarter results. Gold production 19,153 oz at an AISC of $3,735/oz. Realised price of $6,065/oz, resulting in positive operating cashflow of $39 million. Cash and liquid investments decreased from $105 million to $78 million. Management said that committed toll treating expected to cease in Dec-2026, after which processing 100% of own ore is expected to materially uplift operating cash flow in H2 FY27.
- Mineral Resources (MIN) $42.36-4.3%
Released September quarter results. Cut debt by $200m to $4.1bn in the Sept quarter on record lithium sales (170,000t) and stronger mining activity. Management maintained full‑year production and cost guidance.
Broker Moves
Company | Broker | Action | Rating | Price Target |
|---|---|---|---|---|
A1MAIC Mines | Bell Potter | Retained | Buy | $1.20(from $1.15) |
| Morgans | Retained | Buy | $1.20 | |
| Ord Minnett | Retained | Buy | $1.00(from $1.10) | |
ALLAristocrat Leisure | Citi | Retained | Buy | $61.00 |
| UBS | Retained | Buy | $69.40 | |
ALXAtlas Arteria | Ord Minnett | Retained | Hold | $3.40(from $4.70) |
APAAPA Group | Morgan Stanley | Retained | Equal Weight | $10.46 |
BAPBapcor | Morgan Stanley | Retained | Underweight | $0.28 |
| Morgans | Retained | Hold | $0.94(from $0.88) | |
| Ord Minnett | Retained | Hold | $0.80 | |
BPTBeach Energy | Citi | Retained | Sell | $0.80 |
BXBBrambles | Ord Minnett | Retained | Buy | $24.10(from $24.40) |
| UBS | Retained | Buy | $24.50 | |
CTMCentaurus Metals | Canaccord Genuity | Retained | Speculative Buy | $1.05 |
EDVEndeavour Group | Ord Minnett | Downgraded | Sell(from Lighten) | $2.30(from $2.50) |
| UBS | Retained | Neutral | $3.25 | |
FMGFortescue | Macquarie | Retained | Outperform | $18.00(from $19.00) |
| Morgan Stanley | Retained | Underweight | $14.55 | |
| Ord Minnett | Retained | Accumulate | $17.50(from $19.00) | |
| UBS | Retained | Neutral | $14.90(from $15.90) | |
GDGGeneration Development Group | Bell Potter | Retained | Buy | $5.00(from $5.20) |
| Macquarie | Retained | Outperform | $3.90 | |
| Morgan Stanley | Retained | Overweight | $5.20 | |
| Morgans | Retained | Buy | $5.98 | |
GMDGenesis Minerals | Bell Potter | Retained | Buy | $9.30(from $9.00) |
| Canaccord Genuity | Retained | Buy | $9.75(from $9.65) | |
| UBS | Retained | Buy | $10.55(from $10.70) | |
HMYHarmoney Corp | Ord Minnett | Retained | Buy | $1.40(from $1.42) |
KARKaroon Energy | Macquarie | Downgraded | Neutral(from Outperform) | $1.75 |
| Morgan Stanley | Retained | Overweight | $1.85 | |
LNWLight & Wonder Inc. | UBS | Retained | Buy | $210.00 |
MAFMA Financial Group | Morgans | Retained | Buy | $8.47(from $8.66) |
MGHMAAS Group Holdings | Morgans | Retained | Buy | $5.90(from $7.75) |
MGRMirvac Group | Morgan Stanley | Retained | Equal Weight | $2.05 |
| UBS | Retained | Neutral | $1.99 | |
MINMineral Resources | Macquarie | Retained | Outperform | $75.00 |
MMAMaronan Metals | Bell Potter | Retained | Speculative Buy | $0.77(from $0.76) |
NCKNick Scali | Bell Potter | Retained | Buy | $16.00(from $21.00) |
| Morgans | Retained | Accumulate | $13.89(from $18.41) | |
| Ord Minnett | Upgraded | Hold(from Lighten) | $13.00(from $15.00) | |
NEMNewmont Corporation | Macquarie | Retained | Outperform | $190.00 |
NXTNEXTDC | Morgan Stanley | Downgraded | Equal Weight(from Overweight) | $6.70(from $19.00) |
| UBS | Retained | Buy | $18.50(from $23.45) | |
PNRPantoro Gold | Canaccord Genuity | Retained | Speculative Buy | $4.55 |
| Ord Minnett | Retained | Buy | $5.05(from $4.90) | |
| UBS | Retained | Buy | $4.60(from $4.50) | |
REAREA Group | Citi | Retained | Neutral | $165.00 |
SEKSEEK | Citi | Retained | Buy | $19.00 |
SOLWashington H. Soul Pattinson and Co. | Morgans | Retained | Hold | $44.00(from $41.85) |
SPZSmart Parking | Shaw and Partners | Retained | Buy | $1.40 |
STOSantos | Citi | Retained | Buy | $9.80(from $9.60) |
| Morgan Stanley | Retained | Overweight | $9.31 | |
| Ord Minnett | Retained | Hold | $8.40(from $8.20) | |
| UBS | Retained | Buy | $9.50 | |
TAHTabcorp Holdings | UBS | Retained | Buy | $1.07 |
TLCThe Lottery Corporation | UBS | Retained | Buy | $6.00 |
TTTTitomic | Ord Minnett | Retained | Hold | $0.17 |
TWETreasury Wine Estates | UBS | Retained | Buy | $6.50 |
VEAViva Energy Group | Macquarie | Retained | Outperform | $3.75 |
| Ord Minnett | Retained | Buy | $3.40 | |
| UBS | Retained | Neutral | $3.00(from $3.20) | |
WC8Wildcat Resources | Ord Minnett | Retained | Buy | $0.90(from $1.05) |
WZRWisr | Shaw and Partners | Retained | Buy | $0.07 |
ZIPZip Co | UBS | Retained | Buy | $4.40 |
Scans
Top Gainers
Code | Company | Last | % Chg |
|---|---|---|---|
| TPW | Temple & Webster Group Ltd | $5.43 | +33.42% |
| ONE | Oneview Healthcare Plc | $0.14 | +33.33% |
| ARC | ARC Funds Ltd | $0.042 | +23.53% |
| KAL | Kalgoorlie Gold Mining Ltd | $0.018 | +20.00% |
| TAL | Talius Group Ltd | $0.05 | +19.05% |
Top Fallers
Code | Company | Last | % Chg |
|---|---|---|---|
| TSR | Turnstone Resources Ltd | $0.016 | -33.33% |
| ZIP | ZIP Co Ltd | $1.46 | -29.47% |
| PM1 | Palisade Metals Ltd | $0.05 | -24.24% |
| IAM | Income Asset Management Group Ltd | $0.013 | -23.53% |
| RB6 | RUBIX Resources Ltd | $0.097 | -22.40% |
52 Week Highs
Code | Company | Last | % Chg |
|---|---|---|---|
| LCE | London City Equities Ltd | $0.90 | +5.88% |
| CGF | Challenger Ltd | $11.92 | +2.41% |
| OOO | Betashares Crude Oil INDEX Currncy HDG Complex ETF | $10.92 | +1.49% |
| ASX | ASX Ltd | $66.06 | +1.18% |
| DRUG | Betashares Global Healthcare Currency Hedged ETF | $9.49 | +1.17% |
52 Week Lows
Code | Company | Last | % Chg |
|---|---|---|---|
| ZIP | ZIP Co Ltd | $1.46 | -29.47% |
| IAM | Income Asset Management Group Ltd | $0.013 | -23.53% |
| NSM | North Stawell Minerals Ltd | $0.018 | -18.18% |
| BC8 | Black Cat Syndicate Ltd | $0.585 | -15.83% |
| SNM | Sentinel Metals Ltd | $0.24 | -15.79% |
Near Highs
Code | Company | Last | % Chg |
|---|---|---|---|
| BEAR | Betashares Australian Equities Bear Complex ETF | $7.48 | +0.40% |
| RHC | Ramsay Health Care Ltd | $54.79 | -0.20% |
| OZBD | Betashares Australian Composite Bond ETF | $43.17 | +0.54% |
| AN3PI | Australia and New Zealand Banking Group Ltd | $102.72 | -0.16% |
| PCI | Perpetual Credit Income Trust | $1.07 | -0.47% |
Relative Strength Index (RSI) Oversold
Code | Company | Last | % Chg |
|---|---|---|---|
| RAC | Racura Oncology Ltd | $1.56 | 0.00% |
| FFM | Firefly Metals Ltd | $1.35 | +0.75% |
| CSC | Capstone Copper Corp | $11.66 | -3.88% |
| BRN | Brainchip Holdings Ltd | $0.11 | -4.35% |
| TLG | Talga Group Ltd | $0.205 | 0.00% |