

The ASX 200 fell as rising benchmark bond yields and crude oil above US$107/bbl delivered a twin blow to gold stocks, miners, and the banks, while the market sought shelter in healthcare and consumer staples. Materials and financials were down = the index was always going to follow... 😭
Be sure to click/scroll through for the usual reporting of the major sector and stock-specific moves, the broker responses to them, as well as all the key economic data in tonight's Evening Wrap. Also, I have detailed technical analysis on the Nasdaq Composite and the S&P/ASX 200 in today's ChartWatch.
Let’s dive in!
Today in Review
Name | Value | % Chg |
|---|---|---|
Major Indices | ||
| ASX 200 | 8,672.5 | -0.89% |
| All Ords | 8,849.3 | -0.84% |
| Small Ords | 3,336.2 | -0.33% |
| All Tech | 2,760.9 | +0.61% |
| Emerging Companies | 2,977.4 | -0.65% |
Currency | ||
| AUD/USD | 0.7119 | -0.29% |
US Futures | ||
| S&P 500 | 7,700.0 | -0.35% |
| Dow Jones | 52,894.0 | -0.20% |
| Nasdaq | 29,489.75 | -0.66% |
Name | Value | % Chg |
|---|---|---|
Sector | ||
| Health Care | 31,683.5 | +1.50% |
| Consumer Staples | 13,120.8 | +0.88% |
| Consumer Discretionary | 3,508.3 | +0.87% |
| Communication Services | 1,556.5 | +0.32% |
| Information Technology | 1,639.5 | +0.29% |
| Utilities | 10,240.4 | -0.12% |
| Industrials | 7,894.6 | -0.43% |
| Real Estate | 3,231.7 | -0.63% |
| Financials | 9,087.6 | -1.08% |
| Energy | 10,996.4 | -1.63% |
| Materials | 23,629.1 | -2.21% |
ASX 200 Intraday Chart
%20intraday%20chart_15%20Sep.png)
Markets
The S&P/ASX 200 (XJO) finished 77.4 points lower at 8,672.5, 0.9% from its session high and just 0.18% from its low. In the broader-based S&P/ASX 300 (XKO) advancers lagged decliners by 116 to 160.
Health Care (XHJ) (+1.5%) was the session's standout — and the logic is straitforward. When materials and financials are falling simultaneously, cash that must stay invested in equities seeks out the most reliable and resilient earnings streams available. Healthcare revenues don't shrink when bond yields rise, crude oil surges, or the RBA hikes rates.
4DMedical (4DX) (+8.7%), Telix Pharmaceuticals (TLX) (+8.6%), and Healius (HLS) (+7.1%) led with sharp individual gains, while ResMed (RMD) (+2.9%), Sonic Healthcare (SHL) (+1.6%), and CSL (CSL) (+1.6%) also advanced.
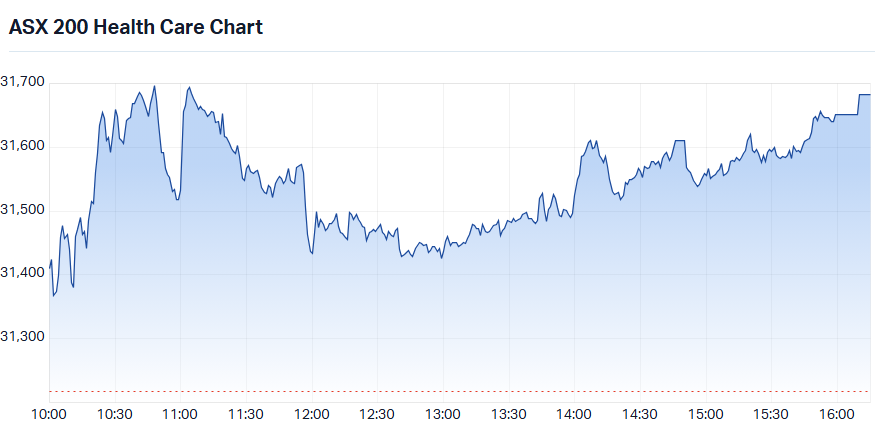
S&P/ASX 200 Health Care intraday chart
Consumer Staples (XSJ) (+0.9%) attracted the same defensive flows — non-discretionary spending names with reliable earnings that are insulated from the rate cycle and the commodity price complex. The A2 Milk Company (A2M) (+2.7%) was the sector's standout, with Elders (ELD) (+1.3%), GrainCorp (GNC) (+1.2%), Coles (COL) (+1.1%), and Woolworths (WOW) (+0.6%) all firmer.
The Gold Sub-Index (XGD) (-3.1%) was the day's worst performer as rising benchmark bond yields once again increased the opportunity cost of holding non-yielding precious metals — and the simultaneous surge in crude oil above US$107/bbl raised diesel cost pressures on mining operations, squeezing producers from both the revenue and cost sides.
COMEX gold futures fell 0.5% to US$4,331/oz in Asian trade. Santana Minerals (SMI) (-8.0%), Kingsgate Consolidated (KCN) (-6.6%), Ora Banda Mining (OBM) (-5.3%), Ramelius Resources (RMS) (-4.8%), and Evolution Mining (EVN) (-3.1%) were all sharply lower.
Materials (XMJ) (-2.2%) bore the same double burden — higher bond yields compress the global growth outlook and therefore commodity demand, while those higher diesel costs bite. LME copper fell 2.2% overnight before recovering just 0.3% to US$6.386/lb in Asian trade. SGX iron ore futures eased 0.2% to US$95.40/t, failing to hold the US$100 threshold achieved earlier in the month.
Base metals were broadly sold: 29Metals (29M) (-2.9%), BHP (BHP) (-2.2%), Aeris Resources (AIS) (-2.1%), and Sandfire Resources (SFR) (-1.5%) led the copper names lower, with South32 (S32) (-1.4%) also falling. Iron ore stocks were similarly weak — Champion Iron (CIA) (-3.4%), Fortescue (FMG) (-1.9%), and Rio Tinto (RIO) (-2.2%) all retreated.
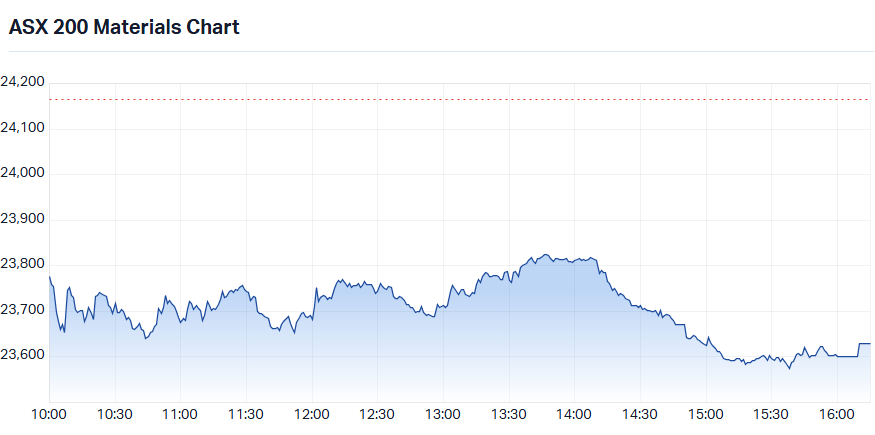
S&P/ASX 200 Materials intraday chart
Energy (XEJ) (-1.6%) was an unusual loser given ICE Brent crude futures gained 1.6% to US$107.35/bbl — oil up yet the sector down. Possibly some profit-taking after a strong run, or just a case of market sentiment so broadly negative that even the sector most likely to benefit from the surging oil price couldn't escape the tide. Woodside Energy (WDS) (-2.2%) and Santos (STO) (-2.1%) both fell. Two exceptions broke through: New Hope Corp. (NHC) (+3.0%) surged on results, and Karoon Energy (KAR) (+1.1%) also advanced.
Financials (XFJ) (-1.1%) faced the straightforward arithmetic of an impending RBA rate hike — higher rates raise credit quality concerns for an already-stressed mortgage book, compress net interest margin expectations, and signal a deteriorating consumer environment. Commonwealth Bank (CBA) (-1.6%), National Australia Bank (NAB) (-1.3%), ANZ (ANZ) (-1.1%), and Westpac (WBC) (-0.5%) all fell.
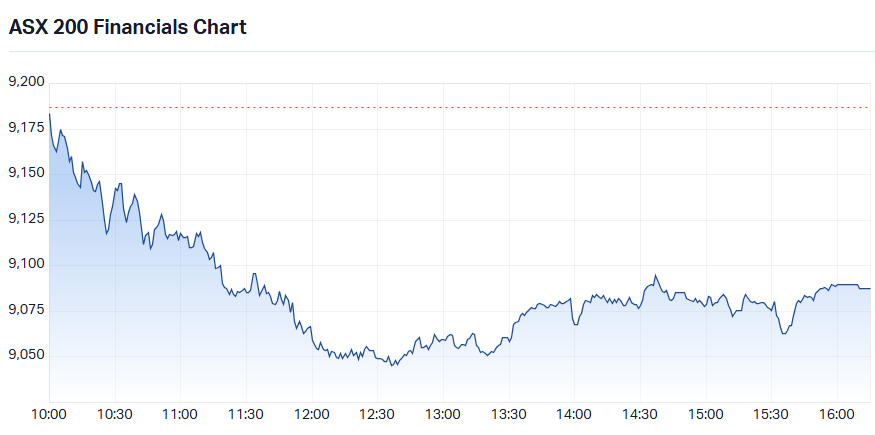
S&P/ASX 200 Financials intraday chart
In other commodities moves, lithium stocks endured their fourth consecutive brutal session in what has been a devastating September — GFEX lithium carbonate futures fell 2.4% to CNY 129,120/t, their lowest close since 2025. Core Lithium (CXO) (-9.0%) led the selling, followed by Mineral Resources (MIN) (-4.3%), Wildcat Resources (WC8) (-4.3%), Galan Lithium (GLN) (-4.1%), Elevra Lithium (ELV) (-4.0%), Pilbara Minerals (PLS) (-3.4%), Liontown Resources (LTR) (-2.8%), and IGO (IGO) (-2.3%).
Today's best ASX Top 300 gainers
Company | Last Price | Change $ | Change % | 1mo % | 1yr % |
|---|---|---|---|---|---|
| EQ Resources (EQR) | $0.43 | +$0.045 | +11.7% | +38.7% | +1287.1% |
| 4DMedical (4DX) | $3.74 | +$0.30 | +8.7% | +2.7% | +110.1% |
| Telix Pharmaceuticals (TLX) | $17.75 | +$1.41 | +8.6% | +6.1% | +26.8% |
| Metals X (MLX) | $1.965 | +$0.125 | +6.8% | +8.6% | +204.7% |
| Aura Consolidated Group, Inc. (AXQ) | $3.70 | +$0.20 | +5.7% | +14.2% | -46.0% |
| Life360 Inc (360) | $20.52 | +$0.98 | +5.0% | -12.8% | -59.1% |
| The Star Entertainment Group (SGR) | $0.135 | +$0.005 | +3.8% | -3.6% | +28.6% |
| Perpetual (PPT) | $18.70 | +$0.64 | +3.5% | -3.2% | -3.1% |
| Lindian Resources (LIN) | $0.605 | +$0.02 | +3.4% | -28.0% | +168.9% |
| News Corporation (NWS) | $47.21 | +$1.46 | +3.2% | +1.5% | -3.0% |
| AUB Group (AUB) | $28.91 | +$0.89 | +3.2% | 0.0% | -14.4% |
| Ricegrowers (SGLLV) | $13.11 | +$0.40 | +3.1% | -6.7% | -13.5% |
| New Hope Corporation (NHC) | $6.47 | +$0.19 | +3.0% | +20.9% | +48.4% |
| Bravura Solutions (BVS) | $3.13 | +$0.09 | +3.0% | -12.8% | +39.7% |
| ResMed Inc. (RMD) | $31.37 | +$0.87 | +2.9% | -2.1% | -22.9% |
| JB Hi-Fi (JBH) | $67.19 | +$1.86 | +2.8% | -17.8% | -40.9% |
| IPH (IPH) | $3.34 | +$0.09 | +2.8% | -19.3% | -16.3% |
| Catapult Sports (CAT) | $2.98 | +$0.08 | +2.8% | -20.1% | -56.1% |
| Megaport (MP1) | $16.79 | +$0.44 | +2.7% | -21.8% | +18.6% |
| The a2 Milk Company (A2M) | $6.92 | +$0.18 | +2.7% | +2.5% | -24.0% |
Today's worst ASX Top 300 losers
Company | Last Price | Change $ | Change % | 1mo % | 1yr % |
|---|---|---|---|---|---|
| Core Lithium (CXO) | $0.355 | -$0.035 | -9.0% | 0.0% | +255.0% |
| Kingsgate Consolidated (KCN) | $5.12 | -$0.36 | -6.6% | +7.1% | +75.3% |
| Summerset Group Holdings (SNZ) | $6.20 | -$0.40 | -6.1% | -6.9% | -37.4% |
| Tasmea (TEA) | $8.70 | -$0.52 | -5.6% | -8.2% | +83.5% |
| Ora Banda Mining (OBM) | $1.44 | -$0.08 | -5.3% | +9.9% | +38.5% |
| Silex Systems (SLX) | $4.32 | -$0.23 | -5.1% | -16.3% | +7.7% |
| Austal (ASB) | $4.17 | -$0.21 | -4.8% | -4.4% | -48.0% |
| Ramelius Resources (RMS) | $3.60 | -$0.18 | -4.8% | +0.6% | -0.3% |
| Catalyst Metals (CYL) | $6.45 | -$0.32 | -4.7% | +4.4% | -17.3% |
| LendLease Group (LLC) | $2.64 | -$0.13 | -4.7% | -18.3% | -51.6% |
| Metrics Master Income Trust (MXT) | $1.78 | -$0.085 | -4.6% | -7.5% | -10.3% |
| Westgold Resources (WGX) | $5.38 | -$0.25 | -4.4% | -4.8% | +38.7% |
| West African Resources (WAF) | $3.68 | -$0.17 | -4.4% | +8.6% | +21.1% |
| Mineral Resources (MIN) | $54.32 | -$2.44 | -4.3% | -17.7% | +40.5% |
| NEXTDC (NXT) | $11.24 | -$0.47 | -4.0% | -24.5% | -33.8% |
| Elevra Lithium (ELV) | $6.72 | -$0.28 | -4.0% | -27.0% | +99.4% |
| Brazilian Rare Earths (BRE) | $3.38 | -$0.14 | -4.0% | -28.5% | +11.6% |
| Genesis Minerals (GMD) | $7.38 | -$0.27 | -3.5% | +2.8% | +33.0% |
| Bellevue Gold (BGL) | $1.515 | -$0.055 | -3.5% | +1.7% | +59.5% |
| Ryman Healthcare (RYM) | $1.54 | -$0.055 | -3.4% | -9.9% | -32.5% |
Chartwatch
Nasdaq Composite Index
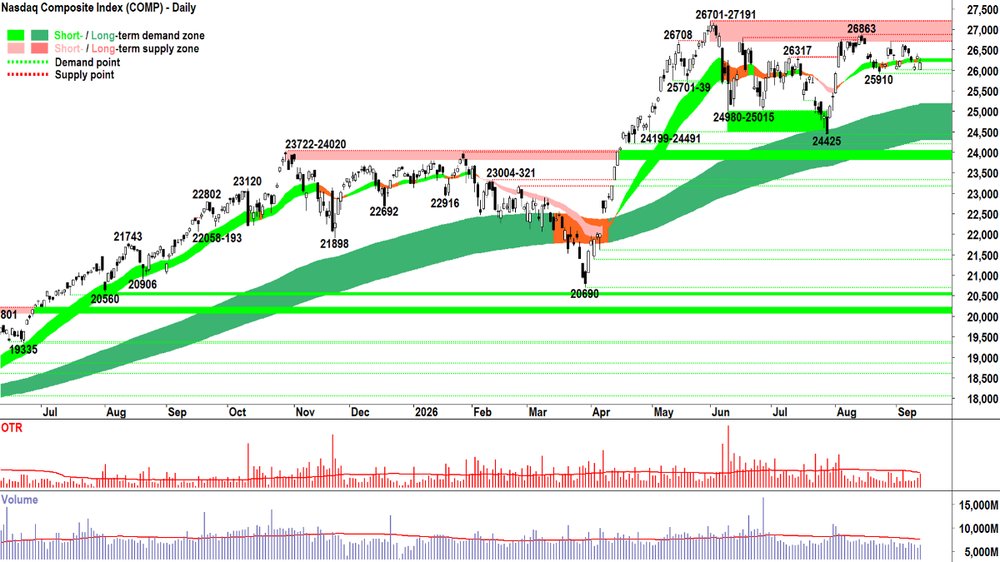
Nasdaq Composite Index chart
Analysis
Make no mistake… The chart above is an aberration.
Other major global stock markets did not close with such a strong white-bodied candle on Monday.
Consider the RUT chart below, perhaps a better representation of the US share market / US economy? 🤔
%20chart_14%20Sep.png)
RUT chart with our last markings from CharWatch LIVE Webinars
But few global markets are slated to grow their earnings by the same amount that the Comp is forecast to do (+20% give or take next couple years)... So, if the bond yield on this 10-year government bond, or that one, goes from four-point-9-whaterver to 5-point-oh -whatever… in theory, it shouldn’t matter too much.
Arguably, the equity risk premium has only changed at the very margin.
Not so much for us – where our forecast earnings growth is mid-single digits when the commodities boom is taken out (i.e., copper, gold, coal, and oil and gas).
Arguably, we can expect a larger impact at the margin. 😭
And I suggest that’s why our candle today wasn’t so white-bodied, but more about that in the OTP analysis below! 👇
As for the Comp’s chart, it looks solid. More precisely, I should say it still looks solid. Because despite all of the negative plausible narratives doing the rounds, it just keeps dodging those bullets.
But you gotta wonder how many dodges it has left. Particularly if other large global share markets, or economies, start peeling off. Heck, even if the RUT starts peeling off…
Anyways, it is what it is – and what it is – is substantially robust. Therefore, it deserves my respect and my RP!
25910 seems to be holding. The long term uptrend remains intact.
Sure, price action is chop-chop-chop sideways. And candles are mixed (I’d almost err on the side of ‘decent’, though).
So, 50-50 invested vs cash seems like a very reasonable place to be. Flexible enough to add risk if the long term trend re-exerts itself, but also with plenty of cash in the bank if it doesn’t.
Consider too, that cash yields are pretty darn good at the moment. Certainly, it pays to be cautious right now!
View
1/2RP. (RP = Risk Position — it reflects my personal allowable capital allocation limit for my investments in US stocks. So 1/2RP is 50%, 2/3RP is 67% and FRP is 100%).
Key Levels
26701-863 is the closest key point of supply vs 25910-95 as the closest key point of demand, and then the long term trend ribbon (presently 24293-25176).
S&P/ASX 200 (XJO)
%20chart_15%20Sep.png)
S&P/ASX 200 (XJO) chart
Analysis
I posted this on X today:
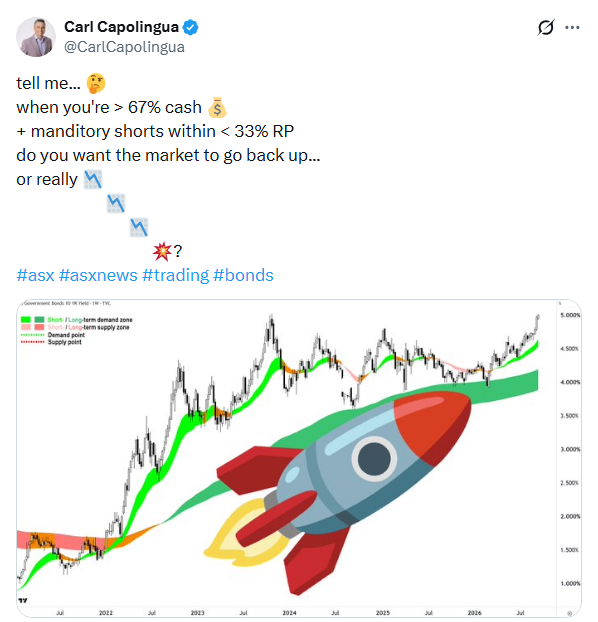
The chart inset of the US 10-year Treasury Bond yield. And yes, that's one hell of a rocket ship emoji! 🚀
It's a nice conundrum to have.
But at the same time, I'd still rather we were making new highs. You see, I've learned to be suspicious of bear markets.
Relax.
I'm not saying we're in a bear market.
We're not.
You know my model. You know when it will say we're in a bear market.
We're not even close.
Simply, that the natural state of the stock market is to go up (most stock markets, even the OTP! 😉). 📈
Also, in my substantial experience in trading bear markets... sigh... yes I am ancient... about the last... um, I wanna say half-dozen of them... well, back to the mid-90's anyway... I can say with total confidence:
They're a bloody lot more difficult to make money and manage your risk in than bull markets.
They're far more volatile (chop-chop-chop in choppy markets trend followers get chopped up! 🪓🪓🪓), and as previously noted: they're not the market's natural state.
It's a fact that they're short, sharp, and very painful.
If you don't know what you're doing, that is...
You've also got pesky politicians and central bankers incentivised to solve the problems that they created – which caused the bear market in the first place – wreaking havoc with your short positions! 🤦
Anyways, it's a nice conundrum to have. Because I could be like most other unwitting investors who prefer the Ostrich Technique. 😁
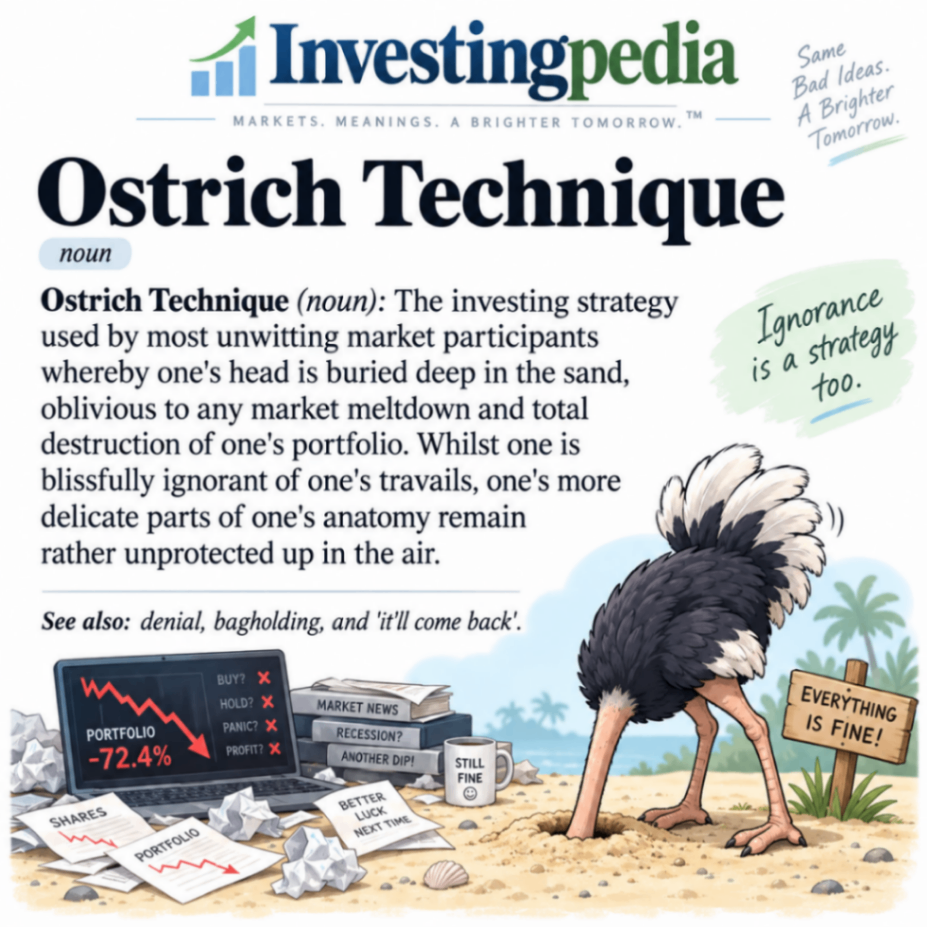
There are pro's and con's of any investing technique... 🤣
View
1/3RP on Australian shares (i.e., 33% of my capital allocated to ASX shares invested vs 67% cash).
Key Levels
8935-40 is likely to now act as a zone of supply, but the short term trend ribbon (presently 8987-8993) is most likely the biggest barrier the OTP will have to contend with on the way back up. 8708-8656 is the next key zone of demand.
(Glossary of acronyms! Old Tin Pot (OTP): S&P/ASX 200 | MOTN: More Often Than Not | FOMO: Fear Of Missing Out | HOFU: Holding On For Upside | BTD: Buy The Dip | NUTE: No Urgency To Enter | FOHO: Fear Of Holding On | STR: Sell The Rally | RP: Risk Position | FFS: Fund Flow Shenanigans!)
***CHARTWATCH LIVE WEBINARS 📺🍿***
Are ASX shares headed for a crash? This expert says it's time to protect your capital (and he shows you how to do it)
ChartWatch LIVE Webinars – WEEKLY Wednesday's @ 12pm AEDT
Learn more about technical analysis and trend following through real case studies on ASX stocks. Australia's premier technical analyst, Carl Capolingua, shares his unique insights on stocks as requested by viewers. Ask about a company in your portfolio or anything related to trading and investing and get Carl's expert opinion.
Places are limited so >REGISTER NOW!<
Economy
TODAY
11:30 CHN August Data Dump
New Home Prices: -0.17% vs -0.18% m/m in July (slightly better than previous, still bad)
Fixed Asset Investment: -7.2% ytd/p.a. forecast vs -7.0% ytd/p.a. forecast and -6.7% ytd/p.a. in July (worse than expected and previous, bad)
Industrial Production: +5.2% p.a. forecast vs +4.8% p.a. forecast and +4.5% p.a. in July (better than expected, good)
Retail Sales: +0.4% p.a. forecast vs +0.8% p.a. forecast and +0.6% p.a. in July (worse than expected, still up, but slowing)
Unemployment Rate: 5.3% forecast vs 5.2% forecast and 5.2% in July (worse than expected)
LATER THIS WEEK
WEDNESDAY
22:30 USA August Core Retail Sales (+0.5% m/m forecast vs -0.3% m/m previous)
THURSDAY
04:00 USA FOMC Meeting
Federal Funds Rate: +0.25% p.a. forecast to 3.75% to 4.0% p.a.
FOMC Statement & Economic Projections
Kevin Warsh press conference at 04:30
22:30 USA August Philadelphia Fed Manufacturing Index (28.9 forecast vs 47.4 in August)
FRIDAY
09:30 Bank of Japan (BOJ) Policy Rate (+0.25% p.a. forecast to 1.25% to 1.0% p.a.)
Interesting Movers
Trading higher
- EQ Resources (EQR) $0.43+11.7%
Announced that it has entered into a binding agreement with The Elmet Group (NASDAQ: ELMT) and Blue Moon Metals Inc. (NASDAQ: BMM) for the restart and operation of the ammonium paratungstate processing plant at the Springer Tungsten Project in Nevada. The agreement provides for the establishment of a new joint venture to own, restart and operate the existing Springer Plant, with EQR to hold an initial 10% interest.
- 4DMedical (4DX) $3.74+8.7%
No news. Performance reflected general strength in the broader Healthcare sector.
- Telix Pharmaceuticals (TLX) $17.75+8.6%
No news. Performance reflected general strength in the broader Healthcare sector.
- Life360 Inc (360) $20.52+5.0%
No news. Substantially better than the rest of the IT sector and against the run of its prevailing short and long term trends. Nasdaq in the USA closed well off its lows on Monday, with 360's US listing gaining 3.8%. 🤔
- New Hope Corporation (NHC) $6.47+3.0%
Reported FY26 results. NPAT ↓ 63.4% to $161 million amid weaker realised coal prices, higher costs and a step-up in depreciation, but 30 cent fully franked final dividend declared – more than double what some brokers were forecasting.
Trading Lower
- Core Lithium (CXO) $0.36-9.0%
No news. Performance reflected general weakness in the broader lithium sector. Benchmark lithium carbonate price fell another 2.4% in China today, taking falls since May's peak to just shy of 40%. 📉💥
- Santana Minerals (SMI) $0.52-8.0%
No news. Performance reflected general weakness in the broader gold sector. Benchmark bond yields continue to rise, hurting the gold price, and rising crude price feeds into higher costs at miners... double whammy! 👊👊
- Kingsgate Consolidated (KCN) $5.12-6.6%
No news. Performance reflected general weakness in the broader gold sector.
- Ora Banda Mining (OBM) $1.44-5.3%
No news. Performance reflected general weakness in the broader gold sector.
- Silex Systems (SLX) $4.32-5.0%
No news. Performance reflected general weakness in the broader uranium sector.
- Ramelius Resources (RMS) $3.60-4.8%
No news. Performance reflected general weakness in the broader gold sector.
- NEXTDC (NXT) $11.24-4.0%
Two substantial shareholder notices released today, both showing increased ownership in the company – but both notices disclosing securities-lending activity – potentially including the facilitation of short selling. NXT is a regular in the ChartWatch ASX Scans Downtrends List. 📉
- Evolution Mining (EVN) $13.13-3.1%
No news. Performance reflected general weakness in the broader gold sector. Also released a corporate presentation today detailing progress at current projects and future growth opportunities.
Broker Moves
Company | Broker | Action | Rating | Price Target |
|---|---|---|---|---|
AELAmplitude Energy | Macquarie | Retained | Outperform | $2.50 |
ALDAmpol | Morgan Stanley | Retained | Overweight | $44.00 |
ANZANZ Group Holdings | Macquarie | Retained | Neutral | $33.50 |
ARBARB Corporation | Citi | Retained | Neutral | $22.50 |
AZJAurizon Holdings | Morgans | Retained | Hold | $3.50(from $3.56) |
BENBendigo and Adelaide Bank | Macquarie | Retained | Underperform | $9.00 |
BOQBank of Queensland | Macquarie | Retained | Underperform | $5.50 |
BPTBeach Energy | Macquarie | Retained | Underperform | $0.80 |
CBACommonwealth Bank of Australia | Macquarie | Retained | Underperform | $112.00 |
CTDCorporate Travel Management | Citi | Retained | Neutral | $2.70(from $16.10) |
EQREQ Resources | Canaccord Genuity | Retained | Buy | $0.50 |
FPRFleetPartners Group | Morgan Stanley | Retained | Overweight | $4.00 |
GPTGPT Group | Citi | Retained | Buy | $6.00 |
| UBS | Retained | Buy | $5.60 | |
IMMImmutep | Bell Potter | Retained | Hold | $0.06(from $0.07) |
JDOJudo Capital Holdings | Macquarie | Retained | Outperform | $1.65 |
KARKaroon Energy | Macquarie | Retained | Neutral | $1.85 |
KCNKingsgate Consolidated | Ord Minnett | Initiated | Buy | $8.00 |
L1GL1 Group | Ord Minnett | Initiated | Accumulate | $1.25 |
MI6Minerals 260 | UBS | Retained | Buy | $1.25(from $0.90) |
MP1Megaport | Ord Minnett | Upgraded | Buy(from Accumulate) | $22.00 |
MPLMedibank Private | Macquarie | Retained | Outperform | $5.20 |
MQGMacquarie Group | Citi | Retained | Neutral | $240.00 |
NABNational Australia Bank | Macquarie | Retained | Neutral | $39.00 |
NHCNew Hope Corporation | Macquarie | Retained | Outperform | $6.40 |
NHFNIB Holdings | Macquarie | Retained | Neutral | $6.60 |
ORGOrigin Energy | Macquarie | Retained | Neutral | $11.10(from $10.80) |
PYCPYC Therapeutics | Bell Potter | Retained | Speculative Buy | $3.00(from $2.30) |
RFFRural Funds Group | UBS | Retained | Buy | $2.30 |
S32South32 | Macquarie | Retained | Neutral | $5.00 |
| Morgan Stanley | Retained | Overweight | $5.10 | |
SLSSolstice Minerals | Canaccord Genuity | Retained | Speculative Buy | $4.05(from $2.55) |
SLXSilex Systems | Canaccord Genuity | Retained | Speculative Buy | $10.48 |
STXStrike Energy | Macquarie | Upgraded | Outperform(from Neutral) | $0.15(from $0.10) |
TLXTelix Pharmaceuticals | Ord Minnett | Retained | Buy | $20.55(from $20.40) |
TUATuas | Morgan Stanley | Retained | Overweight | $5.00 |
VEAViva Energy Group | Morgan Stanley | Retained | Equal Weight | $2.88 |
VMMViridis Mining and Minerals | Ord Minnett | Retained | Speculative Buy | $6.50 |
VYSVysarn | Morgans | Retained | Buy | $1.20(from $1.40) |
WAFWest African Resources | Macquarie | Downgraded | Neutral(from Outperform) | $4.00 |
WBCWestpac Banking Corporation | Macquarie | Retained | Underperform | $30.00 |
ZIPZip Co | Citi | Retained | Buy | $3.20 |
Scans
Top Gainers
Code | Company | Last | % Chg |
|---|---|---|---|
| LMG | Latrobe Magnesium Ltd | $0.014 | +40.00% |
| NH3 | NH3 Clean Energy Ltd | $0.125 | +31.58% |
| SLB | Stelar Metals Ltd | $0.32 | +25.49% |
| CHRCB | Charger Metals NL | $0.02 | +25.00% |
| CYB | Aucyber Ltd | $0.051 | +21.43% |
Top Fallers
Code | Company | Last | % Chg |
|---|---|---|---|
| IBR | Iron Bear Resources Ltd | $0.024 | -46.67% |
| BRY | Barys Resources Ltd | $0.013 | -31.58% |
| MHC | Manhattan Gold Corporation Ltd | $0.02 | -21.57% |
| RPM | RPM Automotive Group Ltd | $0.012 | -20.00% |
| DWG | Dataworks Group Ltd | $0.125 | -16.67% |
52 Week Highs
Code | Company | Last | % Chg |
|---|---|---|---|
| SLB | Stelar Metals Ltd | $0.32 | +25.49% |
| EQR | EQ Resources Ltd | $0.43 | +11.69% |
| MYE | Mastermyne Group Ltd | $0.72 | +9.09% |
| VR8 | Vanadium Resources Ltd | $0.065 | +8.33% |
| BOA | BOA Resources Ltd | $0.076 | +7.04% |
52 Week Lows
Code | Company | Last | % Chg |
|---|---|---|---|
| IBR | Iron Bear Resources Ltd | $0.024 | -46.67% |
| BRY | Barys Resources Ltd | $0.013 | -31.58% |
| RPM | RPM Automotive Group Ltd | $0.012 | -20.00% |
| MX1 | Micro-X Ltd | $0.015 | -16.67% |
| VRS | Veris Ltd | $0.04 | -13.04% |
Near Highs
Code | Company | Last | % Chg |
|---|---|---|---|
| SLB | Stelar Metals Ltd | $0.32 | +25.49% |
| BEAR | Betashares Australian Equities Bear Complex ETF | $7.52 | +0.67% |
| RHC | Ramsay Health Care Ltd | $53.57 | +1.23% |
| AN3PI | Australia and New Zealand Banking Group Ltd | $102.00 | +0.20% |
| PCI | Perpetual Credit Income Trust | $1.10 | -0.45% |
Relative Strength Index (RSI) Oversold
Code | Company | Last | % Chg |
|---|---|---|---|
| WLE | Wam Leaders Ltd | $1.28 | +0.39% |
| WES | Wesfarmers Ltd | $72.83 | +0.36% |
| NWL | Netwealth Group Ltd | $18.77 | -0.37% |
| KSL | Kina Securities Ltd | $1.075 | -0.46% |
| FLT | Flight Centre Travel Group Ltd | $10.87 | +0.65% |
