News | Market Wraps
Evening Wrap: ASX 200 slips as CBA plunge stokes rotation into iron ore miners BHP, RIO, and FMG
The S&P/ASX 200 closed 53.7 points lower, down 0.61%.

Mentioned
The S&P/ASX 200 closed 53.7 points lower, down 0.61%.
On a day where the banks faltered (led by Commonwealth Bank of Australia’s (CBA) 5.4% post-earnings plunge) and major resources companies like BHP Group (BHP) (+1.1%), Rio Tinto (RIO) (1.0%), and Fortescue (FMG) (+1.4%) strengthened – on a down day on the ASX 200 – you have to start thinking about sector rotation.
The big banks and financial companies had the wood over those in the resources sector for all of 2024 and most of 2025 – but over the last 6 weeks the tide has steadily been turning…🌊
To make sense of all the above, I have detailed technical analysis on the Nasdaq Composite, S&P/ASX 200, and Iron Ore in today's ChartWatch.
Be sure to click/scroll through for the usual reporting of the major sector and stock-specific moves, the broker responses to them, as well as all the key economic data in tonight's Evening Wrap.
Let's dive in!
Today in Review
Wed 13 Aug 25, 5:03pm (AEST)
Name | Value | % Chg |
|---|---|---|
Major Indices | ||
| ASX 200 | 8,827.1 | -0.61% |
| All Ords | 9,103.1 | -0.52% |
| Small Ords | 3,468.7 | +0.36% |
| All Tech | 4,204.2 | -0.21% |
| Emerging Companies | 2,507.7 | +0.63% |
Currency | ||
| AUD/USD | 0.6542 | +0.19% |
US Futures | ||
| S&P 500 | 6,469.0 | +0.01% |
| Dow Jones | 44,548.0 | -0.02% |
| Nasdaq | 23,962.25 | +0.10% |
Name | Value | % Chg |
|---|---|---|
Sector | ||
| Materials | 17,840.5 | +0.97% |
| Health Care | 44,838.0 | +0.95% |
| Consumer Staples | 12,398.2 | +0.89% |
| Communication Services | 1,920.6 | +0.68% |
| Industrials | 8,461.8 | +0.67% |
| Real Estate | 4,099.7 | +0.07% |
| Consumer Discretionary | 4,358.2 | -0.27% |
| Information Technology | 2,963.9 | -0.46% |
| Energy | 9,296.8 | -0.96% |
| Financials | 9,227.0 | -2.60% |
| Utilities | 9,651.3 | -2.77% |
Markets
%20intraday%20chart_13%20Aug.png)
ASX 200 Session Chart
The S&P/ASX 200 (XJO) finished 53.7 points lower at 8,827.1, 0.72% from its session high and just 0.13% from its low. But it wasn’t all doom and gloom! Despite the tough time implied by the benchmark, in the broader-based S&P/ASX 300 (XKO) advancers beat decliners by 150 to 114.
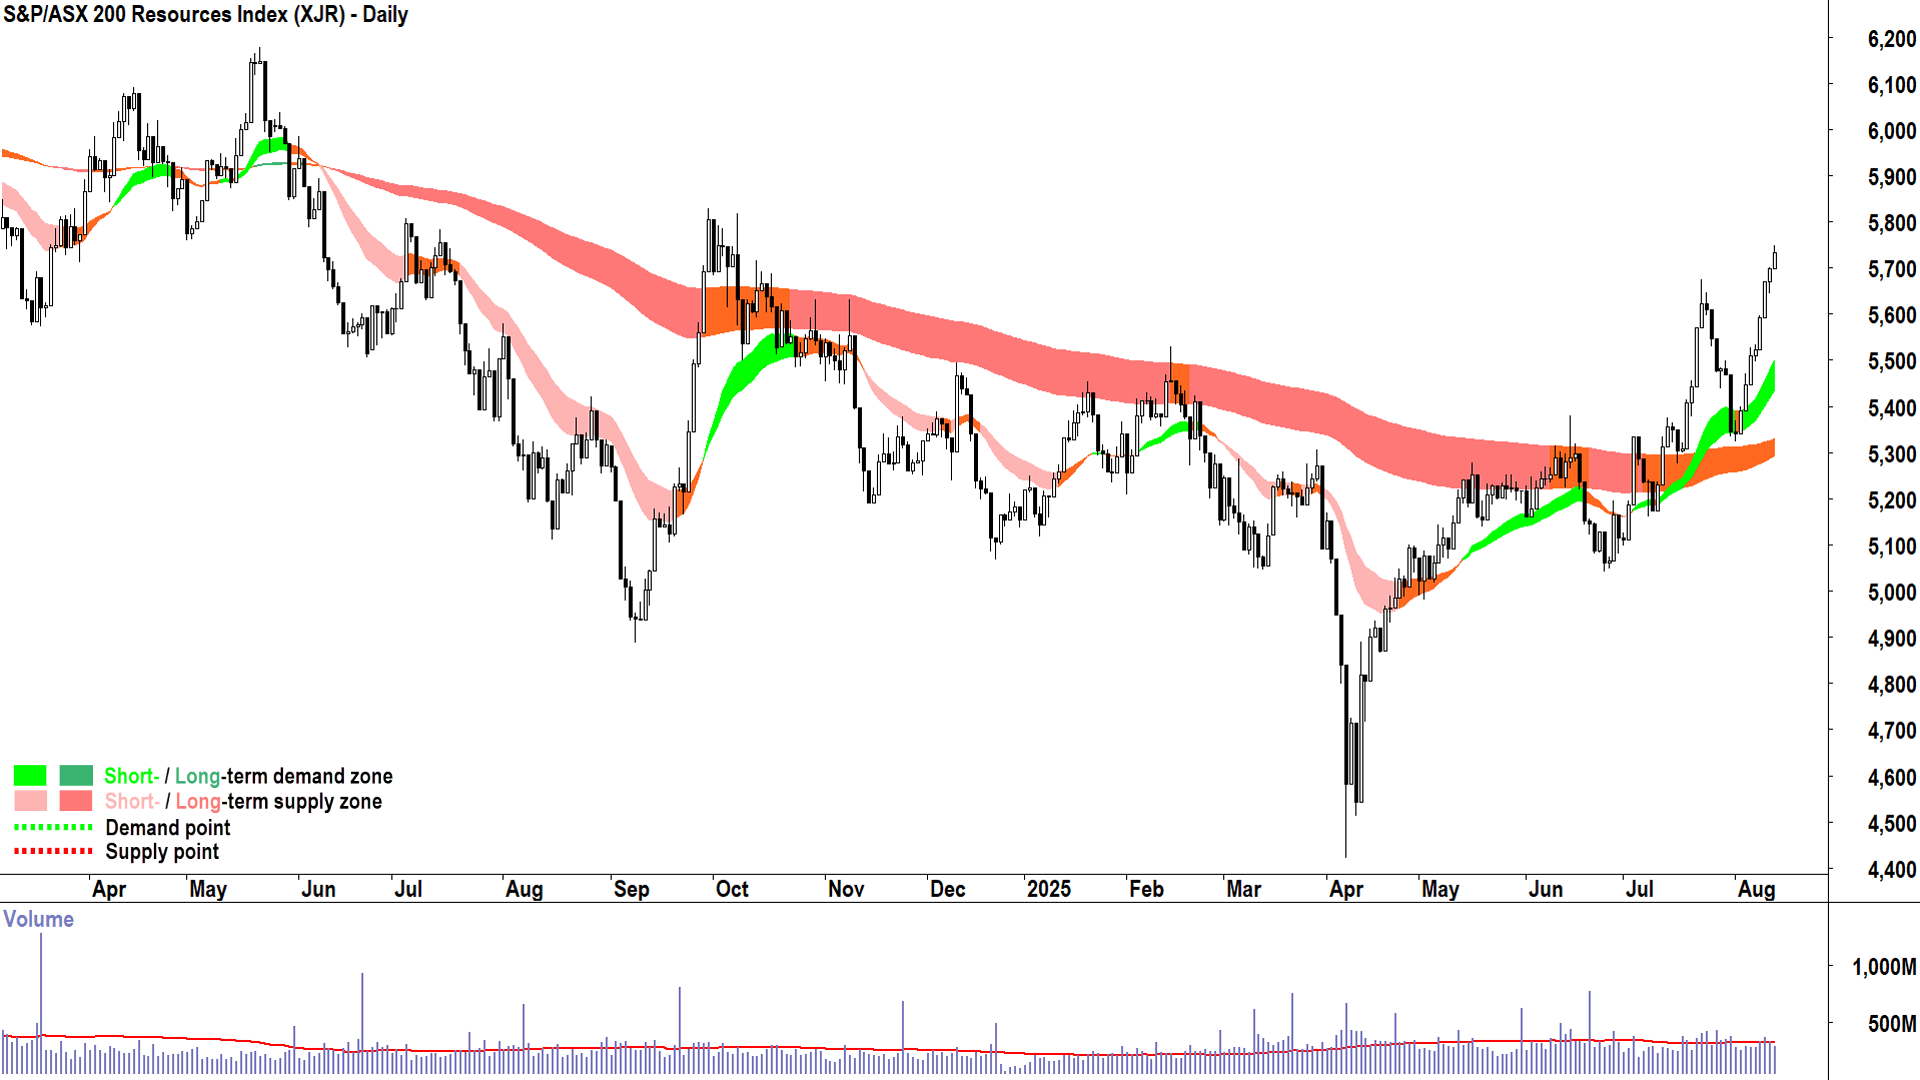
Just as the big banks were starting to look good again – potentially aligning with a resurgent Resources (XJR) (+0.6%) sector and dispelling the sector rotation curse of the Aussie stock market – Commonwealth Bank of Australia’s (CBA) (-5.4%) post-earnings plunge has reaffirmed what we already knew: A major sector rotation is indeed afoot!
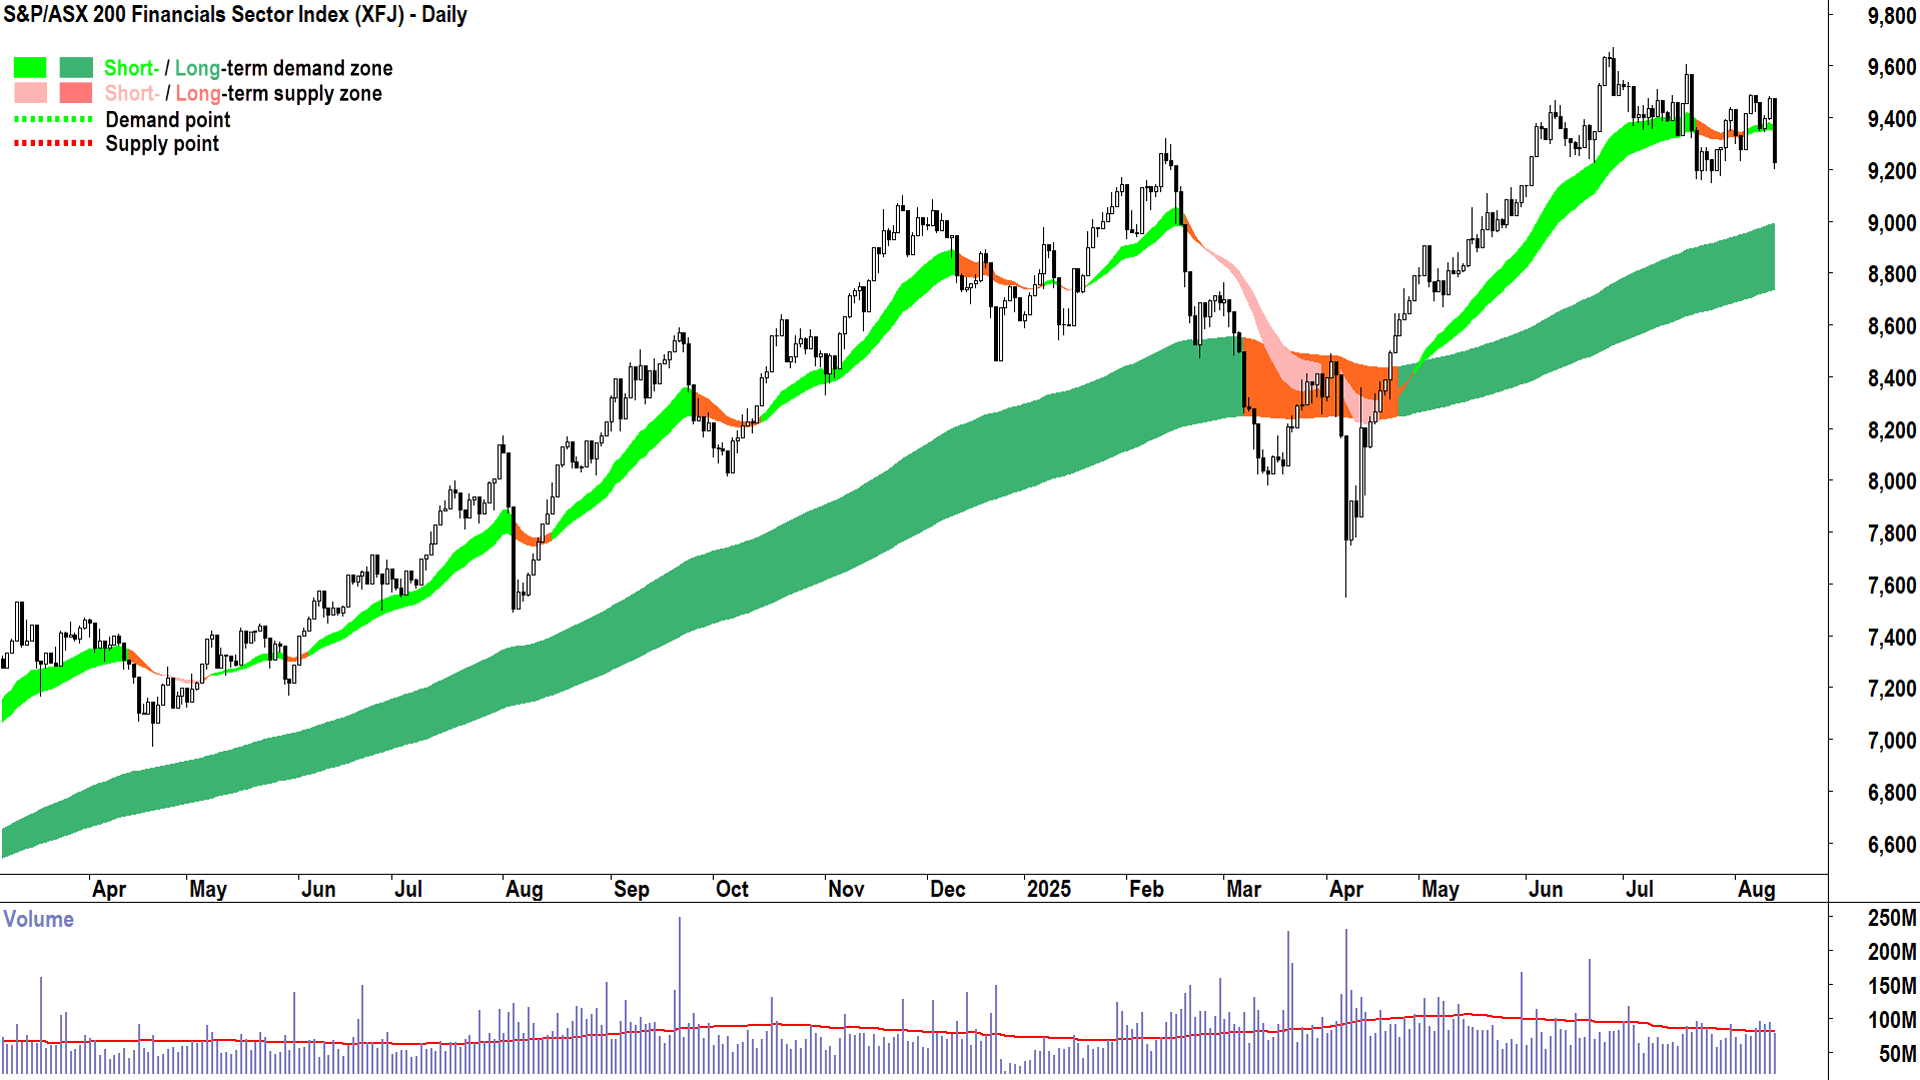
The big banks and financial companies, aka Financials (XFJ) (-2.6%), had the wood over those in the resources sector for all of 2024 and most of 2025 – but over the last 6-8 weeks the tide has been steadily turning…
%20chart_13%20Aug.png)
ASX 200 Financial Sector Index (XFJ) chart 13 Aug (click here for full size image)
%20chart_13%20Aug.png)
ASX 200 Resources Sector Index (XJR) chart 13 Aug (click here for full size image)
As I said above, apart from today's candle, the trends of most of the big banks (CBA to a lesser extent) were on the mend after their mid-year correction. The question is whether today is merely an aberration and they can revert to those improving short and long term uptrends, or whether it solidifies the prevailing sector rotation into Resources (BHP Group (BHP) (+1.1%), Rio Tinto (RIO) (1.0%), and Fortescue (FMG) (+1.4%)).
We have two updates looming from Westpac Banking Corp. (WBC) (-2.1%) tomorrow, and National Australia Bank (NAB) (-2.6%) on Monday next week, from which the market response will guide us. In the meantime, it probably doesn't matter all that much for Resources (and Energy (XEJ) ( -1.0%)), which appear to be increasingly running their own races.
Today's loss on the ASX 200 perhaps looks bad on the surface, and it's not ideal that Financials with their zillion index points are stuttering, but I note decent market breadth and gains in 8 of the 11 major sectors (Utilities (XUJ) (-2.8%) was the only other sector to fall and most of that was due to AGL (AGL) (-13%)). Otherwise, it was largely just another day in the ongoing bull market 🐂.
Today's best blue chip gainers
Company | Last Price | Change $ | Change % | 1mo % | 1yr % |
|---|---|---|---|---|---|
Qantas Airways (QAN) | $11.62 | +$0.62 | +5.6% | +6.6% | +98.0% |
Life360 (360) | $43.00 | +$2.23 | +5.5% | +22.1% | +144.9% |
Evolution Mining (EVN) | $7.99 | +$0.3 | +3.9% | +3.8% | +111.9% |
Lynas Rare Earths (LYC) | $13.63 | +$0.42 | +3.2% | +36.2% | +124.9% |
Light & Wonder (LNW) | $134.30 | +$3.87 | +3.0% | -9.9% | -13.4% |
Seek (SEK) | $25.07 | +$0.67 | +2.7% | +3.4% | +14.9% |
Telix Pharmaceuticals (TLX) | $17.13 | +$0.45 | +2.7% | -28.1% | -3.8% |
Car Group (CAR) | $40.04 | +$0.97 | +2.5% | +7.2% | +19.0% |
CSL (CSL) | $269.55 | +$5.24 | +2.0% | +7.5% | -12.6% |
A2 Milk (A2M) | $7.77 | +$0.15 | +2.0% | +7.6% | +14.8% |
Aurizon (AZJ) | $3.29 | +$0.06 | +1.9% | +3.8% | -9.1% |
James Hardie (JHX) | $43.93 | +$0.73 | +1.7% | +7.0% | -12.1% |
Reliance Worldwide (RWC) | $4.46 | +$0.07 | +1.6% | +5.7% | -2.8% |
AMP (AMP) | $1.735 | +$0.025 | +1.5% | +13.4% | +34.5% |
Perseus Mining (PRU) | $3.58 | +$0.05 | +1.4% | -1.9% | +48.5% |
Fortescue (FMG) | $19.93 | +$0.27 | +1.4% | +18.8% | +7.8% |
Ansell (ANN) | $31.53 | +$0.42 | +1.4% | +5.0% | +20.1% |
Reece (REH) | $14.55 | +$0.19 | +1.3% | +9.6% | -43.6% |
Transurban Group (TCL) | $13.98 | +$0.18 | +1.3% | +4.4% | +7.8% |
Endeavour Group (EDV) | $4.19 | +$0.05 | +1.2% | +1.0% | -22.3% |
Today's worst blue chip losers
Company | Last Price | Change $ | Change % | 1mo % | 1yr % |
|---|---|---|---|---|---|
AGL Energy (AGL) | $8.88 | -$1.34 | -13.1% | -7.0% | -17.9% |
Pilbara Minerals (PLS) | $2.14 | -$0.15 | -6.6% | +35.9% | -30.3% |
Commonwealth Bank of Australia (CBA) | $169.12 | -$9.68 | -5.4% | -5.9% | +30.5% |
Mineral Resources (MIN) | $35.76 | -$1.74 | -4.6% | +29.5% | -30.8% |
Computershare (CPU) | $39.75 | -$1.56 | -3.8% | -0.6% | +50.2% |
National Australia Bank (NAB) | $38.16 | -$1.03 | -2.6% | -3.7% | +7.1% |
ASX (ASX) | $63.68 | -$1.56 | -2.4% | -10.1% | -1.5% |
Xero (XRO) | $168.78 | -$3.92 | -2.3% | -3.3% | +31.4% |
Westpac Banking Corporation (WBC) | $33.90 | -$0.73 | -2.1% | +0.3% | +20.9% |
Pro Medicus (PME) | $297.15 | -$6.05 | -2.0% | -8.5% | +132.0% |
Bendigo and Adelaide Bank (BEN) | $12.44 | -$0.21 | -1.7% | -3.2% | +3.5% |
Bank of Queensland (BOQ) | $7.73 | -$0.12 | -1.5% | -2.0% | +26.1% |
Origin Energy (ORG) | $11.84 | -$0.18 | -1.5% | 0% | +12.9% |
QBE Insurance Group (QBE) | $21.12 | -$0.32 | -1.5% | -8.0% | +31.6% |
IGO (IGO) | $5.34 | -$0.08 | -1.5% | +11.5% | +3.5% |
Lendlease Group (LLC) | $5.42 | -$0.08 | -1.5% | +4.6% | -10.7% |
Wisetech Global (WTC) | $114.28 | -$1.45 | -1.3% | +1.4% | +33.8% |
Technology One (TNE) | $38.31 | -$0.44 | -1.1% | -5.1% | +80.6% |
Resmed Inc (RMD) | $43.55 | -$0.43 | -1.0% | +12.4% | +33.3% |
Woodside Energy Group (WDS) | $26.78 | -$0.24 | -0.9% | +10.7% | +5.1% |
ChartWatch
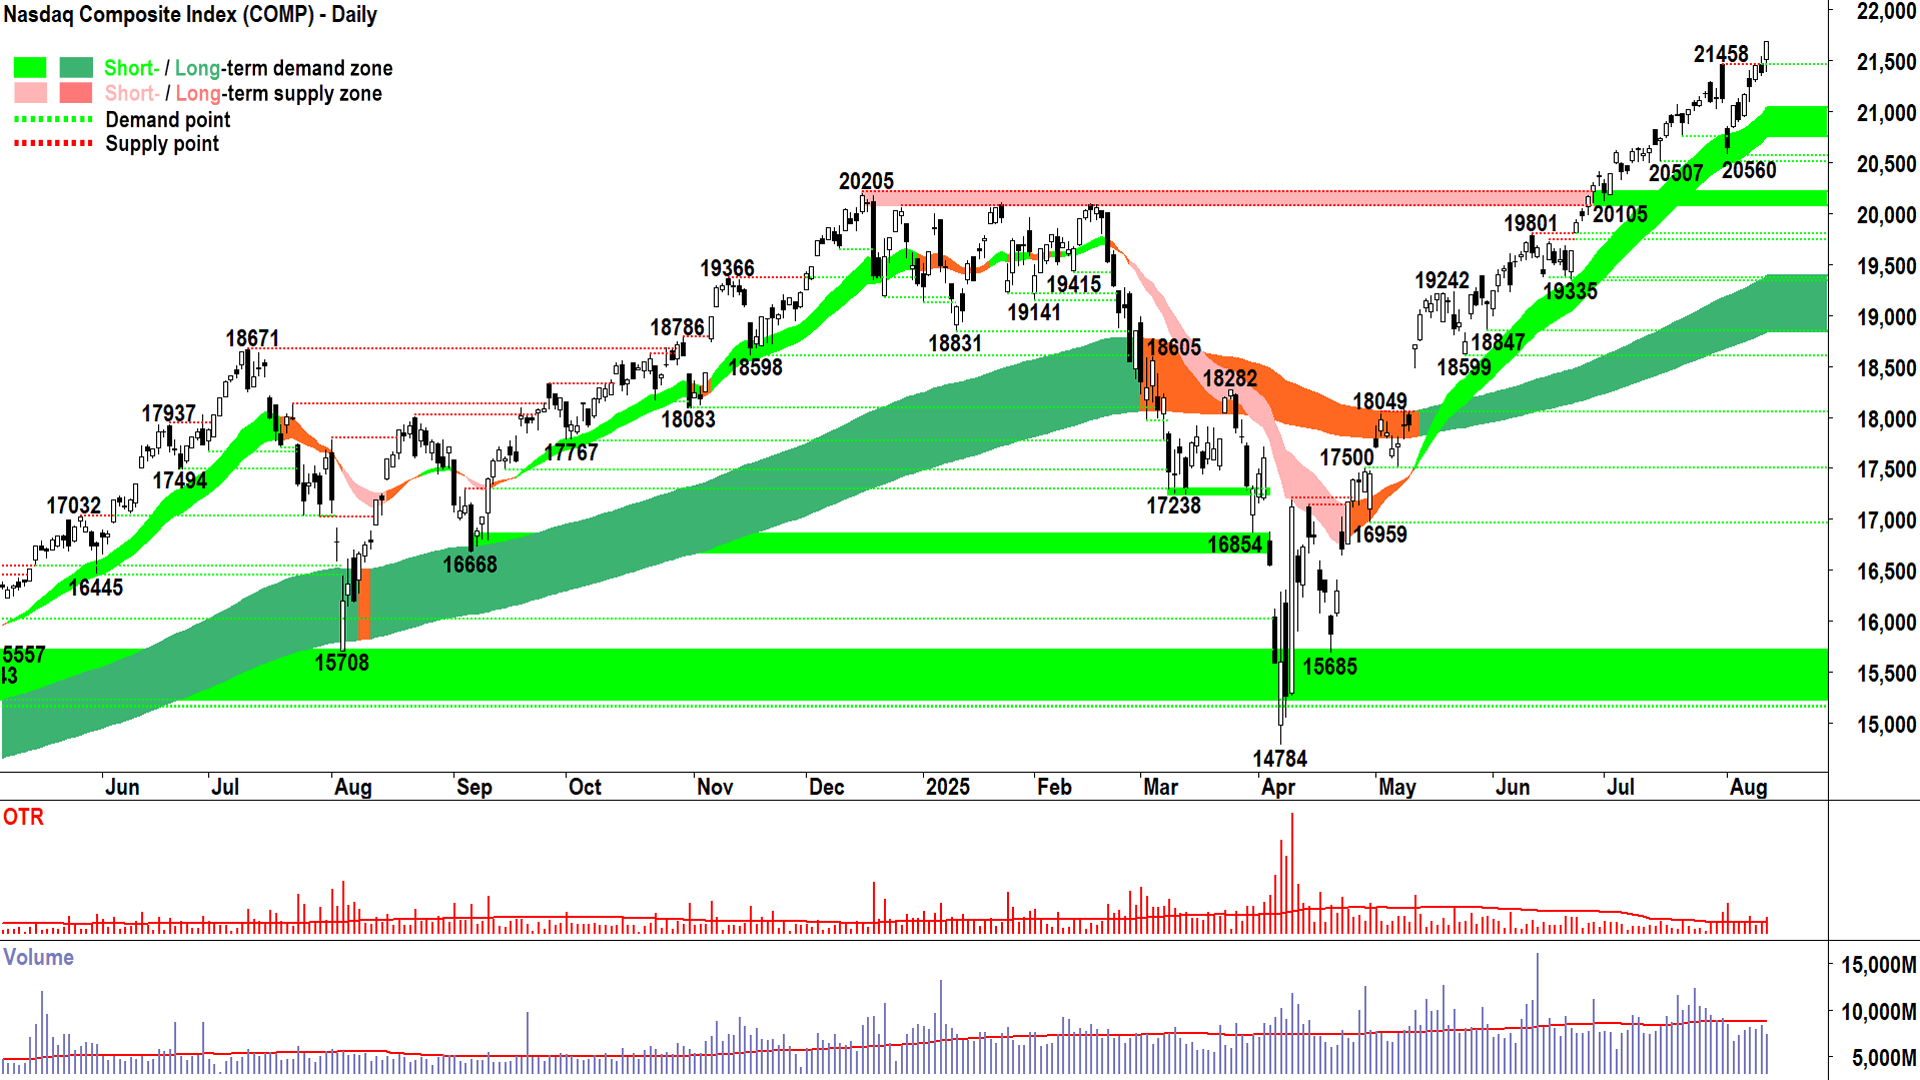
NASDAQ Composite Index

An interesting chart (click here for full size image)
It’s a little quirky, but the zebra continued on Tuesday – or more specifically, the +1% average per day zebra. Basically, alternating black and white candles of decent size (it’s far more common for small candles to alternate ad-infinitum!).
Yesterday I said that a +1% average 6-candle zebra (which requires 7 candles because the first zebra candle is actually the second candle – because you can’t alternate until the second candle!) was on the rare side, only happening once or twice a year. Today’s 7-candle zebra (which requires 8 candles!) has happened just 20 times since the turn of the century – and generally during periods of extreme volatility, e.g. COVID-19, GFC etc.
As I said quirky. It suggests we’re seeing a touch of volatility that’s not all that common.
Zebras aside, what can I say? Heck, what do you say? 🤔
You’ve suffered through enough editions of ChartWatch to make a call on a chart like the one above! 🧐
If you weren’t a trend follower, you might be “one of those people” who decry new stock market highs as “the market has lost its marbles”, “stocks are crazy expensive”, “surely it can’t go on…surely stocks are about to crassshhhh!!!” (brain explodes from sheer disbelief 🤯!).
Nope, your brain is firmly intact within your also intact skull. You know that what’s happening on the Comp is perfectly normal – in fact, it’s absolutely to be expected given the current state of the technicals. Let’s recap them:
✅ Short term uptrend (light green ribbon), rising steeply, expanding, and the short term uptrend ribbon is acting as a zone of dynamic demand
✅ Long term uptrend (dark green ribbon), rising steeply, expanding, and the long term uptrend ribbon is acting as a zone of dynamic demand
✅ Price action is rising peaks, falling troughs, but last trough to peak move is steep
✅ Candles are predominantly demand-side in nature (i.e., white-bodied and or downward pointing shadows)
The only blemish is in the price action – but given the steepness of the rally from that last, lower trough – we must conclude the demand-side is firmly in control. I propose the last candle tips us back to “predominantly demand-side in nature”, but also concede they’re let down by “that Thursday” and “that Friday” (i.e., 31-Jul and 1-Aug) – but again, that the ship has been promptly righted there.
So, demand-side control stuff. So, more often than not (MOTN) next candle is up.
Conclusion: No change here. Stay the course. FRP.
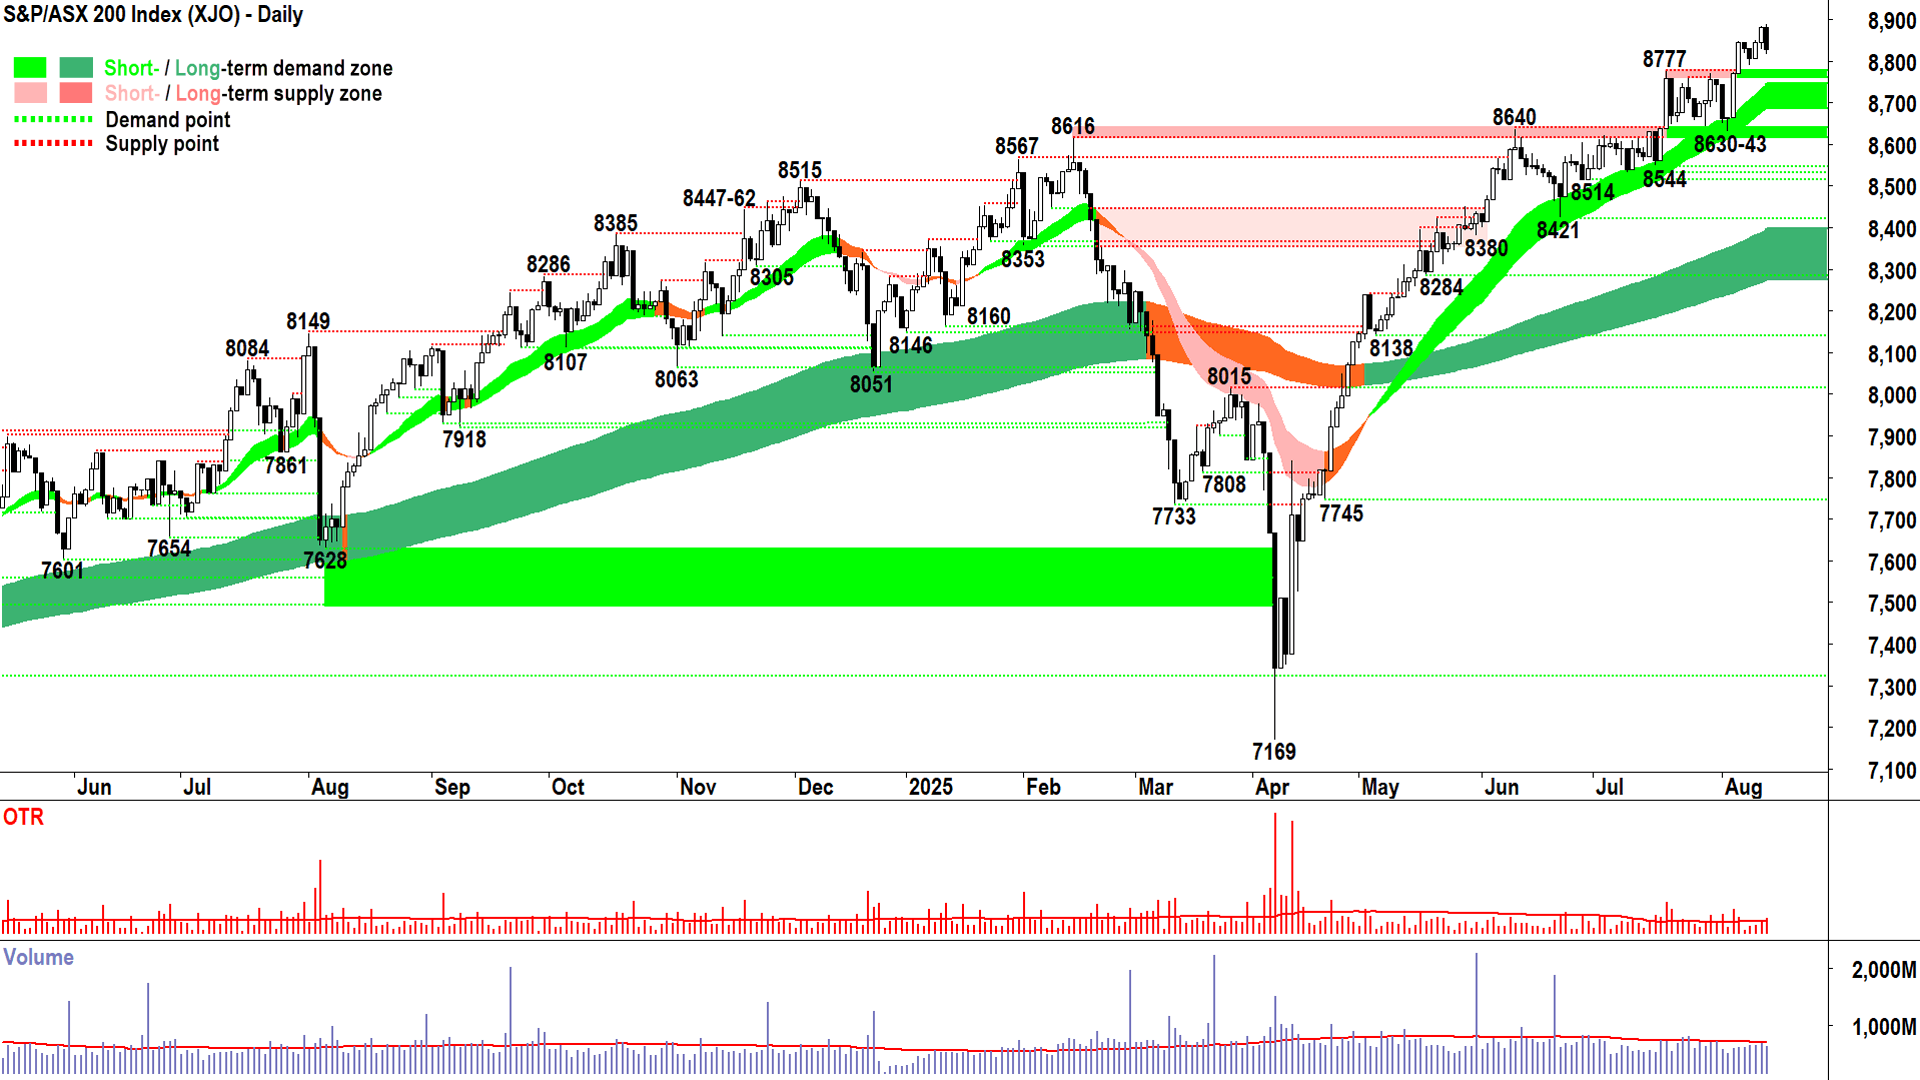
S&P/ASX 200 (XJO)
%20chart_13%20Aug.png)
An interesting chart (click here for full size image)
I’d love to know how much of today’s candle is a result of CBA’s drop. 🤔
Not that it matters for our analysis…I’m just curious…our job is to analyse the candle we can see.
We found some supply today. Not a great deal – today’s candle isn’t very big compared to those in the recent past. But it’s there – so we need to be watchful for continued signs the supply-side is creeping up in terms of their control of price.
Given we can’t tell the future (I’m assuming that if you could tell the future then you wouldn’t be reading this Evening Wrap), we don’t know if today’s modest little black smudge is the beginning of the worst bear market of all time, or just a one-day pause in this otherwise exemplary bull market.
But what we lack in future predicting abilities, we make up for in MOTN.
We know that MOTN, given those squiggly lines and black and white smudges on the XJO’s chart – aka Carl’s trend following model – that more often than not the price will keep going up.
And that’s good enough for me.
Conclusion: Watching the candles at 8760-8777 closely, ideally no close below there, but more importantly no close below the short term uptrend ribbon presently at 8685-8743. The short term uptrend remains intact until the latter occurs. Ideally, we see white bodies and or downward pointing shadows sooner rather than later to tell us the demand-side has resumed control of the price.
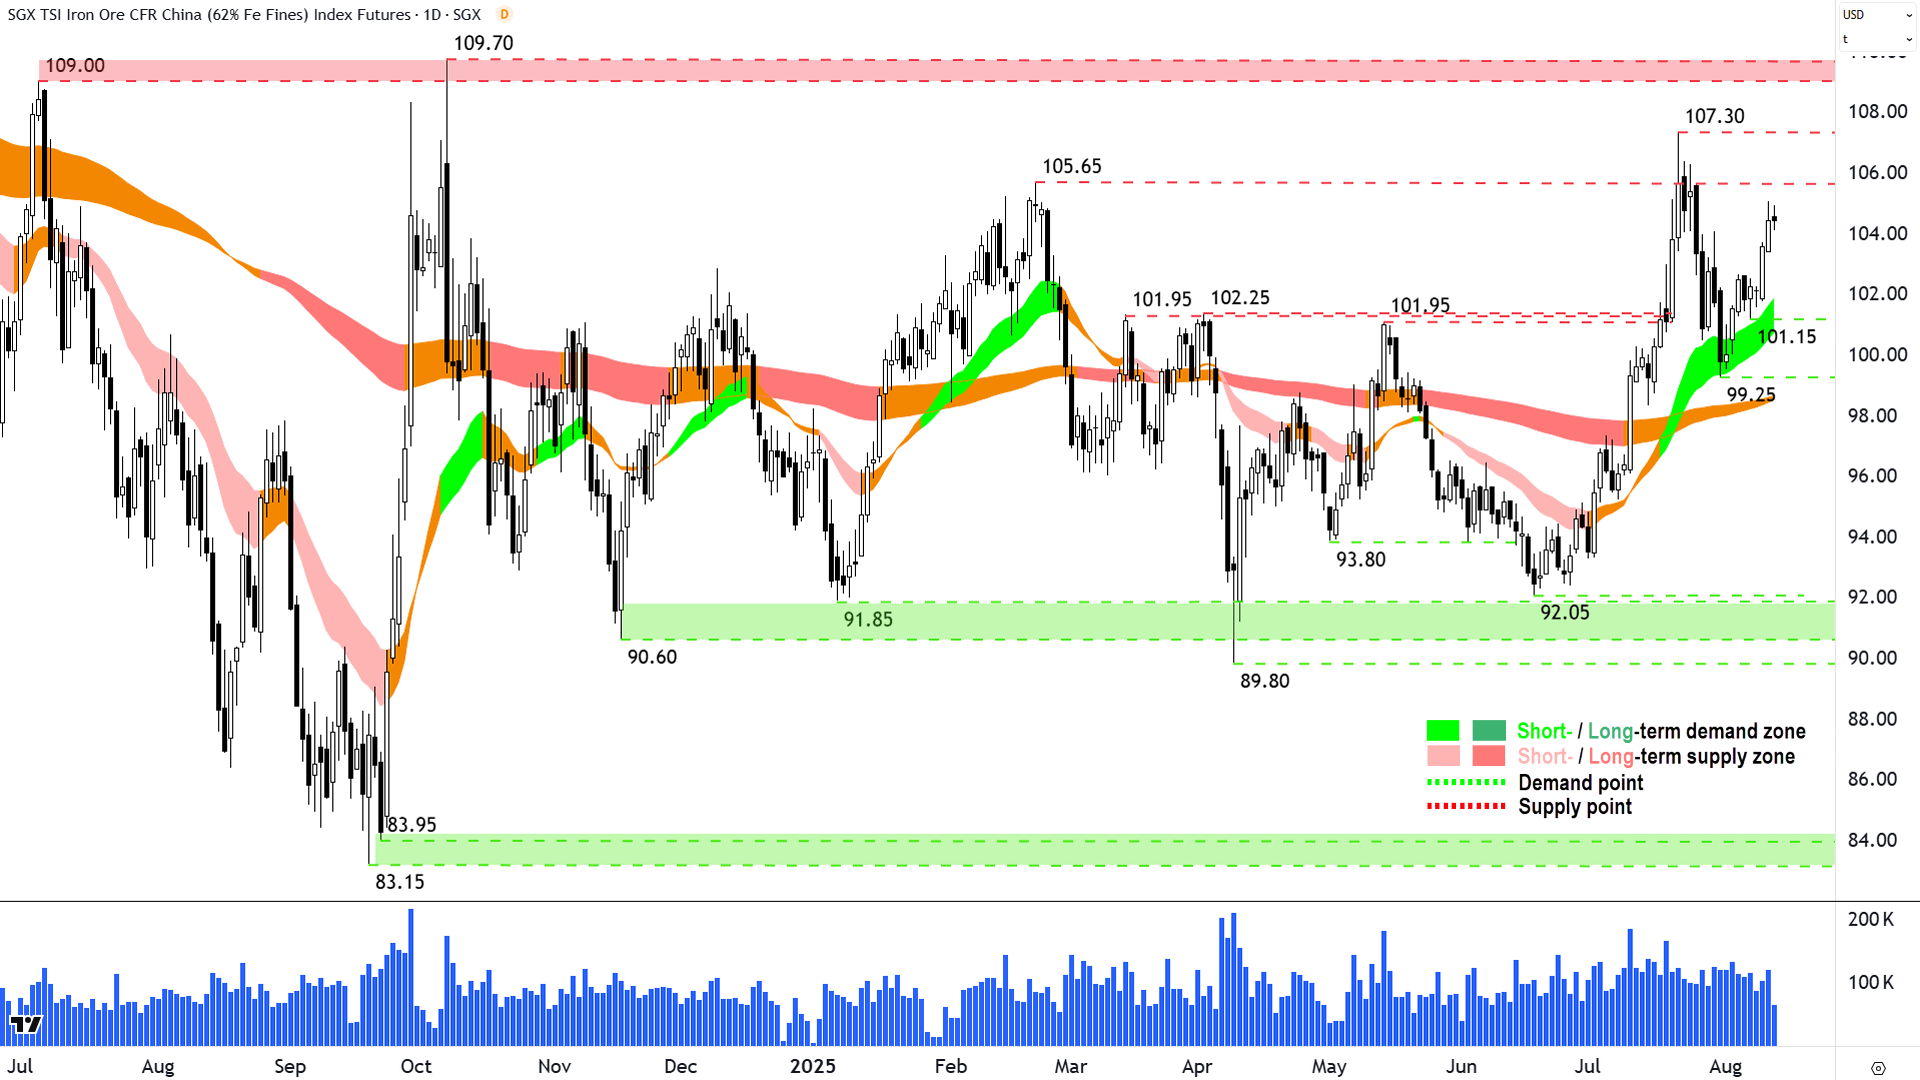
Iron Ore 62% (Front month, back-adjusted) SGX
%20SGX%20chart_13%20Aug.png)
An interesting chart (click here for full size image)
The last time we covered iron ore was in ChartWatch in the Evening Wrap on 4-Aug.
In that update, we noted a market that had largely moved back to neutrality, albeit being supported by the dynamic demand of the short term uptrend ribbon.
Good news for iron ore bulls, the short term uptrend (as it is prone to doing) has acted as somewhat of a trampoline for the price to bounce off.
The long term trend is still neutral, but the recent bounce is dragging it closer to an uptrend than a downtrend.
Price action is back to rising peaks and rising troughs – another positive sign – as it signals supply removal and demand reinforcement respectively.
Candles since the rebound appear predominantly demand-side in nature, but if we look a few weeks out, perhaps a little more evenly balanced. And that idea of “still rather evenly balanced” should not be understated here.
Certainly, yes, the technical picture for iron ore is substantially more demand-side oriented than our last update – but it’s still vibrating within a wide and well-defined trading range.
At the very least, we can say that the likelihood of the iron ore price continuing to trend in line with the prevailing short term uptrend, price action, and candles is strong – together they are credible showing of developing demand-side control.
But, we look to the supply zone at 105.65-107.30 as a key level where this short term uptrend may be challenged. It’s backed up by even more significant supply at 109-109.70.
Conclusion: Happy to back the developing short term uptrend here, but would be very wary of large supply-side candles in the two defined supply zone. At the same time – strong demand-side candles in those zones likely sets iron ore up for a break into the teens (next major point of supply is 117.35).
Economy
Today
AUS Wage Price Index June Quarter
+0.84% q/q vs +0.80% forecast and +0.9% q/q in March
+3.37% p.a. vs +3.40% p.a. in March quarter
Public sector wages +1.0% q/q and 3.7% p.a. vs private sector wages +0.8% q/q and +3.4% p.a.
All industries now showing wages growth greater than headline CPI = real incomes (take home pay minus inflation) are rising (~1.3% p.a.)

Australia Wage Price Index June Quarter. Source: AMP Economics
Later this week
Thursday
11:30 AUS Employment Data July
Employment change: +25,300 forecast vs +2,000 in June
Unemployment rate: 4.2% forecast vs 4.3% in June
22:30 USA Core Producer Price Index (PPI) July (+0.2% m/m forecast vs +0.0% m/m in June)
Friday
12:00 CHN China Data Dump July
New Home Prices m/m
Industrial Production y/y: +6.0% p.a. forecast vs +6.8% p.a. in June
Retail Sales y/y: +4.6% p.a. forecast vs +4.8% p.a. in June
Fixed Asset Investment ytd/y: +2.7% ytd/y forecast vs +2.8% ytd/y in June
Unemployment Rate: +5.1% forecast vs +5.0% previous
22:30 USA Core Retail Sales July (+0.3% m/m forecast vs +0.5% m/m in June)
Saturday
00:00 USA Prelim UoM Consumer Sentiment August (61.9 forecast vs 61.7 in July)
Latest News
Interesting Movers
Trading higher
+22.2% Orbital Corporation (OEC) – Response to ASX Price Query, rise is consistent with prevailing short and long term uptrends 🔎📈
+19.8% Benz Mining Corp. (BNZ) – Drilling to Accelerate at Glenburgh with A$30M Bought Deal, rise is consistent with prevailing short and long term uptrends, a regular in ChartWatch ASX Scans Uptrends list 🔎📈
+16.2% Lindian Resources (LIN) – Continued positive response to 11-Aug Stage 2 Mining Licence Expansion Approved, rise is consistent with prevailing short term uptrend and long term trend is transitioning from down to up, a regular in ChartWatch ASX Scans Uptrends list 🔎📈
+16.1% Aml3d (AL3) – No news, rise is consistent with prevailing short and long term uptrends 🔎📈
+13.8% Avita Medical (AVH) – AVITA Medical Successfully Completes Australian Equity Raise.
+13.3% Chrysos Corporation (C79) – Continued positive response to 12-Aug June 2025 Trading Update, rise is consistent with prevailing short term uptrend and long term trend is transitioning from down to up, a recent regular in ChartWatch ASX Scans Uptrends list 🔎📈
+11.4% Tyro Payments (TYR) – Tyro Responds to ASX Price Query and Becoming a substantial holder, rise is consistent with prevailing short term uptrend and long term trend is transitioning from down to up, a recent regular in ChartWatch ASX Scans Uptrends list 🔎📈
+9.9% Nanoveu (NVU) – No news, rise is consistent with prevailing short and long term uptrends, a regular in ChartWatch ASX Scans Uptrends list 🔎📈
+8.9% 4DMEDICAL (4DX) – Continued positive response to 31-Jul 4DMedical secures $10m strategic investment from Pro Medicus, rise is consistent with prevailing short term uptrend and long term trend is transitioning from down to up, a recent regular in ChartWatch ASX Scans Uptrends list 🔎📈
+7.0% Alcoa Corporation (AAI) – No news 🤔
+6.5% Firefly Metals (FFM) – No news 🤔
+6.5% Dateline Resources (DTR) – Continued positive response to 11-Aug REE Target Found Beneath Fenite Outcrops, rise is consistent with prevailing short and long term uptrends, a regular in ChartWatch ASX Scans Uptrends list 🔎📈
+6.1% Turaco Gold (TCG) – No news, rise is consistent with prevailing short and long term uptrends 🔎📈
+5.6% Qantas Airways (QAN) – No news, rise is consistent with prevailing short and long term uptrends, a regular in ChartWatch ASX Scans Uptrends list 🔎📈
+5.5% Findi (FND) – No news 🤔
+5.5% Life360 (360) – Continued positive response to 12-Aug SEC Form 10-Q, rise is consistent with prevailing short and long term uptrends 🔎📈
+5.3% Eroad (ERD) – SPH Notice Regal Funds Management, rise is consistent with prevailing short and long term uptrends, a regular in ChartWatch ASX Scans Uptrends list 🔎📈
+5.2% Clarity Pharmaceuticals (CU6) – No news, bounced in the wake of the recent sharp selloff.
+5.2% Asara Resources (AS1) – No news, rise is consistent with prevailing short and long term uptrends 🔎📈
+5.1% Data#3 (DTL) – No news 🤔
+4.9% Nick Scali (NCK) – Continued positive response to 08-Aug NCK FY25 Results, rise is consistent with prevailing short and long term uptrends, a regular in ChartWatch ASX Scans Uptrends list 🔎📈
+4.5% Qoria (QOR) – No news, rise is consistent with prevailing short and long term uptrends, a regular in ChartWatch ASX Scans Uptrends list 🔎📈
Trading lower
-16.5% Bravura Solutions (BVS) – FY25 Results Presentation and Change to Board of Directors.
-13.1% AGL Energy (AGL) – FY25 Results Presentation and 2025 Annual Report.
-8.2% Energy Transition Minerals (ETM) – No news, pulled back in the wake of recent sharp rally.
-7.5% Beach Energy (BPT) – No news, general weakness across the broader Energy sector today, repelled perfectly from long term downtrend ribbon! 🔎📉
-6.9% Sayona Mining (SYA) – No news, general weakness across the broader Lithium sector today, pulled back in the wake of recent sharp rally.
-6.6% Pilbara Minerals (PLS) – No news, general weakness across the broader Lithium sector today, pulled back in the wake of recent sharp rally.
-6.3% American Rare Earths (ARR) – Change in substantial holding.
-6.1% Austin Engineering (ANG) – Restatement of FY24 Financials and FY25 Guidance Impact, fall is consistent with prevailing short and long term downtrends, a regular in ChartWatch ASX Scans Downtrends list 🔎📉
-5.4% Commonwealth Bank of Australia (CBA) – 2025 Full Year Financial Results Media Release and 2025 Annual Report.
-5.0% EQT (EQT) – Statement on coverage of Noongar Charitable Trust.
-4.6% Mineral Resources (MIN) – Change in substantial holding (JP Morgan decrease), general weakness across the broader Lithium sector today, pulled back in the wake of recent sharp rally.
-4.3% Liontown Resources (LTR) – No news, general weakness across the broader Lithium sector today, pulled back in the wake of recent sharp rally.
-4.0% Core Lithium (CXO) – No news, general weakness across the broader Lithium sector today, pulled back in the wake of recent sharp rally.
-3.8% Karoon Energy (KAR) – No news, general weakness across the broader Energy sector today.
-3.8% Audinate Group (AD8) – No news, fall is consistent with prevailing short and long term downtrends, one of the most Featured (highest conviction) stocks in ChartWatch ASX Scans Downtrends list 🔎📉
Broker Moves
Life360 Inc (360)
Retained at Buy at Bell Potter; Price Target: $47.50 from $37.50
Retained at Buy at Citi; Price Target: $47.00 from $46.20
Retained at Buy at Goldman Sachs; Price Target: $45.10 from $43.20
Retained at Overweight at Morgan Stanley; Price Target: $51.00 from $40.00
Upgraded to Accumulate from Hold at Ord Minnett; Price Target: $45.00 from $39.00
Retained at Outperform at RBC Capital Markets; Price Target: $45.00 from $40.00
Retained at Buy at UBS; Price Target: $85.00 from $71.00
AGL Energy (AGL)
Retained at Outperform at Macquarie; Price Target: $11.13
Retained at Outperform at RBC Capital Markets; Price Target: $13.00
Retained at Neutral at UBS; Price Target: $11.50
Alkane Resources (ALK)
Upgraded to Accumulate from Hold at Ord Minnett; Price Target: $1.00 from $0.65
Amotiv (AOV)
Retained at Buy at UBS; Price Target: $10.90 from $12.60
Arena REIT (ARF)
Retained at Outperform at Macquarie; Price Target: $3.96
Retained at Neutral at UBS; Price Target: $4.19
Anteris Technologies (AVR)
Retained at Speculative buy at Bell Potter; Price Target: $10.00 from $15.00
Retained at Buy at Bell Potter; Price Target: $10.00 from $15.00
Aurizon Holdings (AZJ)
Retained at Neutral at UBS; Price Target: $3.25 from $3.20
Beach Energy (BPT)
Downgraded to Underperform from Neutral at Macquarie; Price Target: $0.95 from $1.35
Bravura Solutions (BVS)
Retained at Positive at E&P; Price Target: $2.90
Chrysos Corporation (C79)
Retained at Buy at Shaw and Partners; Price Target: $6.80
CAR Group (CAR)
Retained at Buy at Ord Minnett; Price Target: $41.00 from $39.00
Commonwealth Bank of Australia (CBA)
Retained at Sell at Citi; Price Target: $100.00
Retained at Sell at Jarden; Price Target: $110.00
Retained at Underweight at JPMorgan; Price Target: $120.00
Retained at Underperform at Macquarie; Price Target: $105.00
Retained at Sell at UBS; Price Target: $120.00
Capricorn Metals (CMM)
Downgraded to Neutral from Overweight at JPMorgan; Price Target: $10.25
Computershare (CPU)
Retained at Neutral at Citi; Price Target: $40.90
Downgraded to Hold from Outperform at CLSA; Price Target: $42.70 from $38.70
Retained at Neutral at Jarden; Price Target: $36.50 from $37.00
Retained at Hold at Jefferies; Price Target: $39.50
Retained at Underweight at Morgan Stanley; Price Target: $33.70
Retained at Sell at UBS; Price Target: $41.20 from $41.50
Coronado Global Resources Inc (CRN)
Retained at Buy at Argonaut Securities; Price Target: $0.30 from $0.70
Retained at Hold at Jefferies; Price Target: $0.30 from $0.20
Retained at Underperform at Macquarie; Price Target: $0.18 from $0.11
Retained at Hold at Ord Minnett; Price Target: $0.26 from $0.15
Corporate Travel Management (CTD)
Downgraded to Neutral from Buy at UBS; Price Target: $16.70 from $13.55
Cygnus Metals (CY5)
Retained at Buy at Shaw and Partners; Price Target: $0.25
Dalrymple Bay Infrastructure (DBI)
Downgraded to Hold from Accumulate at Morgans; Price Target: $4.70 from $4.35
Dicker Data (DDR)
Initiated at Neutral at Macquarie; Price Target: $9.35
Data3 (DTL)
Initiated at Outperform at Macquarie; Price Target: $9.00
EBR Systems Inc (EBR)
Retained at Speculative Buy at Bell Potter; Price Target: $2.25
Evolution Mining (EVN)
Retained at Neutral at Citi; Price Target: $7.60
Retained at Underperform at Macquarie; Price Target: $7.00
Genesis Minerals (GMD)
Upgraded to Overweight from Neutral at JPMorgan; Price Target: $4.40 from $4.20
Graincorp (GNC)
Retained at Outperform at Macquarie; Price Target: $9.10 from $9.00
Hazer Group (HZR)
Retained at Buy at Shaw and Partners; Price Target: $0.70
Insurance Australia Group (IAG)
Retained at Buy at Citi; Price Target: $10.00
IRESS (IRE)
Retained at Buy at Shaw and Partners; Price Target: $9.10
LGI (LGI)
Retained at Buy at Canaccord Genuity; Price Target: $4.30 from $3.50
Retained at Accumulate at Morgans; Price Target: $4.20 from $3.30
Retained at Buy at Shaw and Partners; Price Target: $4.60 from $3.60
Plenti Group (PLT)
Initiated at Buy at Moelis Australia; Price Target: $1.53
SGH (SGH)
Retained at Hold at Bell Potter; Price Target: $51.00 from $54.00
Retained at Buy at Goldman Sachs; Price Target: $54.90 from $58.10
Retained at Hold at Jefferies; Price Target: $51.20 from $56.70
Retained at Outperform at Macquarie; Price Target: $53.20 from $59.20
Retained at Accumulate at Ord Minnett; Price Target: $52.00 from $56.00
Service Stream (SSM)
Retained at Buy at Citi; Price Target: $2.35 from $2.00
Seven West Media (SWM)
Retained at Neutral at E&P; Price Target: $0.17 from $0.20
Retained at Hold at Jefferies; Price Target: $0.15 from $0.20
Retained at Neutral at JPMorgan; Price Target: $0.15 from $0.17
Retained at Neutral at Macquarie; Price Target: $0.16 from $0.18
Southern Cross Electrical Engineering (SXE)
Retained at Buy at Shaw and Partners; Price Target: $2.40
Titan Minerals (TTM)
Retained at Speculative Buy at Canaccord Genuity; Price Target: $1.40 from $1.18
Treasury Wine Estates (TWE)
Retained at Neutral at Citi; Price Target: $8.50
Retained at Neutral at Macquarie; Price Target: $8.00
Retained at Outperform at RBC Capital Markets; Price Target: $10.70
Retained at Buy at UBS; Price Target: $10.00
Veem (VEE)
Retained at Buy at Ord Minnett; Price Target: $1.90
Scans
Top Gainers
Code | Company | Last | % Chg |
|---|---|---|---|
| OD6 | OD6 Metals Ltd | $0.068 | +94.29% |
| BMM | Bayan Mining and Minerals Ltd | $0.13 | +51.16% |
| SPL | Starpharma Holdings Ltd | $0.145 | +26.09% |
| LIO | Lion Energy Ltd | $0.015 | +25.00% |
| THB | Thunderbird Resources Ltd | $0.015 | +25.00% |
Top Fallers
Code | Company | Last | % Chg |
|---|---|---|---|
| BEL | Bentley Capital Ltd | $0.015 | -42.31% |
| KFM | Kingfisher Mining Ltd | $0.057 | -22.97% |
| OZM | Ozaurum Resources Ltd | $0.062 | -17.33% |
| SRK | Strike Resources Ltd | $0.029 | -17.14% |
| EVE | EVE Health Group Ltd | $0.03 | -16.67% |
52 Week Highs
Code | Company | Last | % Chg |
|---|---|---|---|
| BMM | Bayan Mining and Minerals Ltd | $0.13 | +51.16% |
| SPL | Starpharma Holdings Ltd | $0.145 | +26.09% |
| BCK | Brockman Mining Ltd | $0.022 | +22.22% |
| OEC | Orbital Corporation Ltd | $0.33 | +22.22% |
| CP8 | Canadian Phosphate Ltd | $0.08 | +21.21% |
52 Week Lows
Code | Company | Last | % Chg |
|---|---|---|---|
| FNX | Finexia Financial Group Ltd | $0.17 | -15.00% |
| AGL | AGL Energy Ltd | $8.88 | -13.11% |
| TEE | Top End Energy Ltd | $0.034 | -12.82% |
| ACR | ACRUX Ltd | $0.014 | -12.50% |
| TRU | Truscreen Group Ltd | $0.015 | -11.77% |
Near Highs
Code | Company | Last | % Chg |
|---|---|---|---|
| SMLL | Betashares Australian Small Companies Select ETF | $3.89 | +0.26% |
| ECF | Elanor Commercial Property Fund | $0.68 | 0.00% |
| OZBD | Betashares Australian Composite Bond ETF | $45.41 | +0.13% |
| DFND | Vaneck Global Defence ETF | $36.03 | +1.04% |
| E25 | Element 25 Ltd | $0.30 | 0.00% |
Relative Strength Index (RSI) Oversold
Code | Company | Last | % Chg |
|---|---|---|---|
| ASX | ASX Ltd | $63.68 | -2.39% |
| MHK | Metal Hawk Ltd | $0.175 | -2.78% |
| BOE | Boss Energy Ltd | $1.735 | -1.98% |
| GQG | GQG Partners Inc | $1.72 | -2.27% |
| GTK | Gentrack Group Ltd | $8.65 | -1.03% |
