News | Market Wraps
Evening Wrap: ASX 200 shrugs off US stocks' tumble as investors snap up gold and other defensive plays
The S&P/ASX 200 closed 1.7 points higher, up 0.02%.

Mentioned
The S&P/ASX 200 closed 1.7 points higher, up 0.02%.
Despite heavy falls in US markets on Friday, local stocks showed substantial resilience, shrugging off early losses and sneaking into the black by the close.
Whilst a commendable performance at the benchmark level, it was the "Defensives" of Gold, Consumer Staples, Utilities, Telecommunications, and Healthcare that led the way. On the other hand, local Information Technology shares followed their American counterparts lower, and major Energy stocks were dragged down by the falling crude price.
There are plenty of moving parts to today's narrow escape, and given growing fears that the problems in the US are only just beginning – investors must remain vigilant to the risks.
To make sense of all the above, I have detailed technical analysis on US bond yields and the US Dollar Index, as well as the Nasdaq Composite, S&P/ASX 200, and Iron Ore in today's ChartWatch.
Be sure to click/scroll through for the usual reporting of the major sector and stock-specific moves, the broker responses to them, as well as all the key economic data in tonight's Evening Wrap.
Let's dive in!
Today in Review
Mon 04 Aug 25, 5:00pm (AEST)
Name | Value | % Chg |
|---|---|---|
Major Indices | ||
| ASX 200 | 8,663.7 | +0.02% |
| All Ords | 8,922.0 | +0.06% |
| Small Ords | 3,331.5 | +0.34% |
| All Tech | 4,164.6 | -0.61% |
| Emerging Companies | 2,370.5 | +0.77% |
Currency | ||
| AUD/USD | 0.6483 | +0.18% |
US Futures | ||
| S&P 500 | 6,287.5 | +0.37% |
| Dow Jones | 43,838.0 | +0.29% |
| Nasdaq | 22,982.0 | +0.43% |
Name | Value | % Chg |
|---|---|---|
Sector | ||
| Materials | 16,667.9 | +1.22% |
| Consumer Staples | 12,193.7 | +1.15% |
| Utilities | 9,731.7 | +0.58% |
| Communication Services | 1,879.5 | +0.51% |
| Health Care | 44,575.0 | +0.17% |
| Real Estate | 3,974.8 | -0.07% |
| Consumer Discretionary | 4,240.4 | -0.11% |
| Information Technology | 2,960.9 | -0.42% |
| Financials | 9,277.4 | -0.57% |
| Energy | 9,090.8 | -0.57% |
| Industrials | 8,386.7 | -0.60% |
Markets
%20intraday%20chart%2004%20Aug%202025.png)
ASX 200 Session Chart
Markets
The S&P/ASX 200 (XJO) finished 1.7 points higher at 8,663.7, 0.38% from its session low and just 0.03% from its high. As if proving the near dead-heat between demand and supply, in the broader-based S&P/ASX 300 (XKO) advancers lagged decliners by a sliver – 135 to 136.
I expect you've already read about the reasons for Friday's wipeout on US markets. For those who haven't, in a nutshell:
Trump tariff executive orders = Scatter-gun approach to trade policy, restoked global trade uncertainty fears... Plus the general disdain for volatile US trade / broader policy agenda which has powered major de-dolarisation trends 👎
Non-farm payrolls miss = Is Trump's trade agenda beginning to cost American jobs? This was a major warning sign for the US economy, with just 73k jobs added in July – anemic at best – and there were massive downward revisions to June (to 14k from 147k!) and May (to 19k from 144k!). 👎
June PCE miss = This was Thursday, but the the employment data debacle refocussed investors attention on the modest miss in the Fed's preferred measure of inflation. The fear here is that tariffs are starting to feed into inflation, and even if only responsible for a modest inflationary pulse, they will hamper the Fed's ability to respond to the weakening US economy... 👎
Trump fires BLS boss. Shortly after the NFP release, President Trump fired the US Bureau of Labor Statistics (BLS) commissioner claiming political bias. The announcement, via social media post of course, promised the new BLS chief would be "more more competent and qualified" = Chaotic government and undermines market's ongoing trust in critical economic data. 👎👎
What a mess...🤦
US stocks had shrugged off everything thrown at them so far in this tumultuous 2025, but Friday's combo meal of calamities was just too much to digest 🤢.
Anyways, I'm not a political commentator, so I'll just stick to the market's response. You know that stocks got dumped – after all, stock fund managers are just risk managers... it makes sense they took steps to manage their risk on Friday.
The only good news is that it appears much of the cash coming out of stocks stayed in the US and wasn't systematically diverted, therefore threatening a repeat of the "dark days" of the April disaster where the dissolving US bond market forced President Trump to back away from many of his harshest trade policies.
The bond market now is beautiful
– President Donald Trump, 9 April


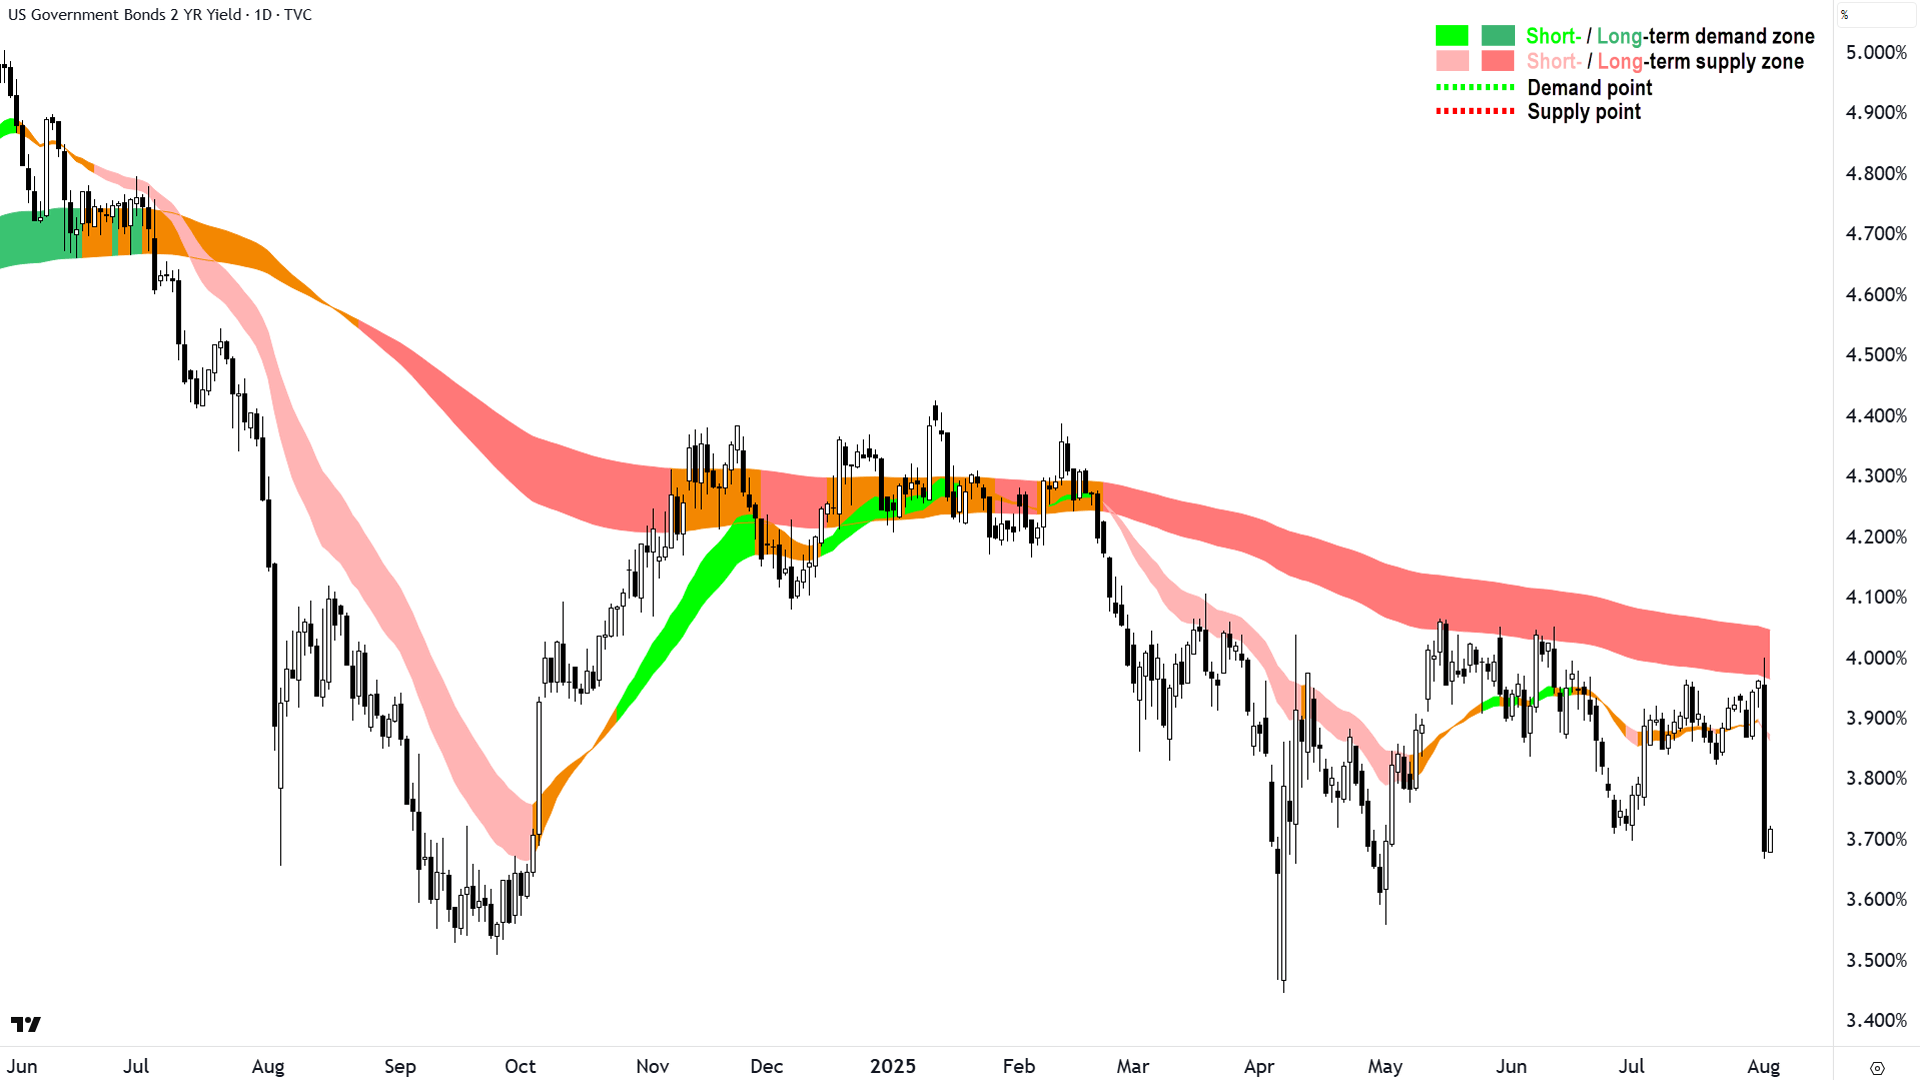
US 2 Year T-Bond Yield (Top) and US 10 Year T-Bond Yield (Bottom) (click here for full size image)
Remember, falling bond yields equal rising bond prices. So, cash flowed out of stocks and into bonds on Friday (yes, lots of it likely stayed in cash, too!). This is typical risk-off stuff. It's what we'd expect when the system is functioning normally. Benchmark 10-year T-Bond yields also rose sharply, as did the 30's (not shown) which US mortgage rates are typically tied to.
The US dollar fell, indicating some cash decided the "US trade" is getting too hard again, but not enough to suggest a wholesale dumping of / aversion to US assets (again, quite a typical response to weak US economic data, and only still considered a pullback after recent strength).
%20chart%2004%20Aug%202025.png)
US Dollar Index Futures (Front month, back-adjusted) ICE (click here for full size image)
There's so much that went wrong on Friday for risk-on, but the bond market isn’t telling us we're back to the "system is about to break" stuff that punctuated the massive March-April selloff. I know that selloff might be hard for many to remember... but try!
Conclusion? The good news is that this is a plain, garden variety risk-off event and not one where the system is on the verge of imploding. The bad news is this a plain, garden variety risk-off event – none of the four points listed above are typically positives for stock prices.
You might be wondering why our market so largely dodged the bullet today – I mean, hands up if you tipped we'd rise by 1.7 points? 🤔
(Put your hand down smarty pants, I don't believe you!)
Well, let's look at what went up: Gold (XGD) (+3.5%), Consumer Staples (XSJ) (+1.2%), Utilities (XUJ) (+0.6%), Telecommunications (XTJ) (+0.5%), Healthcare (XHJ) (+0.2%) rallied today – i.e., the "Defensives".
It's also no coincidence that many of these stocks are bond-market proxies (I.e., stable/high yield securities), and therefore tend to rally when bond yields fall. There was enough good stuff going on in these areas of the local market to outweigh the modest falls elsewhere.
It was a stellar performance all things considered. Perhaps we're seen as stable (and sane) place to park some cash? One thing we can see in market pricing, and for me is the likely real reason for today's stay of execution, is some money seems to be flowing back the other way in US futures trading.
First, note the last candles in the above charts – they're the tiny white ones after the big, black, Friday ones... That's today's trade so far – signs of pullback in bonds and a rebound in the DXY. Also note, US stock futures are 0.32% higher for the Nasdaq and 0.38% higher for the S&P 500.
The big question is what happens from here? That's the bit we'll try to explore in ChartWatch below!
Company | Last Price | Change $ | Change % | 1mo % | 1yr % |
|---|---|---|---|---|---|
Northern Star Resources (NST) | $16.16 | +$0.86 | +5.6% | -12.1% | +14.8% |
Lynas Rare Earths (LYC) | $11.25 | +$0.44 | +4.1% | +36.0% | +79.1% |
Mineral Resources (MIN) | $30.76 | +$0.9 | +3.0% | +23.2% | -43.3% |
Endeavour Group (EDV) | $4.16 | +$0.12 | +3.0% | +0.7% | -24.2% |
Perseus Mining (PRU) | $3.35 | +$0.09 | +2.8% | -3.5% | +32.4% |
Evolution Mining (EVN) | $7.23 | +$0.18 | +2.6% | -7.4% | +84.0% |
Coles Group (COL) | $20.89 | +$0.34 | +1.7% | -0.1% | +15.4% |
Whitehaven Coal (WHC) | $6.50 | +$0.1 | +1.6% | +9.4% | -15.8% |
Lendlease Group (LLC) | $5.35 | +$0.08 | +1.5% | -2.2% | -14.8% |
Fortescue (FMG) | $18.25 | +$0.27 | +1.5% | +11.8% | -3.3% |
AGL Energy (AGL) | $9.90 | +$0.14 | +1.4% | -1.5% | -4.6% |
Woolworths Group (WOW) | $31.68 | +$0.42 | +1.3% | +1.0% | -7.1% |
REA Group (REA) | $235.36 | +$2.62 | +1.1% | +1.6% | +15.0% |
IGO (IGO) | $4.63 | +$0.05 | +1.1% | +8.7% | -16.6% |
JB HI-FI (JBH) | $113.73 | +$1.1 | +1.0% | +3.4% | +65.0% |
BHP Group (BHP) | $39.59 | +$0.37 | +0.9% | +2.2% | -6.4% |
Pilbara Minerals (PLS) | $1.685 | +$0.015 | +0.9% | +11.2% | -42.5% |
Newmont Corporation (NEM) | $97.14 | +$0.85 | +0.9% | +6.8% | +31.9% |
Today's best blue chip gainers
Company | Last Price | Change $ | Change % | 1mo % | 1yr % |
|---|---|---|---|---|---|
Block (XYZ) | $114.77 | -$4.83 | -4.0% | +9.8% | +21.1% |
Computershare (CPU) | $40.50 | -$1.12 | -2.7% | +2.0% | +46.5% |
Light & Wonder (LNW) | $145.59 | -$3.16 | -2.1% | -2.9% | -11.7% |
QBE Insurance Group (QBE) | $22.45 | -$0.45 | -2.0% | -0.7% | +24.2% |
AMP (AMP) | $1.600 | -$0.03 | -1.8% | +12.3% | +35.0% |
SGH (SGH) | $49.84 | -$0.91 | -1.8% | -3.0% | +27.2% |
Wisetech Global (WTC) | $114.31 | -$2.03 | -1.7% | +2.0% | +19.7% |
The A2 Milk Company (A2M) | $7.77 | -$0.13 | -1.6% | -4.2% | +8.5% |
Worley (WOR) | $13.17 | -$0.21 | -1.6% | -1.1% | -13.2% |
ANZ Group (ANZ) | $30.39 | -$0.48 | -1.6% | +0.2% | +4.6% |
ALS (ALQ) | $17.82 | -$0.24 | -1.3% | +2.5% | +18.2% |
Amcor (AMC) | $14.45 | -$0.19 | -1.3% | -3.2% | -10.7% |
Woodside Energy Group (WDS) | $26.19 | -$0.34 | -1.3% | +8.9% | -5.1% |
Today's worst blue chip losers
ChartWatch
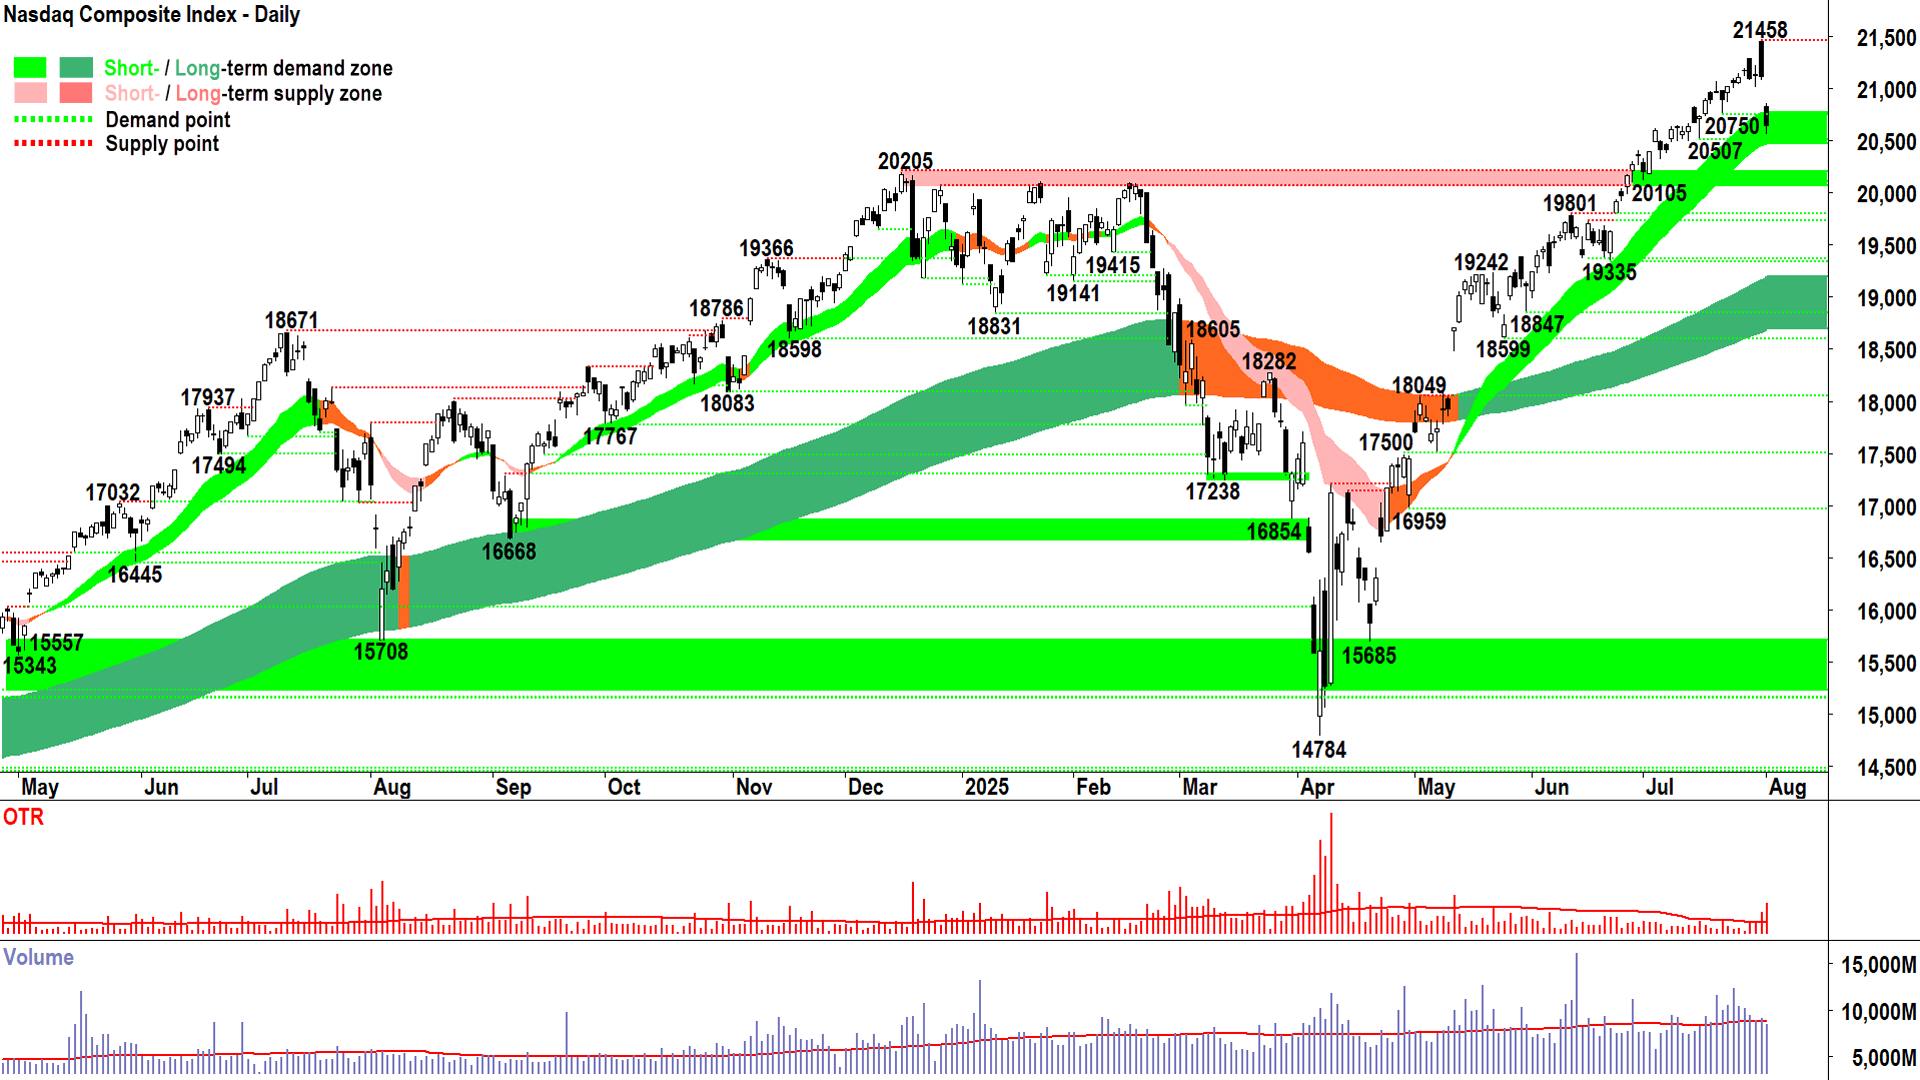
NASDAQ Composite Index

That Candle – Episode II (click here for full size image)
I have a theory about Tuesday’s supply side candle 🤔. That’s the longish black candle three from the end of the chart above, after which we noted here in Wednesday’s Wrap, was a “clear supply-side showing” and “is a warning signal that we’ve finally found some credible supply on the Comp”.
Note though, before I tell you my theory, that I did not predict after reviewing Tuesday's candle the carnage that was to follow on Friday… This is partly because I don't predict (because I can't tell the future), and because there just wasn't enough evidence in the technicals to do so at the time.
But I think you’ll agree that after Thursday’s candle, I made my view that risks had substantially heightened very clear (i.e., after “that candle”). Anyways… to my theory…🧐
And can I say, this theory I'm about to share with you is pure and unadulterated conjecture, speculation, and downright conspiracy theory – it should not be taken seriously at all… or even read for that matter – it is too shocking – so please just skip it and jump to the ASX 200 analysis!
Well, it goes like this…
"Someone (or some people) got wind of Friday’s jobs data before the US market opened on Tuesday, and in anticipation of the carnage and tremendous shenanigans that were likely to prevail later in the week, took the opportunity of Tuesday’s high open to start their selling. Their strategic selling through the week beat down Wednesday’s early rally, and instigated Thursday’s massive black-bodied supply-side showing (again, “that candle”). This privileged clique knew exactly what was coming and likely made billions trading on their advance knowledge."
Da-da-daaaaahhmmmmmm…🤯
The bad news is: We're not on the "inside", as Gordon Gekko put it, we're on the outside!
The good news is: The sneaky actions of the aforementioned insiders delivered us Disciples of the Candlestick at least some early warning of Thursday-Friday’s major reversal.
I trust you can tell I’m very much joking here 😁!!!
Hey – maybe I’m right about insiders knowing about stuff in advance and trading accordingly… whatever… who knows… we’ll never know… it doesn’t matter because that will never be us… My point is this:
As technical analysts, the reason why something happens is irrelevant – we only care that it is happening.
Yep, we only care about the candles… black, white, upward or downward pointing shadows… and about how those candles impact the broader short term price action… and then how that price action impacts to the short and long term trends. That’s it.
If we’re really lucky, we get more than just a candle’s notice that something's up. Then we can take some steps to manage our risk prior to a move that's significantly at odds with the prevailing trend. Sometimes we’re not that lucky, and we must manage our risk a little later. Importantly, either way, we manage our risk.
Can I say that Tuesday’s candle did look at odds with the prevailing trend. That’s why I brought it to your attention on Wednesday. I trust you'll agree that I significantly escalated my warnings after Thursday’s massive supply-side showing. Unfortunately though, that’s all the notice I could provide this time.
Hey – it could have been worse – many would have looked at Thursday’s net change on the Comp of -7.3 points or just -0.03% as a nothing day… just the usual ebb and flow of US markets… a no-show in an otherwise healthy bull market (i.e. every other market wrap 😉!). At least you were far better forewarned than them!
Ok, I better do some technical analysis on the Comp, and I think you’re way ahead of me here… Big opening gap (i.e., major and sudden shift in demand-supply environment), black body, and low close. If you make that gap part of the candle (use your imagination), the lower shadow becomes very small indeed.
In conclusion, Friday's candle smacks of newly found, and can I say – now confirmed – short term supply-side control.
Yet short and long term trends remain up. This is important too, and we should expect the demand-side to respond sooner rather than later.
If it does, it will do so via long white-bodied candles and or long downward pointing shadows, preferably very quickly. Then all will be good with the Comp's bull market.
If it doesn’t, i.e., we see only very weak demand-side candles from here, or worse – continued supply-side candles (i.e., long black-bodied and or long upward pointing shadows) – then all is not good. This scenario will confirm 21458 as a major point of supply, and we’ll likely see lower peaks from it and possibly the consumption of any latent excess demand within the short term uptrend ribbon/and or at 20507.
I don’t predict – remember – but I prefer to prepare for the second scenario. So, as I suggested in Friday’s update, this means the orderly continuance of these three themes:
Scaling back on long exposure
Perhaps not adding any new long exposure
Being more open to some strategic shorts for protection
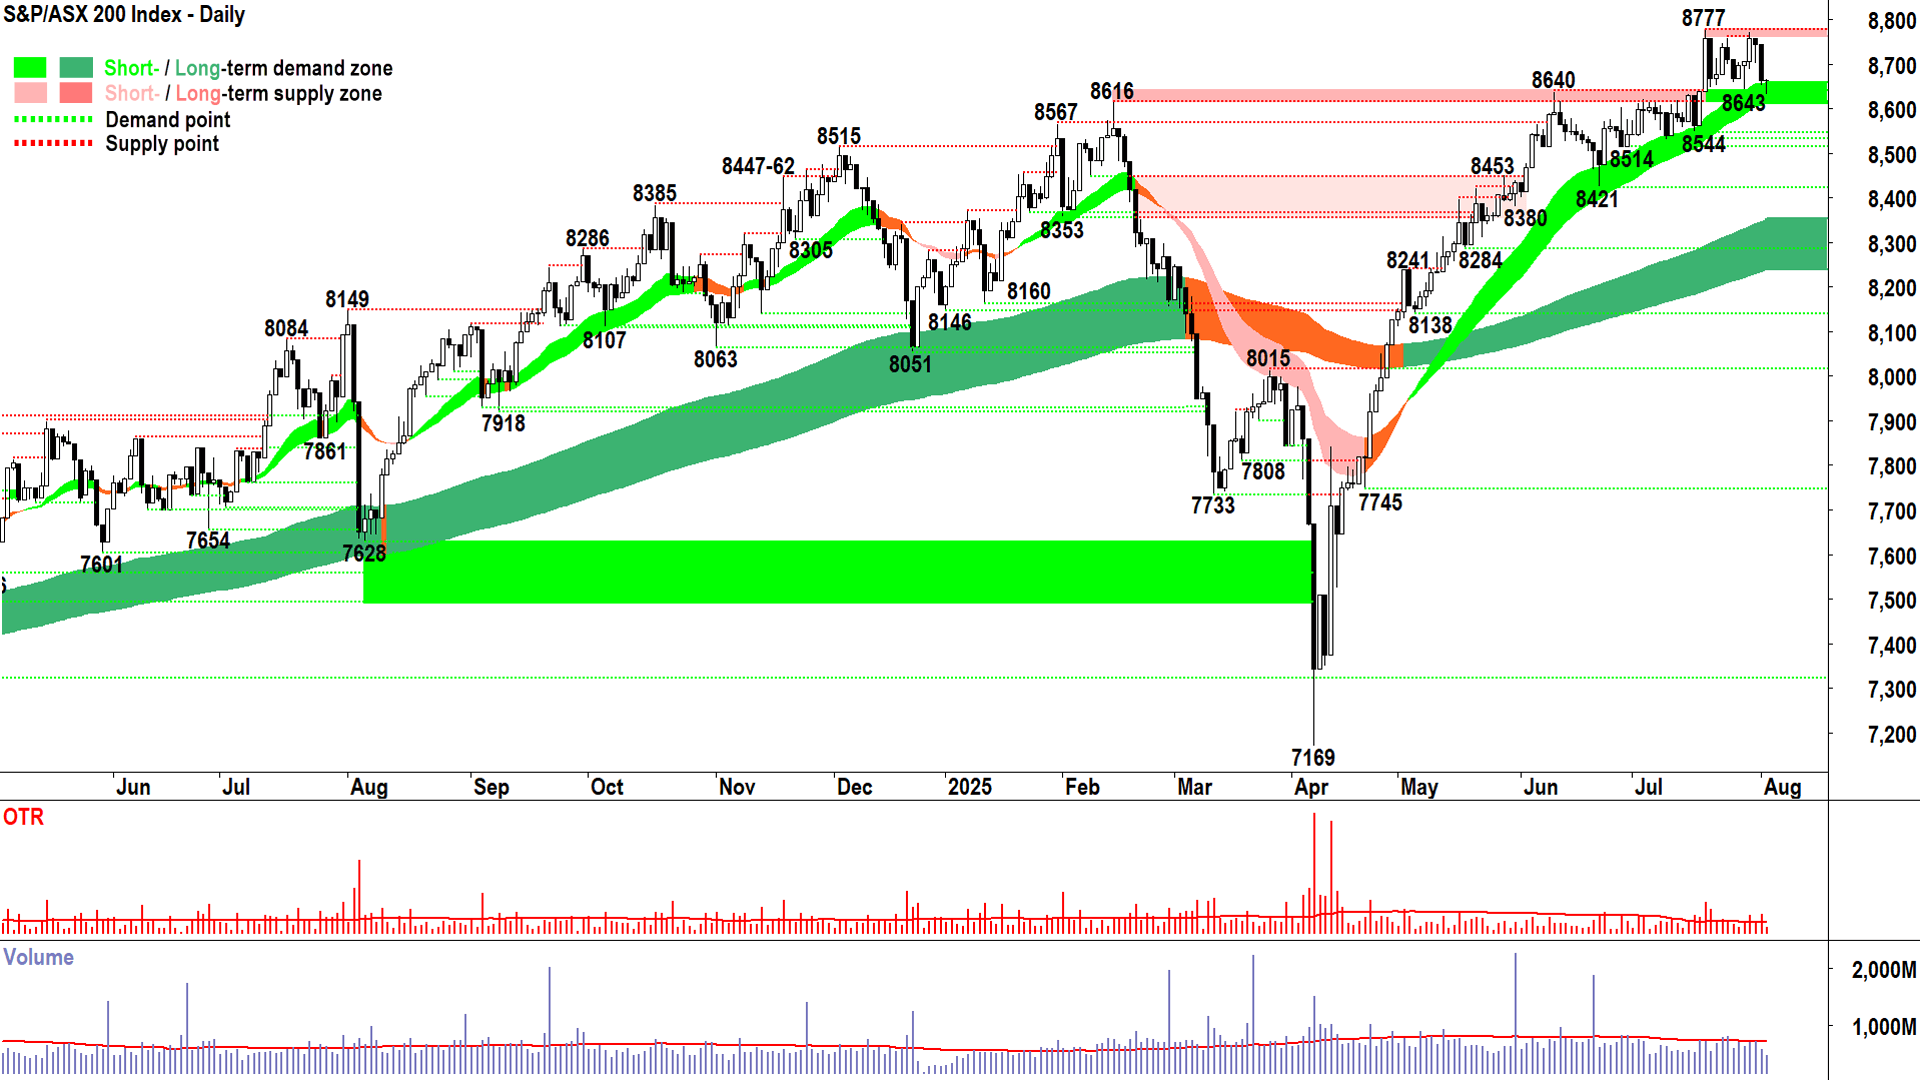
S&P/ASX 200 (XJO)
%20chart%2004%20Aug%202025.png)
Not too shabby (click here for full size image)
Major supply-side candles among the last 5: Comp 3 ❌❌❌ | Tin Pot 1 ❌
Not too shabby. The old Tin Pot has excelled and surprised today. We don’t have the Magnificent 7 or AI juggernauts like NVIDIA. Just a few banks. A few resources. A few supermarkets. Wesfarmers, and Telstra (lists about 90% of the ASX 200’s market cap!).
Still, our motley little crew managed to stave of That Candle – Episode II, i.e., Friday’s big gap and run boil over that followed Thursday’s major warning signal.
Let’s not get too excited here, though. Today’s miniscule-if-we-squint-demand-side-candle is hardly a marker of dominant demand-side control. Merely that the clear excess supply signalled by our Friday candle didn’t follow through. But then, in a sense, doesn’t that lack of follow through imply at least some demand-side control? Right? 🤔
Volumes were scant today – and when considered with price action (or lack thereof) – suggests fund managers didn’t want to commit either way. They’re still trying to figure out whether to dump or hold. Today they went with hold…🤞
I’m suitably impressed by the fact they didn’t respond in a more risk-off fashion given the circumstances. The market was open, they had a chance to bail, they didn’t. It’s a small indication we might muddle through a potentially ongoing US pullback relatively unscathed.
From a technical perspective, let’s see that short term trend ribbon continue to hold, as too with 8643. That would be a (very) good sign (and vice-versa).
Then, dare we say, even show a tidy little cluster of white-bodied / downward pointing shadows over the next few sessions? We can dream…
Clearly, the next candle upstairs on the Comp, and here tomorrow, are going to be critical in setting the trends over the next few days and weeks. Interesting stuff indeed!
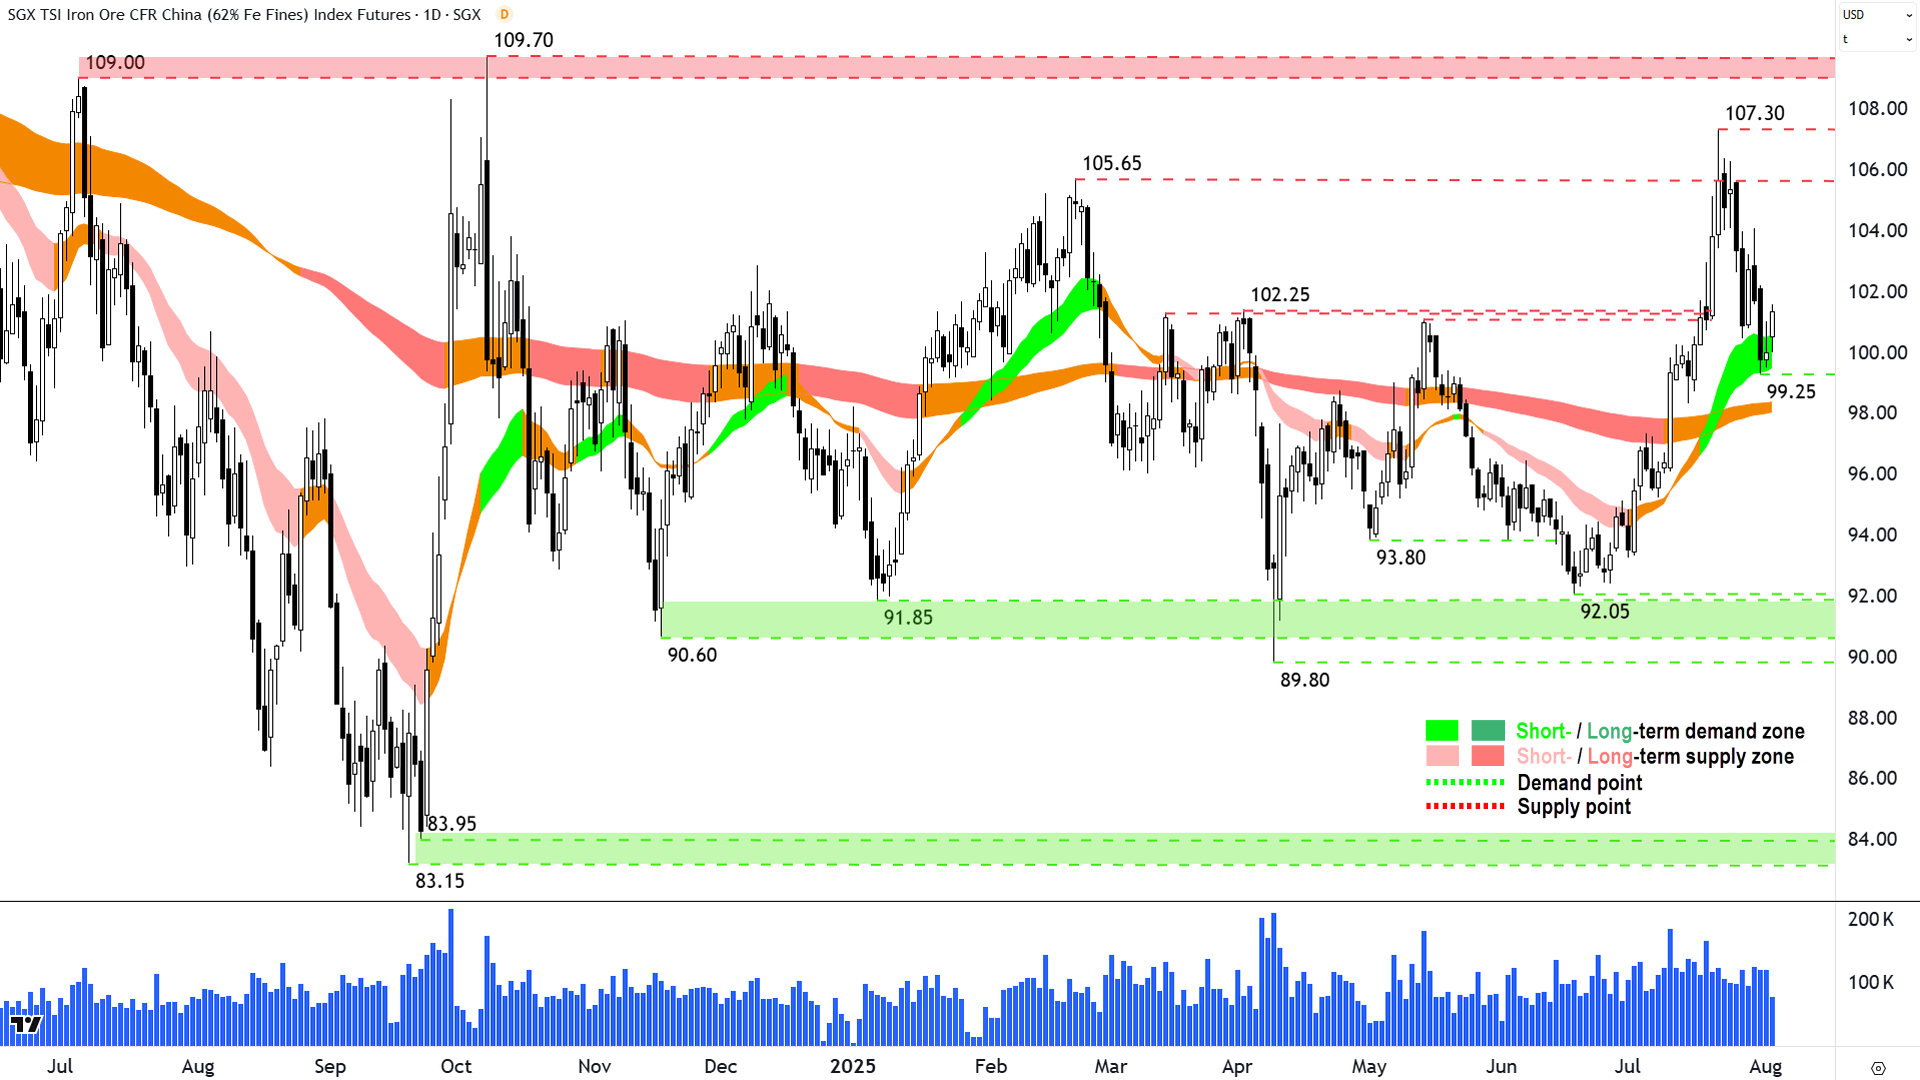
Iron Ore 62% (Front month, back-adjusted) SGX
%20SGX%20chart%2004%20Aug%202025.png)
An impressive recovery (click here for full size image)
Iron ore has staged one of the more impressive recoveries since I went on holiday, facilitating a rally in BHP, RIO and FMG, which I suspect leaked into the prices many other commodity stocks. This contributed to a similarly-impressive rally in the Resources Sector Index (XJR) – which before I left in the last week of June was at serious risk of revisiting the April lows.
%20chart%2004%20Aug%202025.png)
ASX 200 Resources Sector Index (XJR) (click here for full size image)
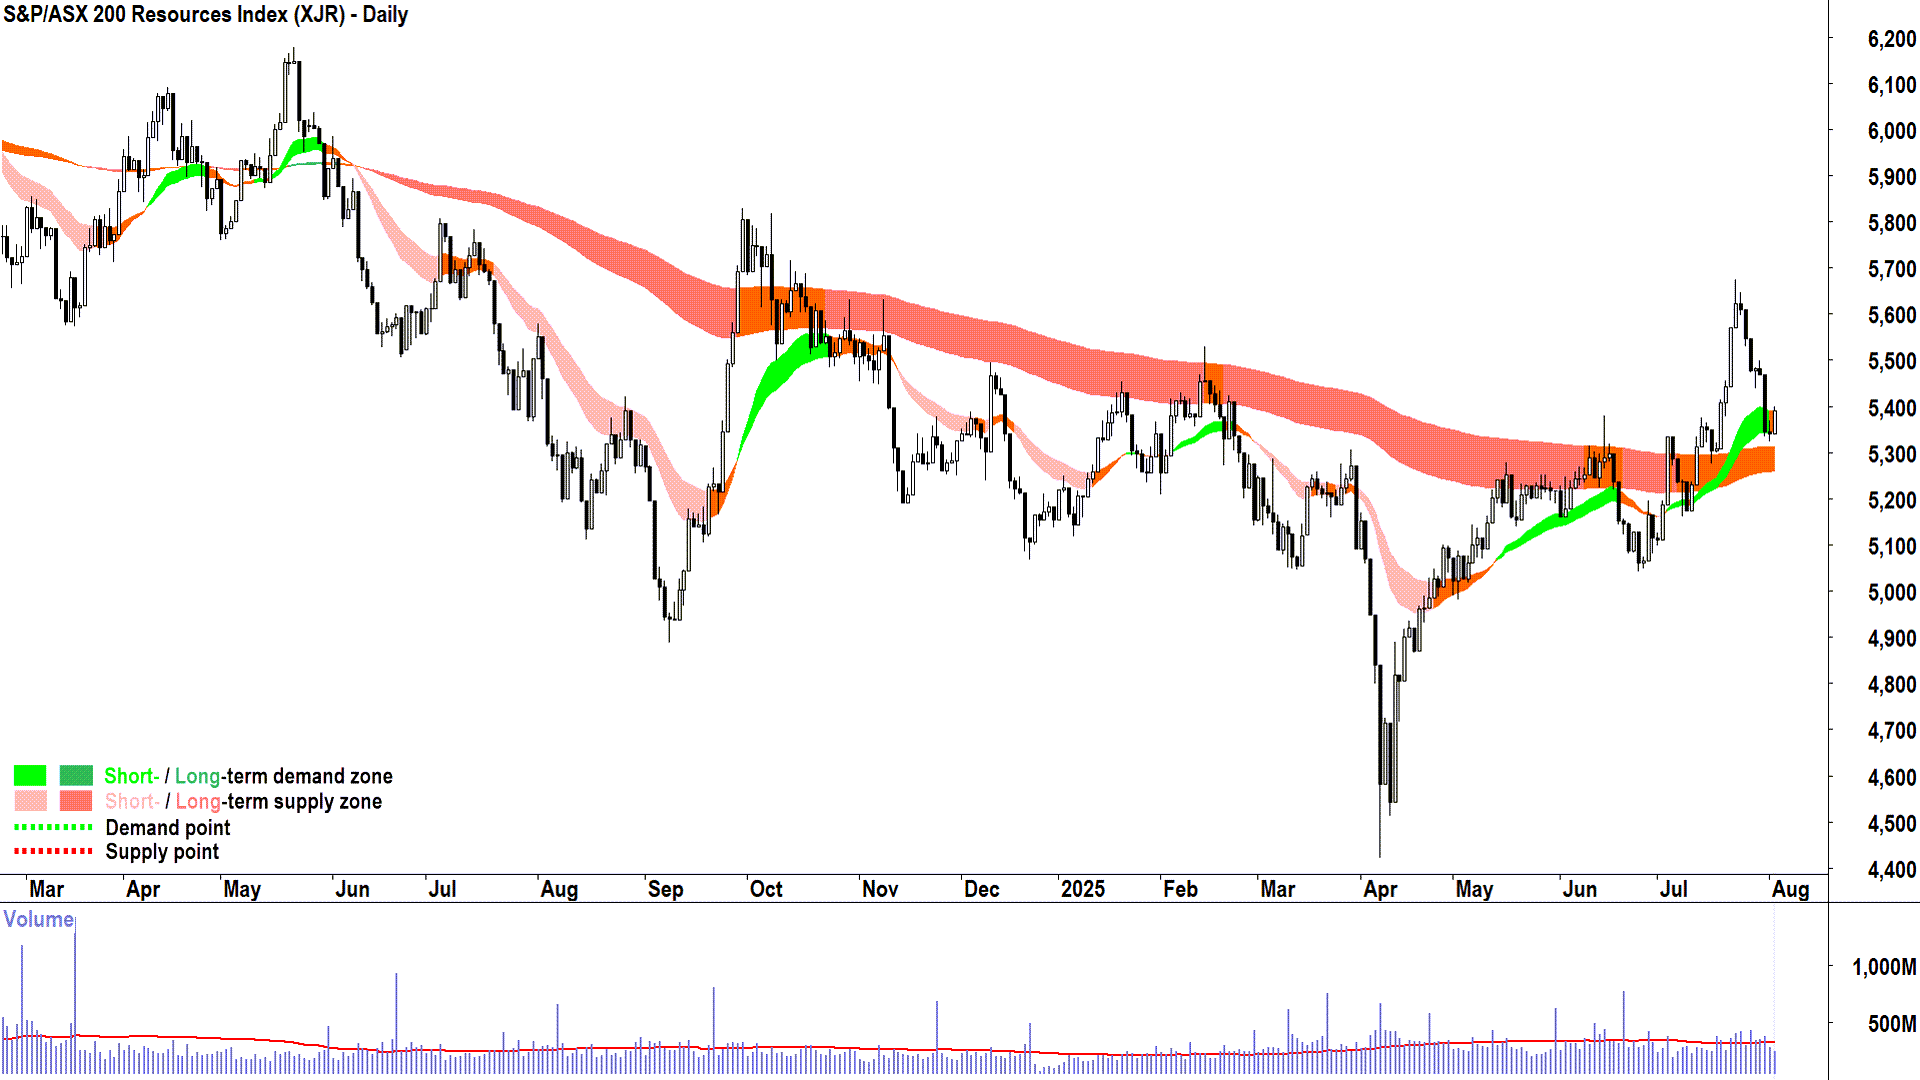
Trends don’t last forever. Nope, they can and do change…
But, despite the iron ore price climbing into a modest new short term uptrend, the long term trend remains neutral – and more broadly – the price remains confined within a well-trodden trading range between 83.15-109.70. We can tighten that to 89.80-105.65 if we like.
Even that last little flurry to 107.30 didn’t last long, and the candles since have been convincingly supply-side in nature. Yet, the short term uptrend ribbon appears to be doing its job – acting as a zone of dynamic demand – with today’s sessions stamping 99.25 as a new trough/point of demand within it. That’s a positive.
So, my view favours neutrality here. Add in we’re almost smack-bang in the middle of the range – a balancing or equilibrium point if you will…
If 99.25 can hold, then we may see 105.65-107.30 revisited, but unlikely much more than that… If 99.25 goes, then the bottom of the range towards 92.05 is likely on the cards, but unlikely much more than that...
Economy
Today
AUS MI Inflation Gauge July
+0.9% m/m vs +0.1% in June
Later this week
Tuesday
11:30 AUS ANZ Job Advertisements July (+1.8% June)
11:45 Caixin Services PMI July (50.4 forecast vs 50.6 June)
Wednesday
00:00 USA ISM Services PMI July (51.5 forecast vs 50.8 June)
Thursday
03:01 USA 10-year Bond Yield (4.36% at 2.6x bid-to-cover in July)
21:00 UK Bank of England (BOE) Monetary Policy Statement and Official Cash Rate (-0.25% to 4.0% forecast)
Friday
03:01 USA 30-year Bond Yield (4.89% at 2.4x bid-to-cover in July)
Saturday
11:30 CHN Consumer Price Index (CPI) and Producer Price Index (PPI) July
CPI: -0.1% p.a. forecast vs +0.1% p.a. in June
PPI: -3.2% p.a. forecast vs -3.6% p.a. previous
Latest News
Interesting Movers
Trading higher
+33.9% Waratah Minerals (WTM) – Multiple zones of high-grade gold extend Spur Gold Corridor and Investor Presentation - Diggers and Dealers.
+26.4% Trigg Minerals (TMG) – No news, general strength across the broader Precious Metals sector today, rise is consistent with prevailing short and long term uptrends 🔎📈
+20.0% Imugene (IMU) – 79% Overall Response Rate With Two Further Partial Responses.
+16.4% 4DMEDICAL (4DX) – Continued positive response to 4DMedical secures $10m strategic investment from Pro Medicus.
+13.0% Amplia Therapeutics (ATX) – No news 🤔.
+12.6% Kingsgate Consolidated (KCN) – Chatree Gold Mine Delivers Record Monthly Production, general strength across the broader Precious Metals sector today.
+11.6% Horizon Minerals (HRZ) – No news since 31-Jul Quarterly Cash Flow Report.
+9.4% Andean Silver (ASL) – No news, general strength across the broader Precious Metals sector today.
+8.9% Catalyst Metals (CYL) – Trident's Indicated Resource doubles, general strength across the broader Precious Metals sector today, bounced perfectly from long term uptrend ribbon! 🔎📈
+8.0% Meteoric Resources (MEI) – No news, today’s move is consistent with recent volatility.
+7.9% Sun Silver (SS1) – No news, general strength across the broader Precious Metals sector today, today’s move is consistent with recent volatility.
+7.7% St Barbara (SBM) – No news, general strength across the broader Precious Metals sector today.
+6.8% Pantoro (PNR) – No news, general strength across the broader Precious Metals sector today, rise is consistent with prevailing short and long term uptrends 🔎📈
+6.8% Vault Minerals (VAU) – Diggers and Dealers Presentation and Encouraging drilling results from Leonora & Sugar Zone, general strength across the broader Precious Metals sector today.
+6.5% WA1 Resources (WA1) – Luni Niobium Project - Metallurgical Results, rise is consistent with prevailing long term uptrend 🔎📈
+6.5% Bellevue Gold (BGL) – Becoming a substantial holder, general strength across the broader Precious Metals sector today.
+5.6% Northern Star Resources (NST) – Investor Presentation - KCGM Site Visit, general strength across the broader Precious Metals sector today.
+5.6% Syrah Resources (SYR) – No news, bounced in the wake of the recent sharp selloff.
+5.3% Benz Mining Corp. (BNZ) – 200m Intercepts Support Emergence of Major Gold System, general strength across the broader Precious Metals sector today, rise is consistent with prevailing short and long term uptrends 🔎📈
+4.4% Ramelius Resources (RMS) – Diggers and Dealers Company presentation, general strength across the broader Precious Metals sector today.
+4.1% Resolute Mining (RSG) – No news, general strength across the broader Precious Metals sector today.
+4.1% Lynas Rare Earths (LYC) – No news, rise is consistent with prevailing short and long term uptrends, a regular in ChartWatch ASX Scans Uptrends list 🔎📈
+4.0% Ricegrowers (SGL) – No news, rise is consistent with prevailing short and long term uptrends, a regular in ChartWatch ASX Scans Uptrends list 🔎📈
+3.9% Droneshield (DRO) – No news, rise is consistent with prevailing short and long term uptrends, a regular in ChartWatch ASX Scans Uptrends list 🔎📈
Trading lower
-12.6% Digitalx (DCC) – Response to ASX Query Letter (plus weaker crypto prices late last week).
-7.6% The Star Entertainment Group (SGR) – Continued negative response to 01-Aug Termination of Heads of Agreement - DBC & DGCC, fall is consistent with prevailing short and long term downtrends, one of the most Featured (highest conviction) stocks in ChartWatch ASX Scans Downtrends list 🔎📉
-7.5% St George Mining (SGQ) – Proposed issue of securities.
-4.6% Gentrack Group (GTK) – No news, fall is consistent with prevailing short term downtrend and long term trend is transitioning from up to down 🔎📉
-4.5% VGI Partners Global Investments (VG1) – Weekly NTA Update.
-4.3% Strike Energy (STX) – Board Changes Following Strategic Investment, fall is consistent with prevailing short and long term downtrends, a regular in ChartWatch ASX Scans Downtrends list 🔎📉
-4.2% BetaShares Crypto Innovators ETF (CRY) – No news, Crypto ETF (major crypto’s were lower late last week).
-4.0% Block (XYZ) – No news, general weakness across the broader Information Technology sector today.
Broker Moves
Ampol (ALD)
Retained at Overweight at Morgan Stanley; Price Target: $30.00
Aristocrat Leisure (ALL)
Retained at Positive at E&P; Price Target: $74.43 from $75.82
Aspen Group (APZ)
Retained at Buy at Bell Potter; Price Target: $3.90
AVJennings (AVJ)
Retained at Hold at Bell Potter; Price Target: $0.66
Antipa Minerals (AZY)
Retained at Speculative Buy at Canaccord Genuity; Price Target: $1.04
BETR Entertainment (BBT)
Retained at Buy at Morgans; Price Target: $0.38 from $0.47
Bellevue Gold (BGL)
Retained at Speculative Buy at Canaccord Genuity; Price Target: $1.65 from $1.75
BHP Group (BHP)
Retained at Overweight at Morgan Stanley; Price Target: $43.50 from $48.35
Beach Energy (BPT)
Retained at Hold at Canaccord Genuity; Price Target: $1.26 from $1.30
Breville Group (BRG)
Retained at Accumulate at Ord Minnett; Price Target: $35.00
Beetaloo Energy Australia (BTL)
Retained at Speculative Buy at Morgans; Price Target: $0.71 from $0.73
Centuria Industrial REIT (CIP)
Retained at Buy at Bell Potter; Price Target: $3.35
Centuria Capital Group (CNI)
Retained at Hold at Bell Potter; Price Target: $1.80
Centuria Office REIT (COF)
Retained at Sell at Bell Potter; Price Target: $1.10
Comet Ridge (COI)
Retained at Speculative Buy at Morgans; Price Target: $0.25 from $0.23
Capstone Copper Corp. (CSC)
Retained at Buy at Morgans; Price Target: $12.10 from $11.50
CSL (CSL)
Retained at Overweight at Morgan Stanley; Price Target: $303.00
Cedar Woods Properties (CWP)
Retained at Buy at Bell Potter; Price Target: $8.00
Digico Infrastructure REIT (DGT)
Retained at Hold at Bell Potter; Price Target: $3.40
Duratec (DUR)
Retained at Accumulate at Ord Minnett; Price Target: $1.80 from $1.72
Dexus Convenience Retail REIT (DXC)
Retained at Buy at Bell Potter; Price Target: $3.30
Dexus Industria REIT (DXI)
Retained at Hold at Bell Potter; Price Target: $2.95
Electro Optic Systems Holdings (EOS)
Retained at Buy at Bell Potter; Price Target: $3.75 from $3.10
Upgraded to Buy at Canaccord Genuity; Price Target: $3.30 from $3.00
GDI Property Group (GDI)
Retained at Buy at Bell Potter; Price Target: $0.80
Goodman Group (GMG)
Retained at Buy at Bell Potter; Price Target: $39.35 from $39.25
HealthCo Healthcare and Wellness REIT (HCW)
Retained at Buy at Bell Potter; Price Target: $1.15
HomeCo Daily Needs REIT (HDN)
Retained at Hold at Bell Potter; Price Target: $1.35
HMC Capital (HMC)
Retained at Buy at Bell Potter; Price Target: $8.15
IGO (IGO)
Retained at Underweight at Morgan Stanley; Price Target: $4.10 from $3.45
Iluka Resources (ILU)
Retained at Overweight at Morgan Stanley; Price Target: $5.55 from $6.15
Intelligent Monitoring Group (IMB)
Retained at Buy at Canaccord Genuity; Price Target: $1.00
ioneer (INR)
Retained at Speculative Buy at Ord Minnett; Price Target: $0.19
Karoon Energy (KAR)
Downgraded to Equal weight from Overweight at Morgan Stanley; Price Target: $1.80
Upgraded to Overweight from Equal-weight at Morgan Stanley; Price Target: $1.80
Lifestyle Communities (LIC)
Retained at Hold at Bell Potter; Price Target: $5.00
Light & Wonder Inc. (LNW)
Retained at Positive at E&P; Price Target: $247.00 from $254.00
Lynas Rare Earths (LYC)
Upgraded to Hold from Sell at Ord Minnett; Price Target: $10.80 from $7.80
Meteoric Resources NL (MEI)
Retained at Speculative Buy at Ord Minnett; Price Target: $0.20
Newmont Corporation (NEM)
Retained at Accumulate at Morgans; Price Target: $107.00 from $103.00
Noumi (NOU)
Retained at Buy at Bell Potter; Price Target: $0.19 from $0.18
Retained at Buy at Bell Potter; Price Target: $0.18 from $0.24
Northern Star Resources (NST)
Retained at Hold at Ord Minnett; Price Target: $17.30 from $17.20
Northern Minerals (NTU)
Retained at Speculative Buy at Ord Minnett; Price Target: $0.04
Origin Energy (ORG)
Retained at Neutral at JPMorgan; Price Target: $10.75 from $10.50
Retained at Underweight at Morgan Stanley; Price Target: $9.80 from $9.46
Downgraded to Sector Perform from Outperform at RBC Capital Markets; Price Target: $12.00 from $11.00
Paladin Energy (PDN)
Retained at Equal weight at Morgan Stanley; Price Target: $7.30 from $4.60
Pilbara Minerals (PLS)
Retained at Overweight at Morgan Stanley; Price Target: $1.85 from $1.80
Retained at Sell at Ord Minnett; Price Target: $1.20 from $1.15
PEXA Group (PXA)
Upgraded to Overweight from Neutral at Jarden; Price Target: $17.75 from $16.20
QBE Insurance Group (QBE)
Retained at Hold at Bell Potter; Price Target: $21.40 from $21.00
Region Group (RGN)
Retained at Buy at Bell Potter; Price Target: $2.65
Rio Tinto (RIO)
Retained at Sector Perform at RBC Capital Markets; Price Target: $115.00 from $110.00
ResMed Inc. (RMD)
Retained at Buy at Citi; Price Target: $49.00 from $45.00
Downgraded to Hold from Outperform at CLSA; Price Target: $46.00 from $44.50
Retained at Overweight at Morgan Stanley; Price Target: $298.00 from $291.00
Retained at Buy at Ord Minnett; Price Target: $48.80 from $45.60
South32 (S32)
Retained at Overweight at Morgan Stanley; Price Target: $3.45 from $3.15
Stockland (SGP)
Retained at Overweight at Morgan Stanley; Price Target: $6.75
Sigma Healthcare (SIG)
Initiated at Sell at Bell Potter; Price Target: $2.00
Silex Systems (SLX)
Retained at Speculative Buy at Canaccord Genuity; Price Target: $6.46
Santos (STO)
Retained at Equal-weight at Morgan Stanley; Price Target: $8.88
Retained at Accumulate at Ord Minnett; Price Target: $8.89
Summit Minerals (SUM)
Retained at Buy at Bell Potter; Price Target: $15.10 from $14.30
Telstra Group (TLS)
Retained at Overweight at Morgan Stanley; Price Target: $5.00
Viva Energy Group (VEA)
Retained at Equal-weight at Morgan Stanley; Price Target: $2.11 from $2.16
Woodside Energy Group (WDS)
Downgraded to Equal-weight from Overweight at Morgan Stanley; Price Target: $27.00
Upgraded to Overweight from Equal-weight at Morgan Stanley; Price Target: $27.00 from $26.00
Scans
Top Gainers
Code | Company | Last | % Chg |
|---|---|---|---|
| EDEDA | Eden Innovations Ltd | $0.048 | +118.18% |
| AIV | Activex Ltd | $0.016 | +60.00% |
| LM1 | Leeuwin Metals Ltd | $0.15 | +51.52% |
| TMB | Tambourah Metals | $0.036 | +38.46% |
| WTM | Waratah Minerals Ltd | $0.395 | +33.90% |
Top Fallers
Code | Company | Last | % Chg |
|---|---|---|---|
| PNN | Power Minerals Ltd | $0.06 | -23.08% |
| ATV | Activeport Group Ltd | $0.011 | -21.43% |
| MEG | Megado Minerals Ltd | $0.032 | -20.00% |
| KNB | Koonenberry Gold Ltd | $0.039 | -17.90% |
| SVY | Stavely Minerals Ltd | $0.014 | -17.65% |
52 Week Highs
Code | Company | Last | % Chg |
|---|---|---|---|
| EDEDA | Eden Innovations Ltd | $0.048 | +118.18% |
| LKY | Locksley Resources Ltd | $0.185 | +32.14% |
| PIM | Pinnacle Minerals Ltd | $0.083 | +27.69% |
| TMG | Trigg Minerals Ltd | $0.11 | +26.44% |
| CCE | Carnegie Clean Energy Ltd | $0.066 | +22.22% |
52 Week Lows
Code | Company | Last | % Chg |
|---|---|---|---|
| IOD | Iodm Ltd | $0.10 | -16.67% |
| VHL | Vitasora Health Ltd | $0.025 | -10.71% |
| CDX | Cardiex Ltd | $0.031 | -8.82% |
| SGR | The Star Entertainment Group Ltd | $0.085 | -7.61% |
| CTE | Cryosite Ltd | $0.70 | -6.67% |
Near Highs
Code | Company | Last | % Chg |
|---|---|---|---|
| WVOL | Ishares MSCI World Ex Aust Minimum Volatility ETF | $43.24 | -0.48% |
| GCI | Gryphon Capital Income Trust | $2.07 | 0.00% |
| IHD | Ishares S&P/ASX DIV Opportunities Esg Screened ETF | $15.16 | -0.20% |
| MGX | Mount Gibson Iron Ltd | $0.385 | -1.28% |
| CNEW | Vaneck China New Economy ETF | $7.58 | +0.66% |
Relative Strength Index (RSI) Oversold
Code | Company | Last | % Chg |
|---|---|---|---|
| MHK | Metal Hawk Ltd | $0.185 | +5.71% |
| BOE | Boss Energy Ltd | $1.68 | -1.47% |
| SHV | Select Harvests Ltd | $3.43 | +1.18% |
| LSGE | Loomis Sayles Global Equity Fund - Active ETF | $2.36 | -1.26% |
| BAP | Bapcor Ltd | $3.78 | -0.26% |
