
The ASX 200 fell sharply as the AI trade unwound on Wall Street overnight, hammering local commodity stocks tied to it. Miners led the losses, while defensive utilities and beaten-down software stocks found support.
Be sure to click/scroll through for the usual reporting of the major sector and stock-specific moves, the broker responses to them, as well as all the key economic data in tonight's Evening Wrap. Also, I have detailed technical analysis on the Nasdaq Composite and the S&P/ASX 200 in today's ChartWatch.
Let’s dive in!
Today in Review
Name | Value | % Chg |
|---|---|---|
Major Indices | ||
| ASX 200 | 8,883.2 | -1.79% |
| All Ords | 8,997.3 | -1.83% |
| Small Ords | 3,144.0 | -2.30% |
| All Tech | 3,030.4 | -1.10% |
| Emerging Companies | 2,734.1 | -1.22% |
Currency | ||
| AUD/USD | 0.6745 | +0.12% |
US Futures | ||
| S&P 500 | 7,432.25 | -0.09% |
| Dow Jones | 51,527.0 | -0.28% |
| Nasdaq | 27,329.75 | +0.17% |
Name | Value | % Chg |
|---|---|---|
Sector | ||
| Utilities | 10,959.4 | +1.52% |
| Information Technology | 1,836.1 | -0.31% |
| Consumer Staples | 13,707.9 | -0.59% |
| Industrials | 8,556.9 | -0.69% |
| Health Care | 35,024.6 | -0.73% |
| Real Estate | 3,502.2 | -0.96% |
| Communication Services | 1,644.4 | -1.17% |
| Financials | 9,709.9 | -1.34% |
| Consumer Discretionary | 3,743.7 | -1.78% |
| Energy | 10,161.6 | -1.87% |
| Materials | 21,548.2 | -3.86% |
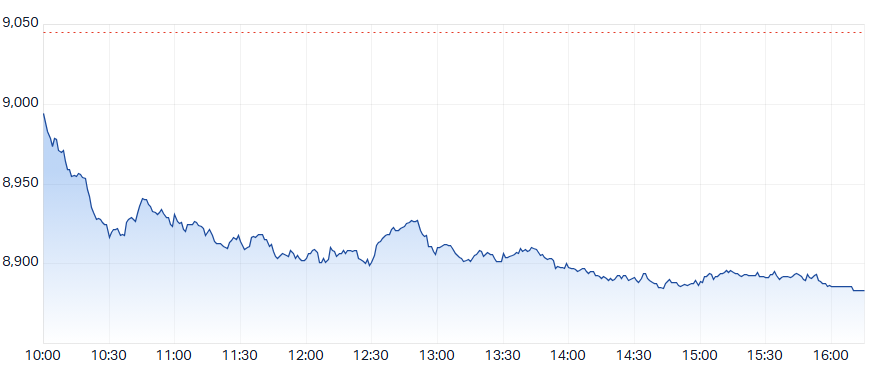
ASX 200 Intraday Chart
Markets
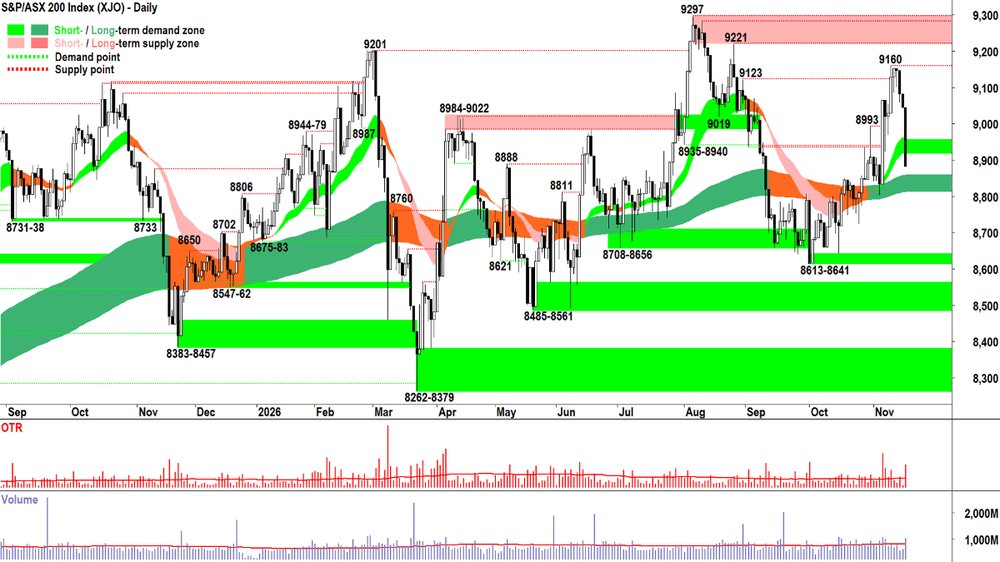
The S&P/ASX 200 (XJO) finished points lower at 8,883.2, 1.8% from its session high and smack–bang on its session low. In the broader-based S&P/ASX 300 (XKO) the damage was clear: advancers lagged decliners by a near-unanimous 27 to 261.
Utilities (XUJ) (+1.5%) was the only sector to rise, as investors went looking for defensive exposure: companies with steady earnings that tend to hold up when markets turn risk-off. Energy utilities, energy infrastructure owners... Mercury NZ (MCY) (+2.6%) and APA Group (APA) (+1.8%) led the gains. Origin Energy (ORG) (+1.6%), Meridian Energy (MEZ) (+1.1%) and AGL Energy (AGL) (+0.4%) were also solid.
Information Technology (XIJ) (-0.3%) was the fascinating exception, given the rout in US tech overnight. Local tech stocks had been savaged by the “SaaSpocalypse”, the fear that AI would undermine their business models. As the AI trade unwinds, capital is flowing back into these beaten-down names. Technology One (TNE) (+8.9%) rallied after reporting a 19% jump in full-year profit, and Xero (XRO) (+2.4%) also rose. Life360 (360) (+0.7%) edged higher, while WiseTech Global (WTC) (-0.2%) slipped only marginally.
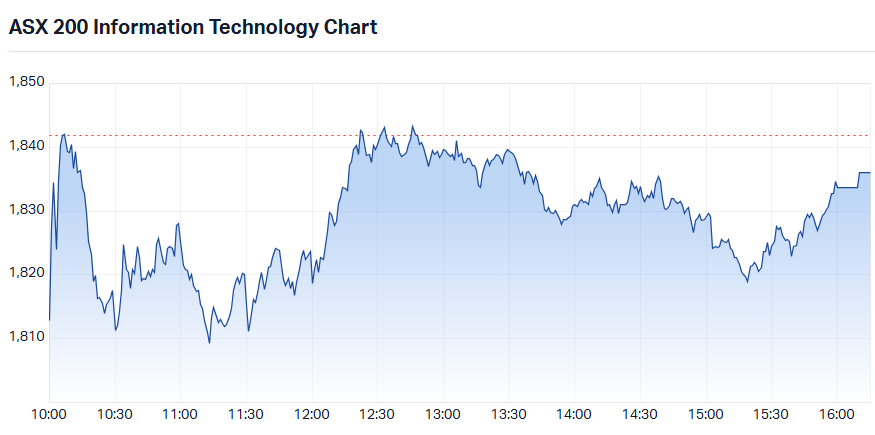
S&P/ASX 200 Information Technology Sector Index (XIJ) intraday chart
Consumer Staples (XSJ) (-0.6%) was among the defensive sectors that declined the least. Metcash (MTS) (+0.3%) and Elders (ELD) (+0.1%) edged higher, while Woolworths Group (WOW) (-0.4%) eased.
Health Care (XHJ) (-0.7%) also held up better than the broader market. Mayne Pharma Group (MYX) (+87.2%) rocketed after receiving a $604 million takeover bid from Hungarian drug maker Gedeon Richter. Healius (HLS) (+3.4%) also rallied, while stalwarts Cochlear (COH) (+1.1%) and ResMed (RMD) (+1.1%) rose.
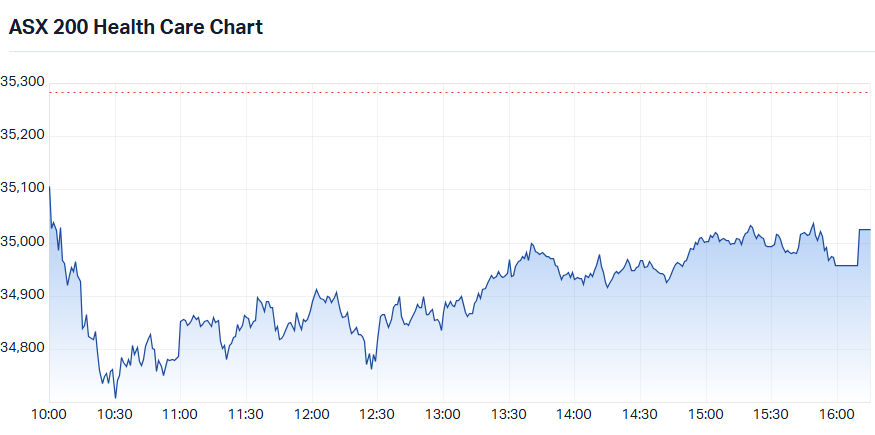
S&P/ASX 200 Health Care Sector Index (XHJ) intraday chart
Consumer Discretionary (XDJ) (-1.8%) fell on the broad risk-off tone. It also took a hit from RBA governor Michele Bullock, who confirmed the Board’s ongoing vigilance in fighting local inflation. Markets took that as a hawkish reminder, because economists had generally tempered their calls for further rate hikes after the November Board meeting. More hikes would leave households with less to spend. Lovisa Holdings (LOV) (-3.5%), Temple & Webster Group (TPW) (-3.4%) and Corporate Travel Management (CTD) (-3.2%) were notable losers.
Financials (XFJ) (-1.3%) beat the broader market, but only modestly. Fund managers crumbled as global stock markets swooned. Their fees are tied to the value of the assets they manage, so falling markets hit their revenue directly. MA Financial Group (MAF) (-9.4%) and GQG Partners (GQG) (-7.6%) led the losses, while Regal Partners (RPL) (-5.9%) also fell.
The big banks didn’t play their usual anchor role. National Australia Bank (NAB) (-2.8%) was the heaviest drag, followed by Westpac Banking Corporation (WBC) (-1.4%). ANZ Group Holdings (ANZ) (-0.8%) eased, while Commonwealth Bank of Australia (CBA) (-0.4%) was notably resolute.
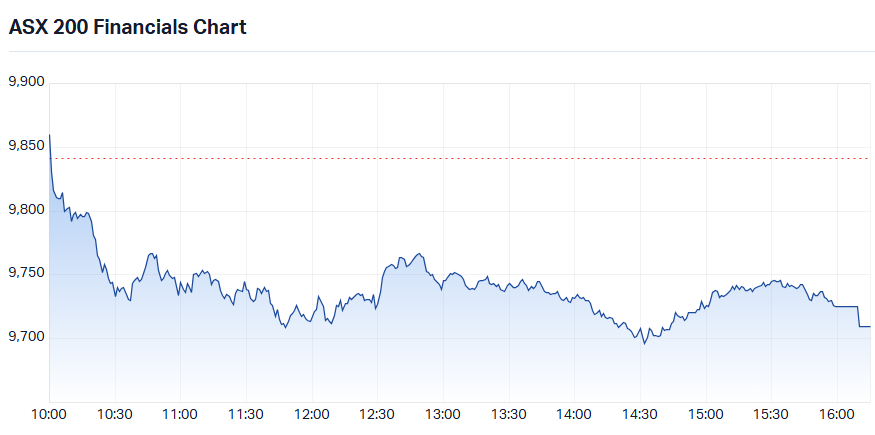
S&P/ASX 200 Financials Sector Index (XFJ) intraday chart
Energy (XEJ) (-1.9%) got a clear signal from commodity prices, with both coal and oil lower. Newcastle coal futures on globalCoal fell 1.9% to US$144.10/t in Asian trade, and coal miners were heavily sold. New Hope Corporation (NHC) (-7.1%) and Whitehaven Coal (WHC) (-7.0%) led the losses, while Yancoal Australia (YAL) (-5.1%) also fell.
ICE Brent crude futures slipped 0.6% to US$91.88/bbl in Asian trade. There were signs that supply is starting to outpace demand, and US Vice President JD Vance signalled Washington wants to avoid a prolonged war with Iran. Santos (STO) (-1.7%) and Woodside Energy Group (WDS) (-1.6%) eased.
Materials (XMJ) (-3.9%) was the worst-performing sector as the AI trade unwound on Wall Street. The Nasdaq tumbled 2.5% overnight, led by a 4% slide in Nvidia. Local stocks tied to the commodities behind the AI build-out were sold hard: copper, rare earths, lithium and uranium. The catch? Actual commodity price falls were modest, and in some cases didn’t happen at all...
Rare earths stocks copped some of the heaviest selling, even though NdPr prices in China edged 0.2% higher to CNY 718,000/t. Lynas Rare Earths (LYC) (-8.2%) and Iluka Resources (ILU) (-7.0%) led the declines.
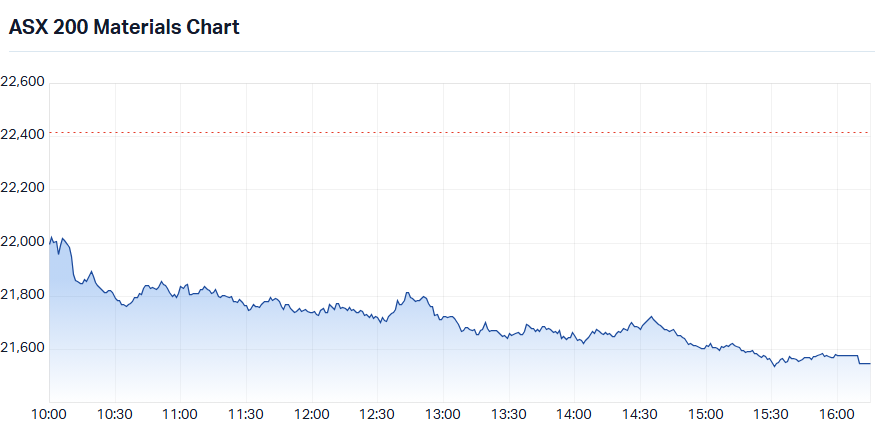
S&P/ASX 200 Materials Sector Index (XMJ) intraday chart
Iron ore stocks fell far harder than the commodity itself: SGX iron ore futures eased only 0.6% to US$87.65/t in Asian trade — yet Mineral Resources (MIN) (-8.4%), Champion Iron (CIA) (-7.8%) and Fortescue (FMG) (-5.5%) were dumped. Among the majors, BHP Group (BHP) (-4.9%) was the heavier drag, while Rio Tinto (RIO) (-2.1%) held up better.
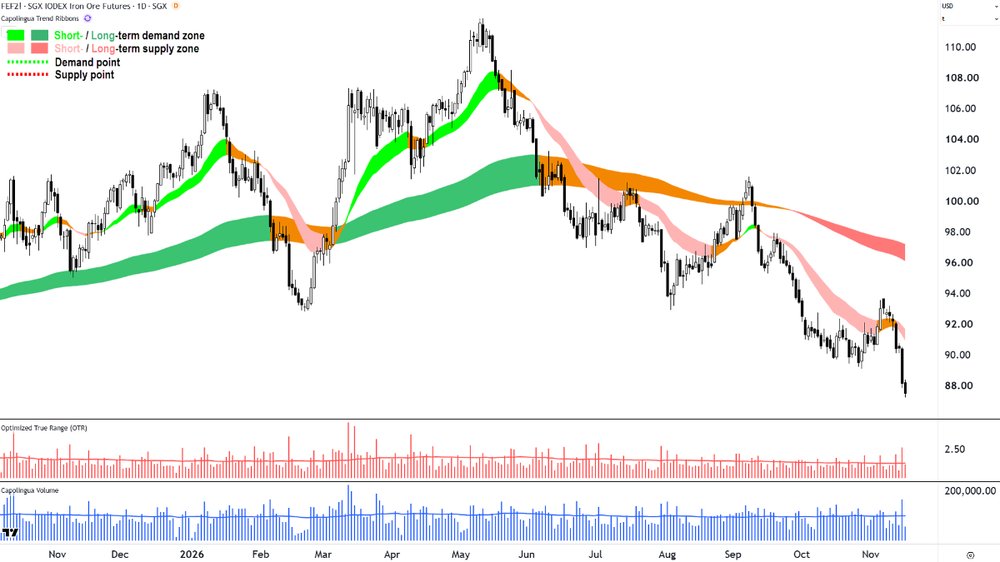
Iron Ore 62% (Front month, back-adjusted) SGX
Copper, a key material in data centres, hit a four-month low in London overnight, falling 1.7%. COMEX copper futures slipped a further 0.1% to US$6.004/lb in Asian trade after a 1.4% overnight slide. Sandfire Resources (SFR) (-5.7%) fell, and Capstone Copper (CSC) (-6.8%) extended the previous session’s sell-off. Elsewhere in base metals, Nickel Industries (NIC) (-6.3%) and South32 (S32) (-3.6%) also fell.
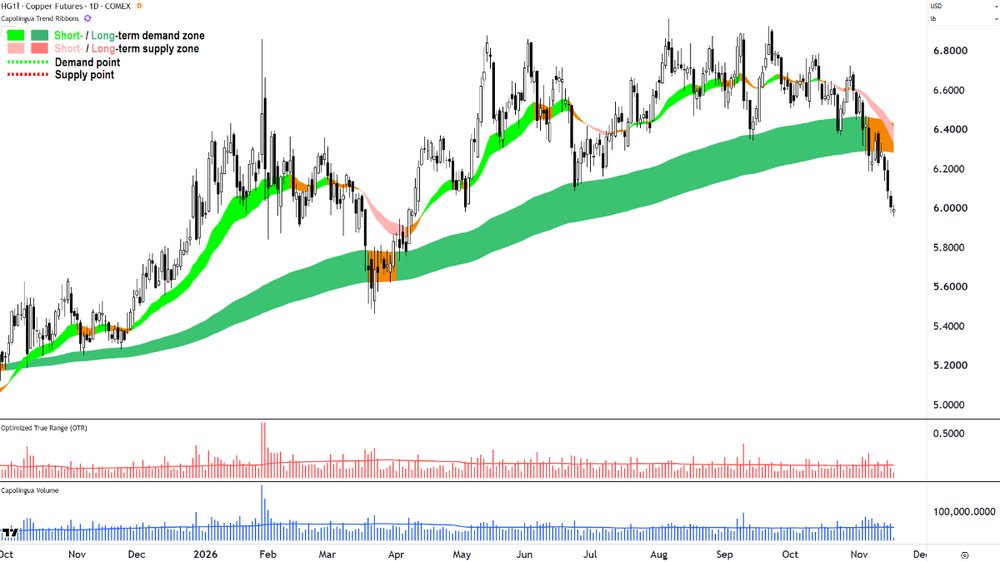
High Grade Copper Futures (Front month, back-adjusted) COMEX
In other commodities moves, lithium stocks followed the broader materials sector lower, though their weakness started a couple of months before this sell-off. GFEX lithium carbonate futures in China actually rose 1.0% to CNY 89,160/t in Asian trade. It didn't help the likes of PLS Group (PLS) (-8.7%), Elevra Lithium (ELV) (-6.5%) and Liontown (LTR) (-6.3%), though, with IGO (IGO) (-5.9%) and Core Lithium (CXO) (-4.2%) also lower.
Uranium stocks told a similar story, with COMEX uranium futures edging 0.1% higher to US$90.30/lb in Asian trade. Stocks fell much harder, in line with sentiment. Deep Yellow (DYL) (-4.7%) and NexGen Energy (NXG) (-4.0%) led the declines, Paladin Energy (PDN) (-3.7%) and Boss Energy (BOE) (-2.1%) followed.
Today's best ASX Top 300 gainers
Company | Last Price | Change $ | Change % | 1mo % | 1yr % |
|---|---|---|---|---|---|
| Technology One (TNE) | $35.15 | +$2.86 | +8.9% | +10.2% | -0.5% |
| Bellevue Gold (BGL) | $1.41 | +$0.04 | +2.9% | -3.1% | +12.8% |
| Heartland Group Holdings (HGH) | $1.065 | +$0.028 | +2.7% | +6.5% | +14.5% |
| Mercury NZ (MCY) | $5.62 | +$0.14 | +2.6% | +3.1% | -0.7% |
| Xero (XRO) | $82.48 | +$1.92 | +2.4% | +33.5% | -32.5% |
| APA Group (APA) | $11.45 | +$0.20 | +1.8% | +2.0% | +23.5% |
| Ampol (ALD) | $38.13 | +$0.62 | +1.7% | -11.3% | +19.0% |
| Origin Energy (ORG) | $12.56 | +$0.20 | +1.6% | +4.1% | +3.8% |
| Wagners Holding Company (WGN) | $4.57 | +$0.07 | +1.6% | -1.5% | +30.2% |
| Regis Resources (RRL) | $6.67 | +$0.10 | +1.5% | -6.1% | -2.5% |
| Latitude Group Holdings (LFS) | $0.85 | +$0.01 | +1.2% | +9.7% | -23.1% |
| Cochlear (COH) | $152.56 | +$1.73 | +1.1% | +16.3% | -44.1% |
| ResMed Inc. (RMD) | $35.59 | +$0.39 | +1.1% | +3.6% | -5.2% |
| Australian Agricultural Company (AAC) | $1.37 | +$0.015 | +1.1% | +5.0% | -6.2% |
| Channel Infrastructure NZ (CHI) | $2.75 | +$0.03 | +1.1% | -1.8% | +8.7% |
| Viva Energy Group (VEA) | $2.80 | +$0.03 | +1.1% | -9.7% | +43.6% |
| Meridian Energy (MEZ) | $4.73 | +$0.05 | +1.1% | +4.2% | -8.7% |
| Dexus (DXS) | $6.11 | +$0.06 | +1.0% | +7.4% | -14.8% |
| Storage King Group (SKG) | $1.17 | +$0.01 | +0.9% | +12.0% | -14.9% |
| Smartgroup Corporation (SIQ) | $10.88 | +$0.09 | +0.8% | -6.0% | +31.4% |
Today's worst ASX Top 300 losers
Company | Last Price | Change $ | Change % | 1mo % | 1yr % |
|---|---|---|---|---|---|
| Catapult Sports (CAT) | $3.02 | -$0.60 | -16.6% | -5.9% | -44.7% |
| IPH (IPH) | $3.42 | -$0.53 | -13.4% | -1.4% | -5.8% |
| Sunrise Energy Metals (SRL) | $10.76 | -$1.33 | -11.0% | -31.6% | +131.4% |
| MA Financial Group (MAF) | $4.22 | -$0.44 | -9.4% | -9.6% | -56.4% |
| MAAS Group Holdings (MGH) | $3.50 | -$0.36 | -9.3% | -7.9% | -18.2% |
| PLS Group (PLS) | $2.64 | -$0.25 | -8.7% | -11.4% | -33.3% |
| Mineral Resources (MIN) | $41.83 | -$3.86 | -8.4% | -6.4% | -16.4% |
| Lynas Rare Earths (LYC) | $12.03 | -$1.08 | -8.2% | +8.7% | -19.6% |
| FireFly Metals (FFM) | $1.25 | -$0.11 | -8.1% | -11.0% | -29.1% |
| Codan (CDA) | $49.52 | -$4.29 | -8.0% | -21.3% | +56.0% |
| Champion Iron (CIA) | $1.825 | -$0.155 | -7.8% | -23.3% | -65.8% |
| LendLease Group (LLC) | $2.07 | -$0.17 | -7.6% | -13.4% | -62.3% |
| GQG Partners Inc. (GQG) | $0.61 | -$0.05 | -7.6% | -42.7% | -57.6% |
| New Hope Corporation (NHC) | $4.57 | -$0.35 | -7.1% | -21.7% | +9.1% |
| Iluka Resources (ILU) | $5.47 | -$0.41 | -7.0% | +2.6% | -20.4% |
| Whitehaven Coal (WHC) | $6.68 | -$0.50 | -7.0% | -11.4% | -5.2% |
| WAM Leaders (WLE) | $1.22 | -$0.09 | -6.9% | -3.6% | -8.3% |
| Capstone Copper Corp. (CSC) | $9.73 | -$0.71 | -6.8% | -25.3% | -27.5% |
| Arafura Rare Earths (ARU) | $0.14 | -$0.01 | -6.7% | -6.7% | -49.1% |
| Megaport (MP1) | $16.78 | -$1.19 | -6.6% | +1.7% | +22.7% |
Chartwatch
Nasdaq Composite Index
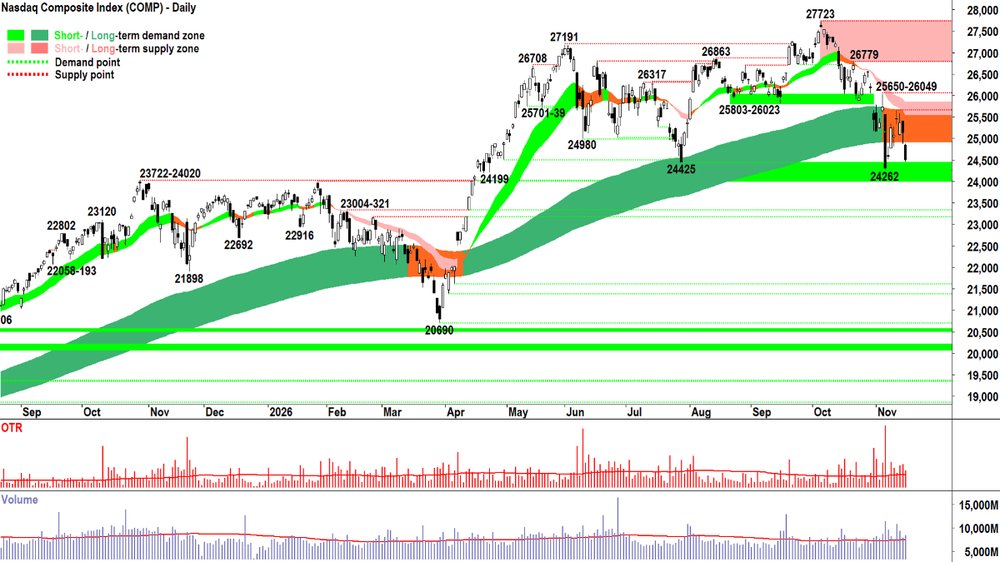
Nasdaq Composite Index chart
Analysis
Long term trend change confirmed:
Price is below the long term trend ribbon ⚠️
The long term trend ribbon is amber (it is also falling) ⚠️
Long term trend ribbon is acting as a zone of dynamic supply (confirmed for me on last night's candle) ⚠️
Obviously, also:
Short term trend is down, short term trend ribbon is acting as a zone of dynamic supply ⚠️
Price action is lower peaks and lower troughs = ✅STR, ✅NUTE, ✅FOHO & 🚫BTD, 🚫FOMO, 🚫HOFU ⚠️
Candles are predominantly supply side in nature = STR, NUTE, FOHO ⚠️
Above average volatility on supply side candles ⚠️
Above average volume on supply side candles ⚠️
Which means our Analysis = ⚠️⚠️⚠️⚠️⚠️⚠️
Which means our Accept = S > D = MOTN P⬇️
View
Which means... well for most people... looking at the above chart... and with the reality of their portfolio's dire situation sinking in = 😱!!!
We don't do "😱" here. Nope, we do 🛡️+⚖️+🧘.
I mean... what's all the fuss about!? 🤔
I'm at 1/3RP on US stocks (RP = Risk Position – it reflects my personal allowable capital allocation limit for my investments in US stocks. So 1/2RP is 50%, 2/3RP is 67% and FRP is 100%).
Key Levels
The long term trend ribbon is the closest (dynamic) zone of supply (presently 24918-25651) but the short term trend ribbon (presently 25552-25831) is likely the critical go-no-go for the current short term downtrend. There appears to be a substantial zone of potential latent demand between 23722-24425. If it goes... 20690?
S&P/ASX 200 (XJO)
S&P/ASX 200 (XJO) chart

Analysis
It's kinda done it to us again.
Or did we do it to ourselves? 🤦
Putting faith in an Old Tin Pot?
Back to the middle of the range = 🦓🦓🦓🦓🦓
RP?
Precautionary move here. Balance and flexibility feels like the best option. ⚖️
But, hey — that's what I'm doing... You gotta do what you gotta do!
View
Sigh. Close below the short term trend ribbon. Big black candle with close at the session's low. I am moving to 1/2RP from 2/3RP on Australian shares (i.e., 50% invested vs 33% cash, with some of the invested portion allocated to shorts). As I've stated here each evening for the last couple weeks since we moved back to 2/3RP, the long side risk was a little hard to find — which means this might not be a major move for many. As usual, moves between RP levels is a walk, not a run. Ideally they're enacted within the next week, but often, one will find that these things take care of themselves!
Key Levels
9160 is the closest point of supply. The long term trend ribbon is the closest zone of (dynamic) demand (presently 8813-8859).
(Glossary of acronyms! Old Tin Pot (OTP): S&P/ASX 200 | MOTN: More Often Than Not | FOMO: Fear Of Missing Out | HOFU: Holding On For Upside | BTD: Buy The Dip | NUTE: No Urgency To Enter | FOHO: Fear Of Holding On | STR: Sell The Rally | RP: Risk Position | FFS: Fund Flow Shenanigans!)
***CHARTWATCH LIVE — BUY STOCKS NOW OR SELL THE RALLY? 📺***
ChartWatch LIVE Webinars – WEEKLY Wednesday's @ 12pm AEDT
Learn more about technical analysis and trend following through real case studies on ASX stocks. Australia's premier technical analyst, Carl Capolingua, shares his unique insights on stocks as requested by viewers. Ask about a company in your portfolio or anything related to trading and investing and get Carl's expert opinion.
Places are limited so >REGISTER NOW!<
Economy
TODAY
AUS RBA Governor Michelle Bullock speech
Here's an old chestnut: "inflation risks remain tilted to the upside"
LATER THIS WEEK
WEDNESDAY
00:30 USA Core Retail Sales (+0.4% m/m forecast vs +0.9% m/m previous)
11:30 AUS MI Leading Index
11:30 AUS September Quarter Wage Price Index (+0.9% q/q forecast vs +0.8% q/q previous)
THURSDAY
06:00 USA FOMC November Meeting Minutes
11:30 AUS October Employment Data
Change: +25,200 forecast vs -39,300 in September
Rate: 4.7% forecast, unchanged vs September
FRIDAY
12:00 People's Bank of China ("PBOC") Loan Prime Rate ("LPR")
1-year LPR: 3.00% p.a. forecast, unchanged
5-year LPR: 3.50% p.a. forecast, unchanged
Interesting Movers
Trading higher
- Mayne Pharma Group (MYX) $6.01+87.2%
Announced a takeover bid from Gedeon Richter PLC at $6.40 per share cash, valuing the company at $604 million. Consider that last year a $672 million bid from US-based healthcare company Cosette was rejected by Treasurer Jim Chalmers.
- Ion Video (IOV) $0.87+20.1%
Announced that its technology has far exceeded its key validation metrics in a proof of concept engagement funded by Amazon Web Services (AWS). Management said that when pitted against two AI agents on identical AWS servers, ION cut computing time, new storage and AI cost by 98.9% to 99.9%. This was better than the 30% the company was targeting.
- Clover Corporation (CLV) $1.13+13.1%
Provided a FY27 guidance update at its AGM held today. Management expects first half FY27 revenue to be around
$60m, and that full year revenue and earnings will outperform FY26. - Technology One (TNE) $35.15+8.9%
Announced its FY26 results. NPAT before tax was up 19% versus the previous corresponding period ("pcp"). Annual recurring revenue ("ARR") was up 18%. Management highlighted strong growth in its UK operations and interest in the company's AI products. Final dividend is $0.325, 85% franked, up 63% vs pcp.
- Investigator Silver (IVR) $0.05+8.7%
No news. Certainly bucked the trend in the gold sector today. 🤔
- Imricor Medical Systems Inc (IMR) $1.46+8.2%
No news since the company released its September quarter activities report on Friday. 🤔
- 29Metals (29M) $0.28+7.8%
Provided an update including preliminary approval of a major amendment to the Environmental Authority for Capricorn Copper (enabling construction of TSF 3 and restart of operations). The Definitive Feasibility Study ("DFS") for restart is on track to complete by the end of this year. Also reported strong operational performance at Golden Grove (highest monthly ore mined in over three years of 156kt).
- EML Payments (EML) $0.34+6.3%
No news, but consider that the company holds its AGM tomorrow... EML was recently added to the ChartWatch ASX Scans Uptrends List. 📈
- Betashares Austalian Equities Strong Bear Hedge Fund (BBOZ) $21.22+4.3%
It's a bear fund on ASX stocks... ASX stocks down = BBOZ up! 🐻
- BetaShares U.S. Equities Strong Bear Hedge Fund - Currency Hedged (BBUS) $24.51+4.0%
It's a bear fund on US stocks... US stocks down = BBOZ up! 🐻
- Healius (HLS) $0.60+3.5%
Reported that Host-Plus has increased its holding in the company to 13.02% from 11.92%.
Trading Lower
- Catapult Sports (CAT) $3.02-16.6%
Announced its first half FY27 results. Management noted a 20.8% jump in statutory half-year revenue to $US81.7 million, up 20% vs pcp. NPAT blew out to $US8.6 million, up 121.1%. Gross margin was 80.7%, up from 79.3%.
- IPH (IPH) $3.42-13.4%
Provided a trading update at its AGM held today. Management reported an 8.4% decline in group revenue for the four months ended October 31. Unaudited underlying EBITDA fell 13.4% to $62.6 million vs pcp. Management blamed a stronger Australian dollar during the period for some of the underperformance. On a currency adjusted basis underlying EBITDA 4.2% vs pcp.
- Sunrise Energy Metals (SRL) $10.76-11.0%
No news. Performance reflected general weakness in the broader critical minerals sector. SRL is a regular in the ChartWatch ASX Scans Downtrends List. 📉
- MA Financial Group (MAF) $4.22-9.4%
No news. Performance reflected general weakness in the broader funds management sector. MAF is a regular in the ChartWatch ASX Scans Downtrends List. 📉
- Unico Silver (USL) $0.48-9.4%
Held its AGM today. Performance reflected general weakness in the broader precious metals sector. USL is a regular in the ChartWatch ASX Scans Downtrends List. 📉
- MAAS Group Holdings (MGH) $3.50-9.3%
Announced it has repaid the Metrics Credit Partners facility of approximately $590 million relating to the Western Sydney Aerotropolis land portfolio. Settlement was funded through a combination of cash on hand and debt drawn from existing syndicated bank facilities. MGH is a regular in the ChartWatch ASX Scans Downtrends List. 📉
- Alpha HPA (A4N) $0.36-8.9%
No news. Performance reflected general weakness in the broader critical minerals sector. A4N is a regular in the ChartWatch ASX Scans Downtrends List. 📉
- PLS Group (PLS) $2.64-8.7%
No news. Performance reflected general weakness in the broader critical minerals sector. PLS is a regular in the ChartWatch ASX Scans Downtrends List. 📉
- Mineral Resources (MIN) $41.83-8.4%
No news. Performance reflected general weakness in the broader materials sector. MIN is a regular in the ChartWatch ASX Scans Downtrends List. 📉
- IperionX (IPX) $1.86-8.3%
No news. Performance reflected general weakness in the broader critical minerals sector. IPX is a regular in the ChartWatch ASX Scans Downtrends List. 📉
- PMET Resources Inc (PMT) $0.28-8.2%
No news. Performance reflected general weakness in the broader critical minerals sector. PMT is a regular in the ChartWatch ASX Scans Downtrends List. 📉
- FireFly Metals (FFM) $1.25-8.1%
No news. Performance reflected general weakness in the broader copper sector. FFM is a regular in the ChartWatch ASX Scans Downtrends List. 📉
- Champion Iron (CIA) $1.83-7.8%
No news. Performance reflected general weakness in the broader materials sector. CIA is a regular in the ChartWatch ASX Scans Downtrends List. 📉
- GQG Partners Inc. (GQG) $0.61-7.6%
No news. Performance reflected general weakness in the broader funds management sector. GQG is a regular in the ChartWatch ASX Scans Downtrends List. 📉
- Nickel Industries (NIC) $0.59-7.5%
No news. Performance reflected general weakness in the broader materials sector. NIC is a regular in the ChartWatch ASX Scans Downtrends List. 📉
- Capstone Copper Corp. (CSC) $9.67-7.4%
No news. Performance reflected general weakness in the broader copper sector. CSC is a regular in the ChartWatch ASX Scans Downtrends List. 📉
- Praemium (PPS) $0.60-5.9%
Announced that Bell Financial (BFG) had made an all-scrip merger proposal in September. The Board rejected the offer on the basis that it was not in the best interests of PPS shareholders. Management noted that subsequent discussions with BFG have focused on the underlying commercial relationship between the two businesses. PPS is a regular in the ChartWatch ASX Scans Downtrends List. 📉
Broker Moves
Company | Broker | Action | Rating | Price Target |
|---|---|---|---|---|
29M29Metals | Canaccord Genuity | Retained | Buy | $0.40 |
ALDAmpol | Morgan Stanley | Retained | Overweight | $45.00 |
ALLAristocrat Leisure | Morgan Stanley | Retained | Overweight | $67.30(from $63.90) |
ANZANZ Group Holdings | Morgan Stanley | Downgraded | Equal Weight(from Overweight) | $35.00(from $35.50) |
AR1Austral Resources Australia | Shaw and Partners | Retained | Buy | $0.22 |
ARFArena REIT | UBS | Retained | Buy | $3.04 |
CBACommonwealth Bank of Australia | Morgan Stanley | Retained | Underweight | $125.00 |
CHCCharter Hall Group | UBS | Retained | Buy | $23.75 |
COLColes Group | Morgan Stanley | Retained | Overweight | $23.50 |
CSCCapstone Copper Corp. | Barrenjoey | Retained | Overweight | $12.75(from $14.00) |
| UBS | Retained | Buy | $18.00 | |
CSLCSL | Morgan Stanley | Retained | Overweight | $200.00 |
DMPDomino's Pizza Enterprises | Morgan Stanley | Retained | Underweight | $16.00 |
DNLDyno Nobel | Morgan Stanley | Retained | Overweight | $4.20 |
DXSDexus | UBS | Retained | Neutral | $6.16 |
ELDElders | Bell Potter | Retained | Hold | $6.70 |
| Macquarie | Retained | Outperform | $7.65(from $7.30) | |
| UBS | Retained | Neutral | $7.10(from $6.40) | |
FFMFireFly Metals | UBS | Retained | Buy | $2.50 |
FPRFleetPartners Group | Macquarie | Retained | Neutral | $5.30 |
| Morgan Stanley | Retained | Equal Weight | $4.65 | |
GLCGlencore plc | Morgan Stanley | Retained | Overweight | $13.20 |
GMGGoodman Group | UBS | Retained | Buy | $33.19 |
GPTGPT Group | UBS | Retained | Buy | $5.60 |
JHXJames Hardie Industries Plc | Morgan Stanley | Retained | Overweight | $47.00 |
MAFMA Financial Group | Macquarie | Initiated | Neutral | $5.10 |
MGRMirvac Group | UBS | Retained | Neutral | $1.96 |
MQGMacquarie Group | Morgan Stanley | Retained | Overweight | $277.00(from $273.00) |
NABNational Australia Bank | Morgan Stanley | Retained | Underweight | $34.00 |
NHCNew Hope Corporation | Barrenjoey | Retained | Neutral | $5.50(from $6.40) |
| Bell Potter | Upgraded | Hold(from Sell) | $4.80(from $5.30) | |
| Macquarie | Retained | Outperform | $6.80(from $7.40) | |
NHFNIB Holdings | Macquarie | Retained | Neutral | $6.60 |
OREOrezone Gold Corporation | Canaccord Genuity | Retained | Buy | $4.75 |
ORIOrica | Morgan Stanley | Retained | Overweight | $28.00 |
PDIPDI Gold | Canaccord Genuity | Retained | Speculative Buy | $7.75(from $7.46) |
PDNPaladin Energy | Morgan Stanley | Retained | Overweight | $9.95 |
QBEQBE Insurance Group | Macquarie | Retained | Outperform | $26.60 |
RPLRegal Partners | Macquarie | Initiated | Outperform | $3.65 |
SCGScentre Group | Morgan Stanley | Downgraded | Equal Weight(from Overweight) | $4.00(from $4.44) |
SFRSandfire Resources | UBS | Retained | Buy | $23.35 |
SGHSGH | Morgan Stanley | Retained | Overweight | $48.00 |
SKGStorage King Group | Shaw and Partners | Retained | Buy | $1.30 |
SKYSky Metals | Shaw and Partners | Retained | Buy | $0.36 |
STOSantos | Morgan Stanley | Retained | Overweight | $9.25 |
SXESouthern Cross Electrical Engineering | Shaw and Partners | Retained | Buy | $5.20 |
TCLTransurban Group | Macquarie | Retained | Outperform | $15.00(from $14.00) |
TLCThe Lottery Corporation | Morgan Stanley | Retained | Equal Weight | $5.55 |
VCXVicinity Centres | UBS | Retained | Neutral | $2.65 |
WBCWestpac Banking Corporation | Morgan Stanley | Retained | Underweight | $31.00 |
WESWesfarmers | Morgan Stanley | Retained | Equal Weight | $70.50 |
WMCWiluna Mining Corporation | Barrenjoey | Initiated | Overweight | $1.80 |
XROXero | Morgan Stanley | Retained | Overweight | $130.00 |
Scans
Top Gainers
Code | Company | Last | % Chg |
|---|---|---|---|
| MYX | Mayne Pharma Group Ltd | $6.01 | +87.23% |
| BKT | Black Rock Mining Ltd | $0.015 | +57.90% |
| NGY | Nuenergy Gas Ltd | $0.026 | +23.81% |
| BUS | Bubalus Resources Ltd | $0.095 | +21.80% |
| IOV | Ion Video Ltd | $0.865 | +20.14% |
Top Fallers
Code | Company | Last | % Chg |
|---|---|---|---|
| BUR | Burley Minerals Ltd | $0.02 | -23.08% |
| ASH | Ashley Services Group Ltd | $0.22 | -21.43% |
| INN | Innovaero Technologies Ltd | $0.22 | -21.43% |
| RAS | Ragusa Minerals Ltd | $0.012 | -20.00% |
| SRN | Surefire Resources NL | $0.012 | -20.00% |
52 Week Highs
Code | Company | Last | % Chg |
|---|---|---|---|
| IOV | Ion Video Ltd | $0.865 | +20.14% |
| CLV | Clover Corporation Ltd | $1.125 | +13.07% |
| TNE | Technology One Ltd | $35.15 | +8.86% |
| IXI | iShares Global Consumer Staples ETF | $109.36 | +0.64% |
| CPU | Computershare Ltd | $45.43 | +0.53% |
52 Week Lows
Code | Company | Last | % Chg |
|---|---|---|---|
| INN | Innovaero Technologies Ltd | $0.22 | -21.43% |
| RAS | Ragusa Minerals Ltd | $0.012 | -20.00% |
| SRN | Surefire Resources NL | $0.012 | -20.00% |
| SKK | Stakk Ltd | $0.013 | -18.75% |
| RML | Resolution Minerals Ltd | $0.027 | -15.63% |
Near Highs
Code | Company | Last | % Chg |
|---|---|---|---|
| BEAR | Betashares Australian Equities Bear Complex ETF | $7.39 | +1.79% |
| OZBD | Betashares Australian Composite Bond ETF | $43.12 | -0.07% |
| AN3PI | Australia and New Zealand Banking Group Ltd | $102.97 | +0.15% |
| PCI | Perpetual Credit Income Trust | $1.08 | -0.46% |
| WVOL | iShares MSCI World Ex Aust Minimum Volatility ETF | $49.34 | -0.46% |
Relative Strength Index (RSI) Oversold
Code | Company | Last | % Chg |
|---|---|---|---|
| ETPMAG | Global X Metal Securities Australia Ltd | $64.56 | -4.81% |
| BTXX | Digitalx Bitcoin ETF | $20.86 | -4.40% |
| CRYP | Betashares CRYPTO Innovators ETF | $5.70 | -5.32% |
| GQG | GQG Partners Inc | $0.66 | -6.38% |
| SCP | Scalare Partners Holdings Ltd | $2.60 | -23.53% |