News | Market Wraps
Evening Wrap: ASX 200 rises on surging Commonwealth Bank, ANZ, NAB, and Westpac shares - Big4 Banks Special Ed.
The S&P/ASX 200 closed 51.3 points higher, up 0.61%.

Mentioned
The S&P/ASX 200 closed 51.3 points higher, up 0.61%.
Well received December quarter results from Commonwealth Bank of Australia (CBA) spurred gains in stablemates ANZ, National Australia Bank (NAB), and Westpac (WBC). Strong results also helped Computershare (CPU) to a +15% gain.
Really, only Gold and Technology stocks did it tough today as the Australian stock market dragged itself to within striking distance of a new record high.
Click/scroll through for the usual reporting of the major sector and stock-specific moves, the broker responses to them, as well as all the key upcoming economic data in tonight's Evening Wrap.
Also, I have detailed technical analysis on Commonwealth Bank (CBA), ANZ, National Australia Bank (NAB), and Westpac (WBC) in today's ChartWatch.
Let's dive in!
Today in Review
Wed 12 Feb 25, 5:15pm (AEST)
Name | Value | % Chg |
|---|---|---|
Major Indices | ||
| ASX 200 | 8,535.3 | +0.61% |
| All Ords | 8,799.6 | +0.55% |
| Small Ords | 3,192.3 | -0.86% |
| All Tech | 4,077.0 | +1.22% |
| Emerging Companies | 2,375.8 | -0.11% |
Currency | ||
| AUD/USD | 0.6292 | -0.04% |
US Futures | ||
| S&P 500 | 6,086.5 | -0.09% |
| Dow Jones | 44,677.0 | -0.07% |
| Nasdaq | 21,777.25 | -0.04% |
Name | Value | % Chg |
|---|---|---|
Sector | ||
| Industrials | 8,006.8 | +1.93% |
| Financials | 9,262.1 | +1.41% |
| Consumer Staples | 11,873.5 | +1.08% |
| Energy | 8,775.5 | +0.98% |
| Consumer Discretionary | 4,185.4 | +0.58% |
| Utilities | 8,730.2 | +0.15% |
| Communication Services | 1,670.6 | +0.02% |
| Real Estate | 3,924.0 | -0.08% |
| Health Care | 43,510.7 | -0.25% |
| Materials | 16,898.0 | -0.42% |
| Information Technology | 2,866.4 | -1.05% |
Markets

ASX 200 Session Chart
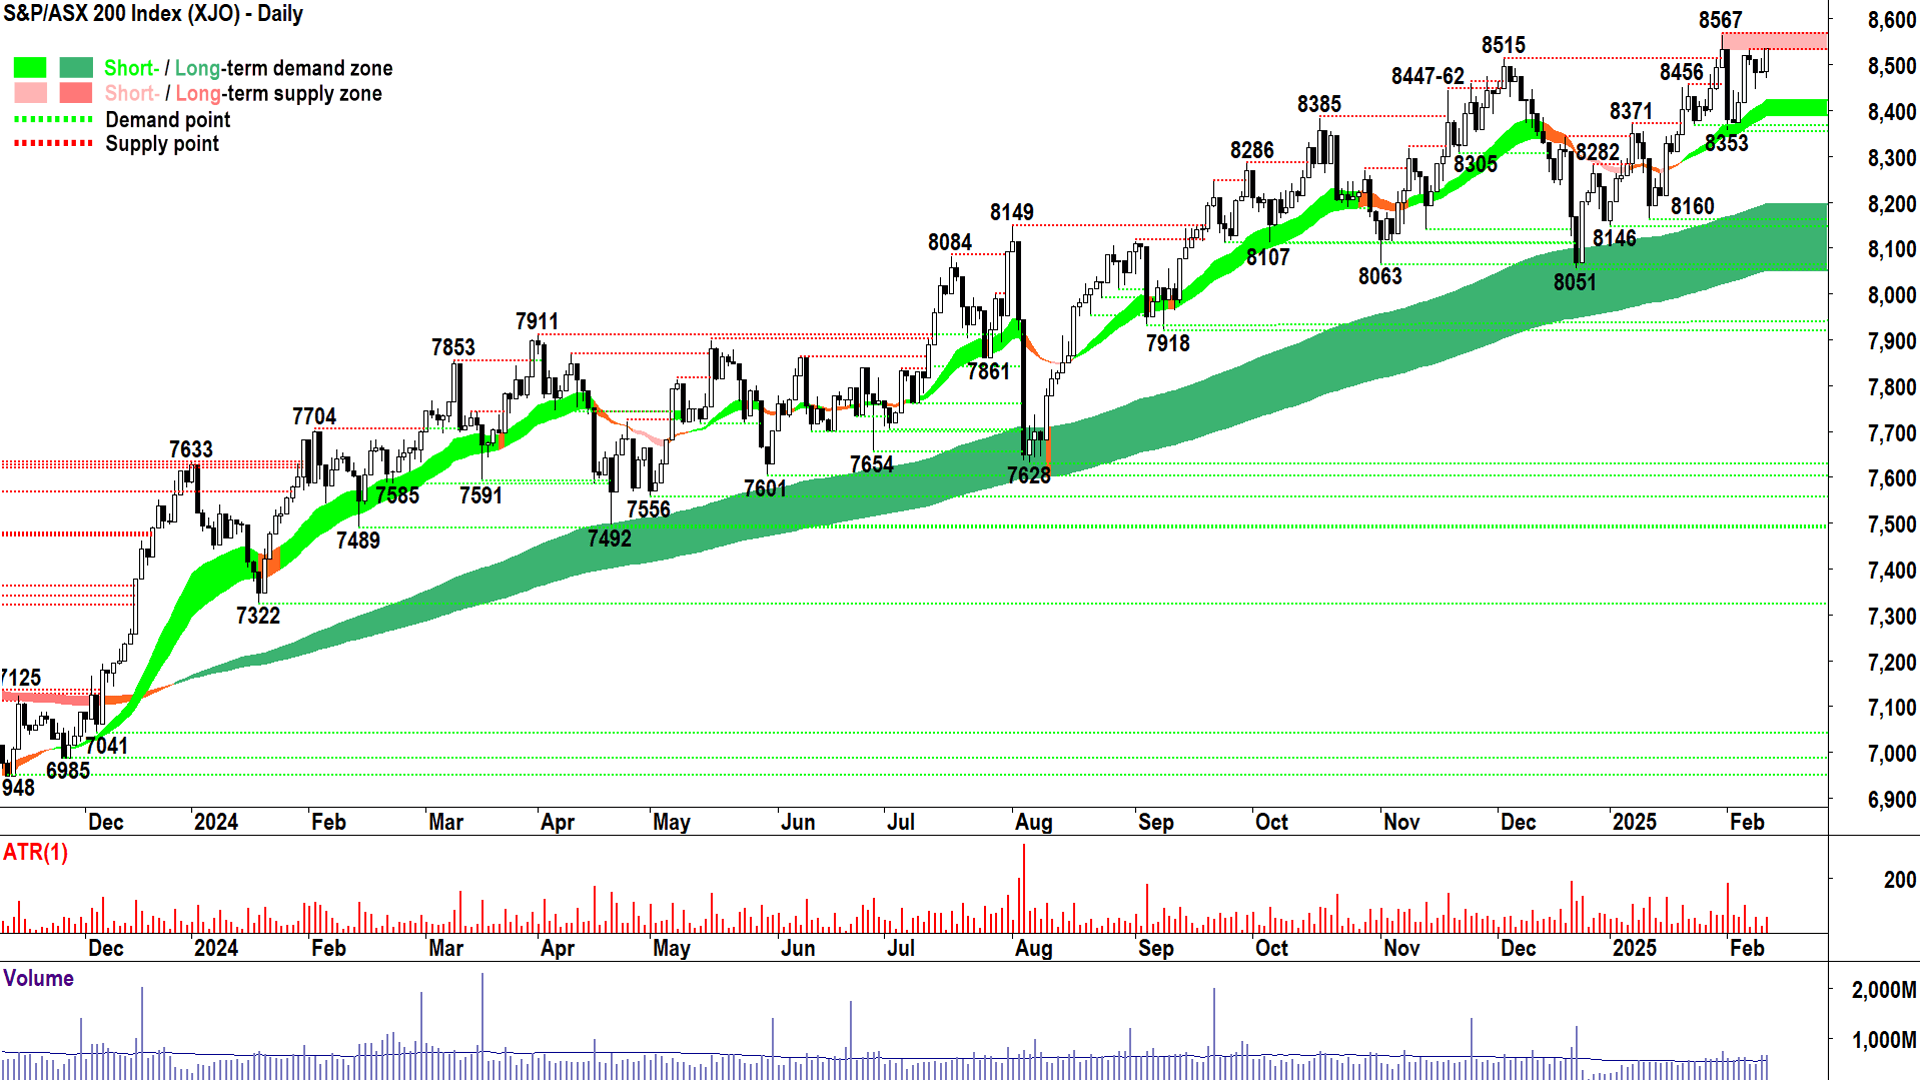
The S&P/ASX 200 (XJO) finished 51.3 points higher at 8,535.3, 0.77% from its session low and smack–bang on its session high. But as good as the headline gain in the benchmark appeared, things below the surface weren’t so clear-cut. In the broader-based S&P/ASX 300 (XKO), advancers lagged decliners by a disappointing 108 to 172 (it was worse during the session).
Judging by the aforementioned market breadth, today’s solid gain and accompanying crisp full white candle belied some struggles in the broader market.
%20Chart%2012%20February%202025.png)
A crisp full white candle on the ASX 200 today! (click here for full size image)
When we do so well at an index level, and decliners are beating gainers by better than 3 to 2 – you can usually bet your bottom dollar that a small group of majors did most of the heavy lifting today – and this is certainly the case given the strong performance of the Financials (XFJ) (+1.4%) sector and its Big4 banking behemoths.
Well received December quarter results from Commonwealth Bank of Australia (ASX: CBA) (+2.4%) spurred gains in stablemates ANZ Group (ASX: ANZ) (+0.71%), National Australia Bank (ASX: NAB) (+1.7%), and Westpac Banking Corporation (ASX: WBC) (+1.1%).
Elsewhere, the often overlooked Industrials (XNJ) (+1.9%) sector took out the honour of best performing ASX sector today (rarely the case!). The reason was also earnings-related, with sector heavyweight Computershare (ASX: CPU) (+15.5%) surging on strong first half results.
The defensive Consumer Staples (XSJ) (+1.1%) sector and Energy (XEJ) (+1.0%) were the only other two major areas of the market to log better than benchmark gains. Energy got a boost from a rally in crude oil and natural gas prices overnight. Staples – well it was kind of a defensive type of day!
The Gold (XGD) (-1.7%) sub-index and the Information Technology (XIJ) (-1.0%) sector were really the only two broad areas of the market you could say did it tough. Gold prices edge lower overnight, and it seems that ASX gold stocks are printing oversized gains each way based on gold price moves – today it was down.
Tech was softer on a weak lead from the NASDAQ Composite. But I note that pullbacks in sector leaders Technology One (ASX: TNE) (-1.8%) and Xero (ASX: XRO) (-1.6%) were modest compared to strong respective overall chart uptrends.
Higher risk-free market yields overnight, and into today's trade on the local bond market, likely also hindered both sectors, as well as other interest rate sensitives today.

US 10 Year T-Bond Yield chart (click here for full size image)
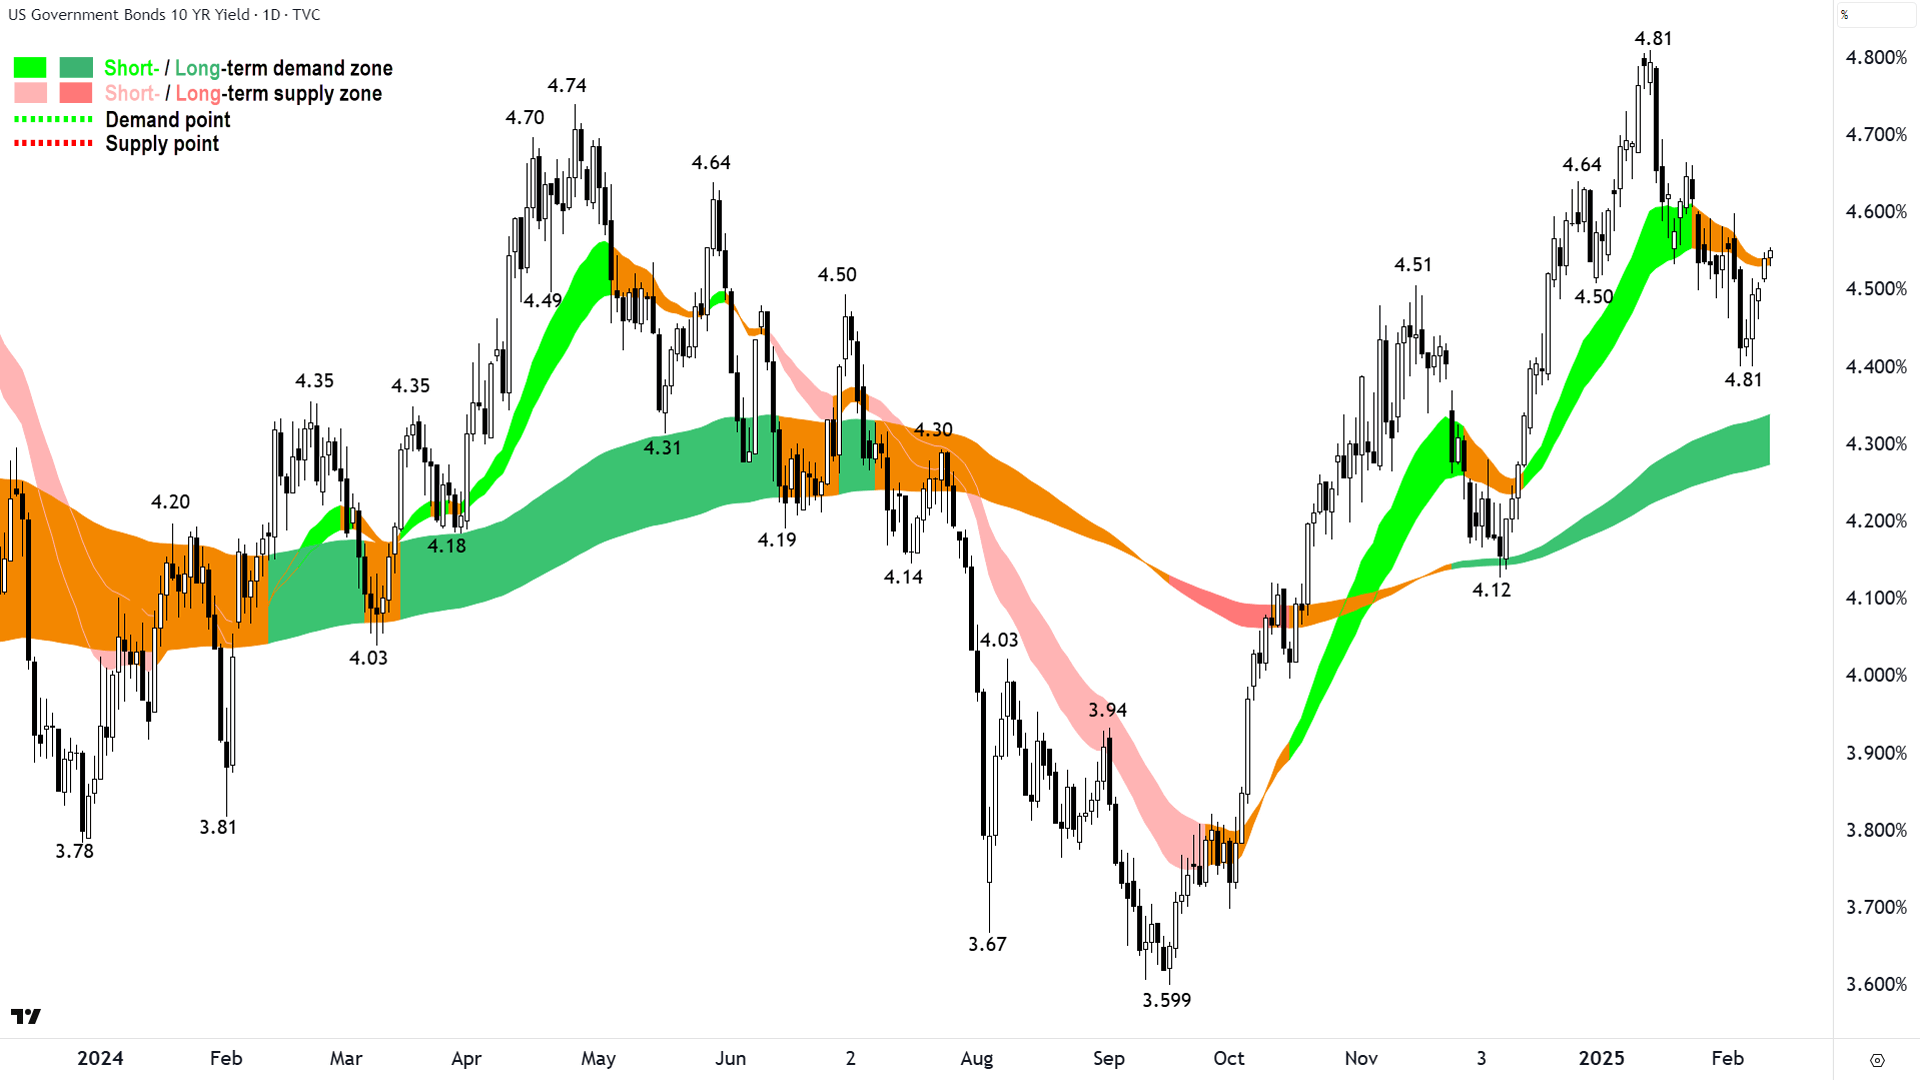
On the topic of charts – I have a special treat for you in tonight’s edition of ChartWatch – a Big4 Banks Special. Keep scrolling for detailed technical analysis on investor favourites ANZ, CBA, NAB, and WBC.
ChartWatch *BIG4 Banks Special Edition*
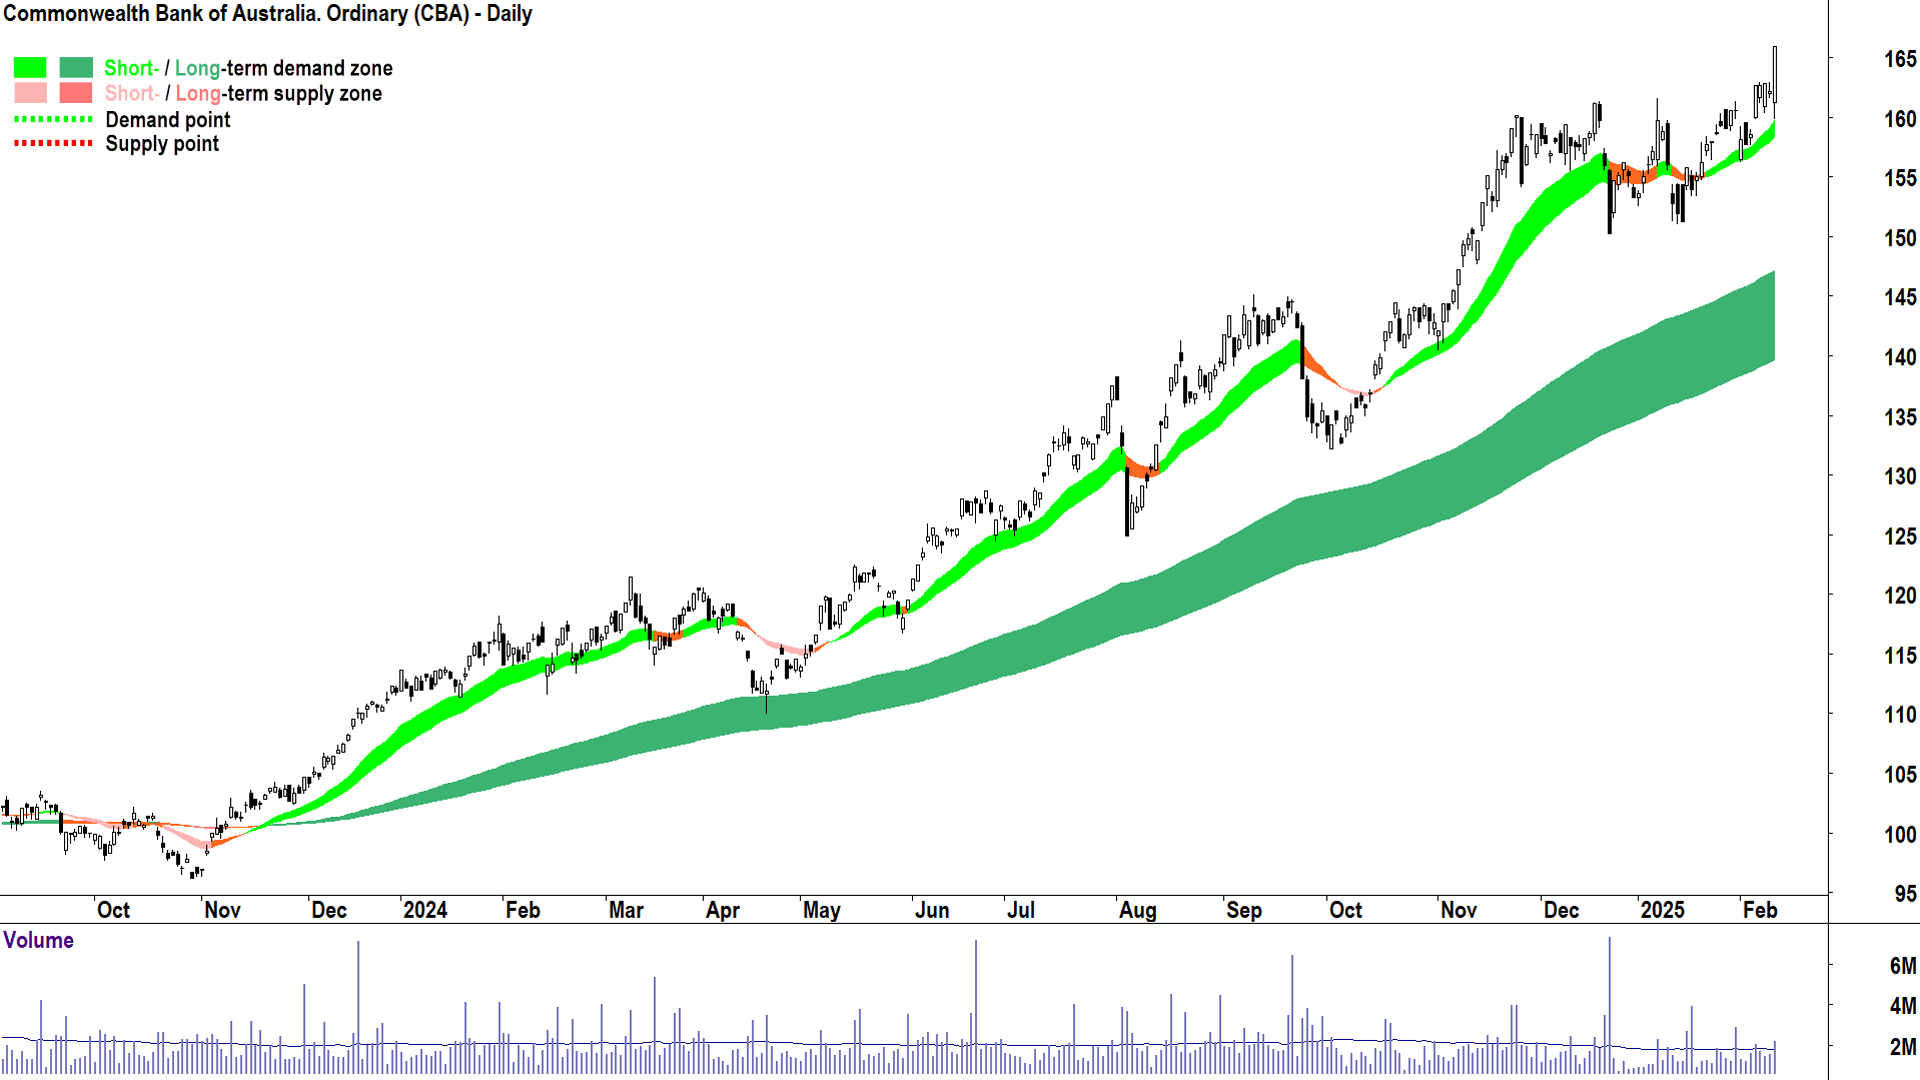
Commonwealth Bank of Australia (ASX: CBA)
%20daily%20chart%2012%20February%202025.png)
ChartWatch ASX Scans Uptrends "Most Featured" 🏆 (click here for full size image)
I don't know if you're old enough to remember the Swan beer ads from the 80's. Speaking as sandgroper, I think they were our state's anthem there for a few years...somewhere between Australia II and Australia IV...⛵
"They said you'd never make it...but you finally came through..."🎵🎶
It's kinda how I feel about the CBA chart. Pretty much every broker has had a sell rating on it since the beginning of 2024, and just about every talking head in the financial media has grumbled about it being "expensive", or "overvalued", or something of the sort.
Yet the share price of our little Aussie banking battler has done pretty much only one thing throughout the last 15 months...it's gone up...and up...and up! 🚀
Everyone loves an underdog story, and CBA has traversed countless trials and tribulations ranging from the aforementioned "82 standard deviations from the historical PE mean" claims, to raging competition in the mortgage market, to a slowing Australian economy, to rising costs of funding as long term market yields have climbed.
But there was one bastion of CBA faith among the detractors and pessimists. ChartWatch ASX Scans.
41 times.
That's how many times I've run CBA as a Feature Uptrend (i.e., highest conviction) in my daily technical analysis scan lists. It will be 42 if you count tomorrow's edition.
ChartWatch only started at the end of May last year, so that's really 42 times in 8 and a bit months. This means that roughly once a week I've called CBA's chart as among the strongest uptrends across the entire ASX.
Neither ChartWatch nor I can tell the future...and each of those 41 times I can honestly say I had zero idea of where the CBA chart was headed next. Ditto for when you see it tomorrow's Ed – not the foggiest. 🤷
All I can say, is that each time you see CBA or any Feature Uptrend chart in ChartWatch ASX Scans – it is a picture of excess demand. Make of that what you will!
(Oh, ChartWatch has also been running CSL regularly as a Feature Downtrend since September – so there's that also!)
ANZ Group (ASX: ANZ)
%20daily%20chart%2012%20February%202025.png)
The laggard of the Big 4 🏃♂️➡️ (click here for full size image)
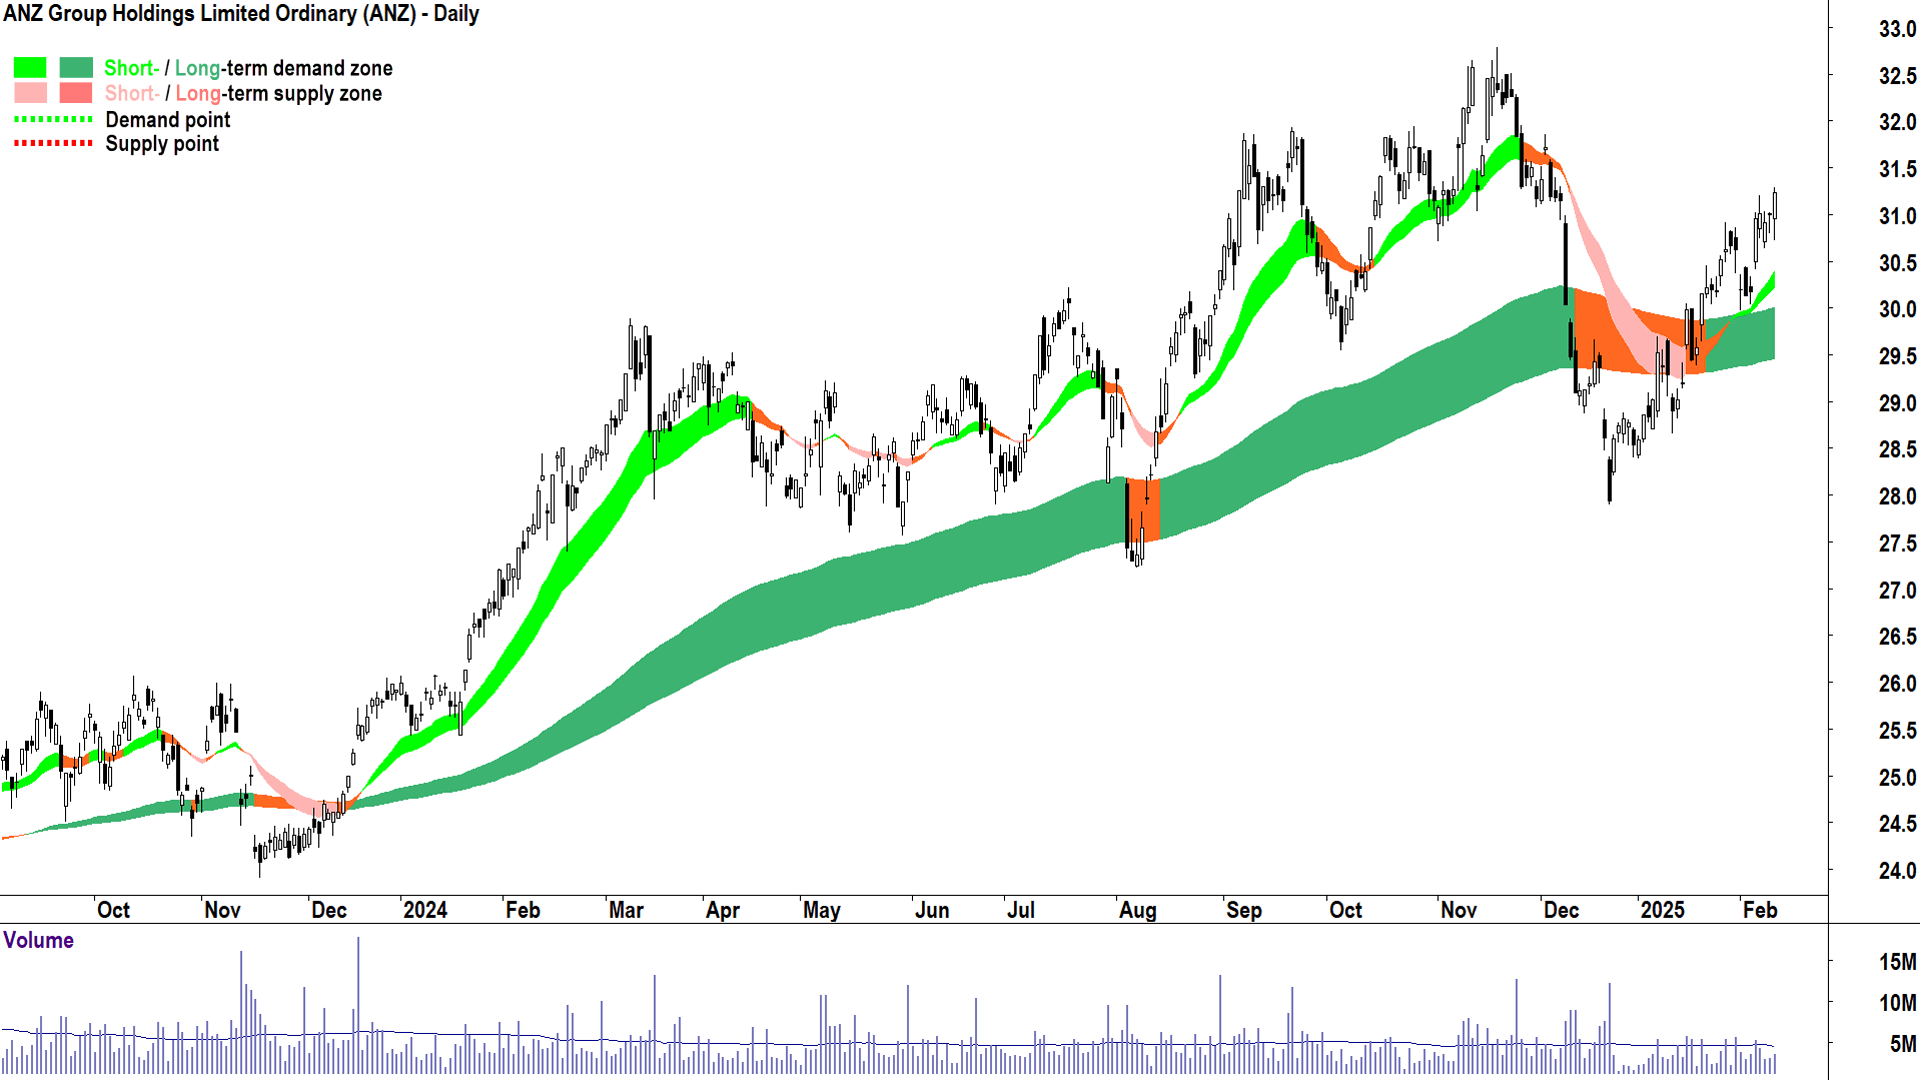
It's not just CBA that has had substantial "expensive and overvalued" claims leveled against it. It's been the case for the whole ASX banking sector. ChartWatch ASX Scans has run ANZ as a Feature Uptrend 14 times, the least of any of the Big4.
It was a steady constituent between 6-Jun and 22-Nov, and then nothing until it recently returned on 6-Feb. When you look at CBA above, and NAB and WBC below, you will see ANZ remains the laggard of the bunch.
Still, I put to you that with short and long term uptrends re-established, price action back to rising peaks and rising troughs, and a return to demand-side candle predominance (i.e., white bodies and or downward pointing shadows), it appears the demand-side is back in control here.
I expect demand at the short term uptrend ribbon, kicking in around 30.25-30.45, and then down to the 3-Feb static point of demand at 29.97. The short term uptrend is intact as long as ANZ continues to trade above these areas of demand.
Supply is at the 19-Nov major point of demand at 32.80.
National Australia Bank (ASX: NAB)
%20daily%20chart%2012%20February%202025.png)
Don't fight the money, don't fight the trend 🚫 (click here for full size image)
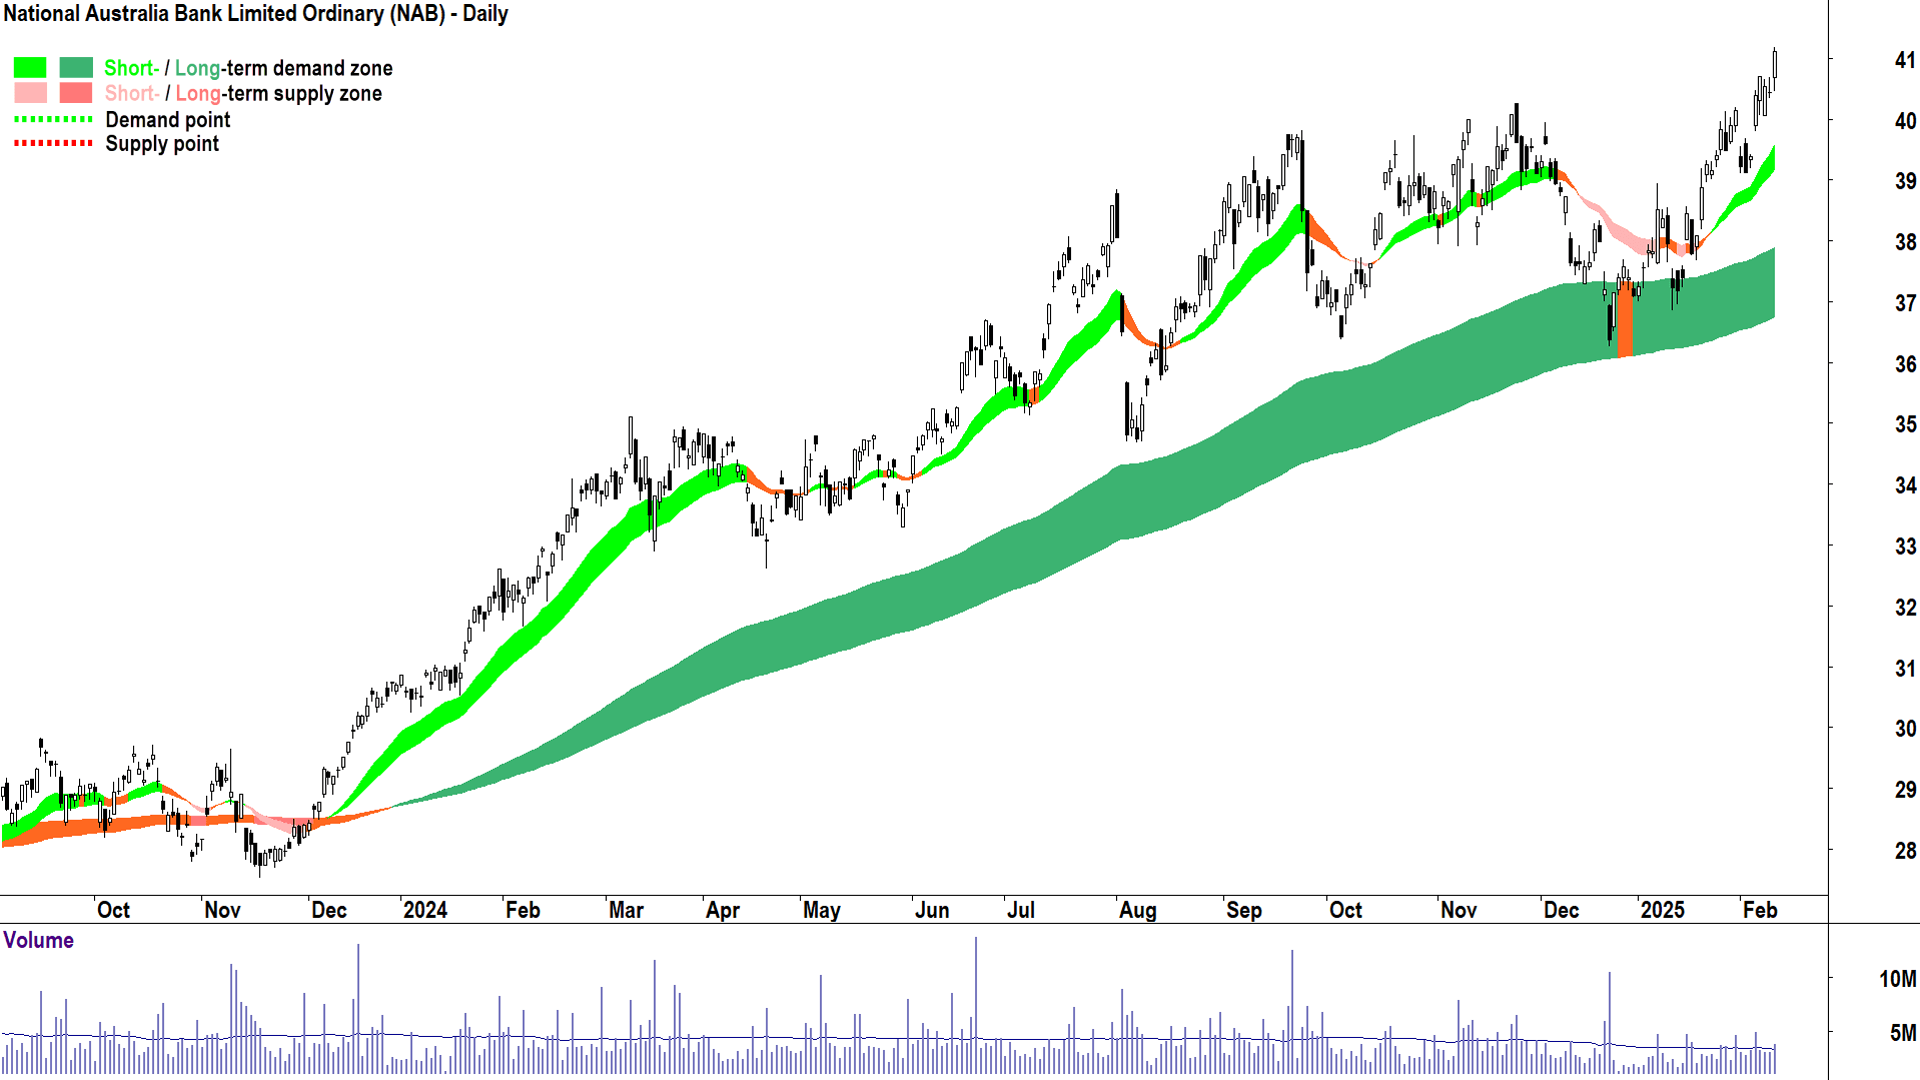
Another very solid, CBA-like trend. But even though NAB is showing strong short and long term uptrends, price action, and demand-side candles, there is one key difference between it and the CBA chart. Volatility.
CBA's is a lower volatility trend. Don't get me wrong, I think NAB's uptrend is fantastic, and it has been run as a ChartWatch Feature Uptrend 21 times, but lower volatility uptrends are always preferred to higher volatility uptrends.
The lower the volatility within a trend (up or down), the greater the consensus among the demand side and the supply side.
The greater the consensus among market participants that something should be going up or down – the more likely it is to keep doing that.
NAB is a picture of excess demand with very little in in terms of potential overhead points of supply to contend with.
I see demand at the short term uptrend ribbon, kicking in around 39.20-39.60, and then down to the 4-Feb static point of demand at 39.12. The short term uptrend is intact as long as NAB continues to trade above these areas of demand.
Westpac Banking Corporation (ASX: WBC)
%20daily%20chart%2012%20February%202025.png)
Not CBA, but not too shabby either...🤔 (click here for full size image)
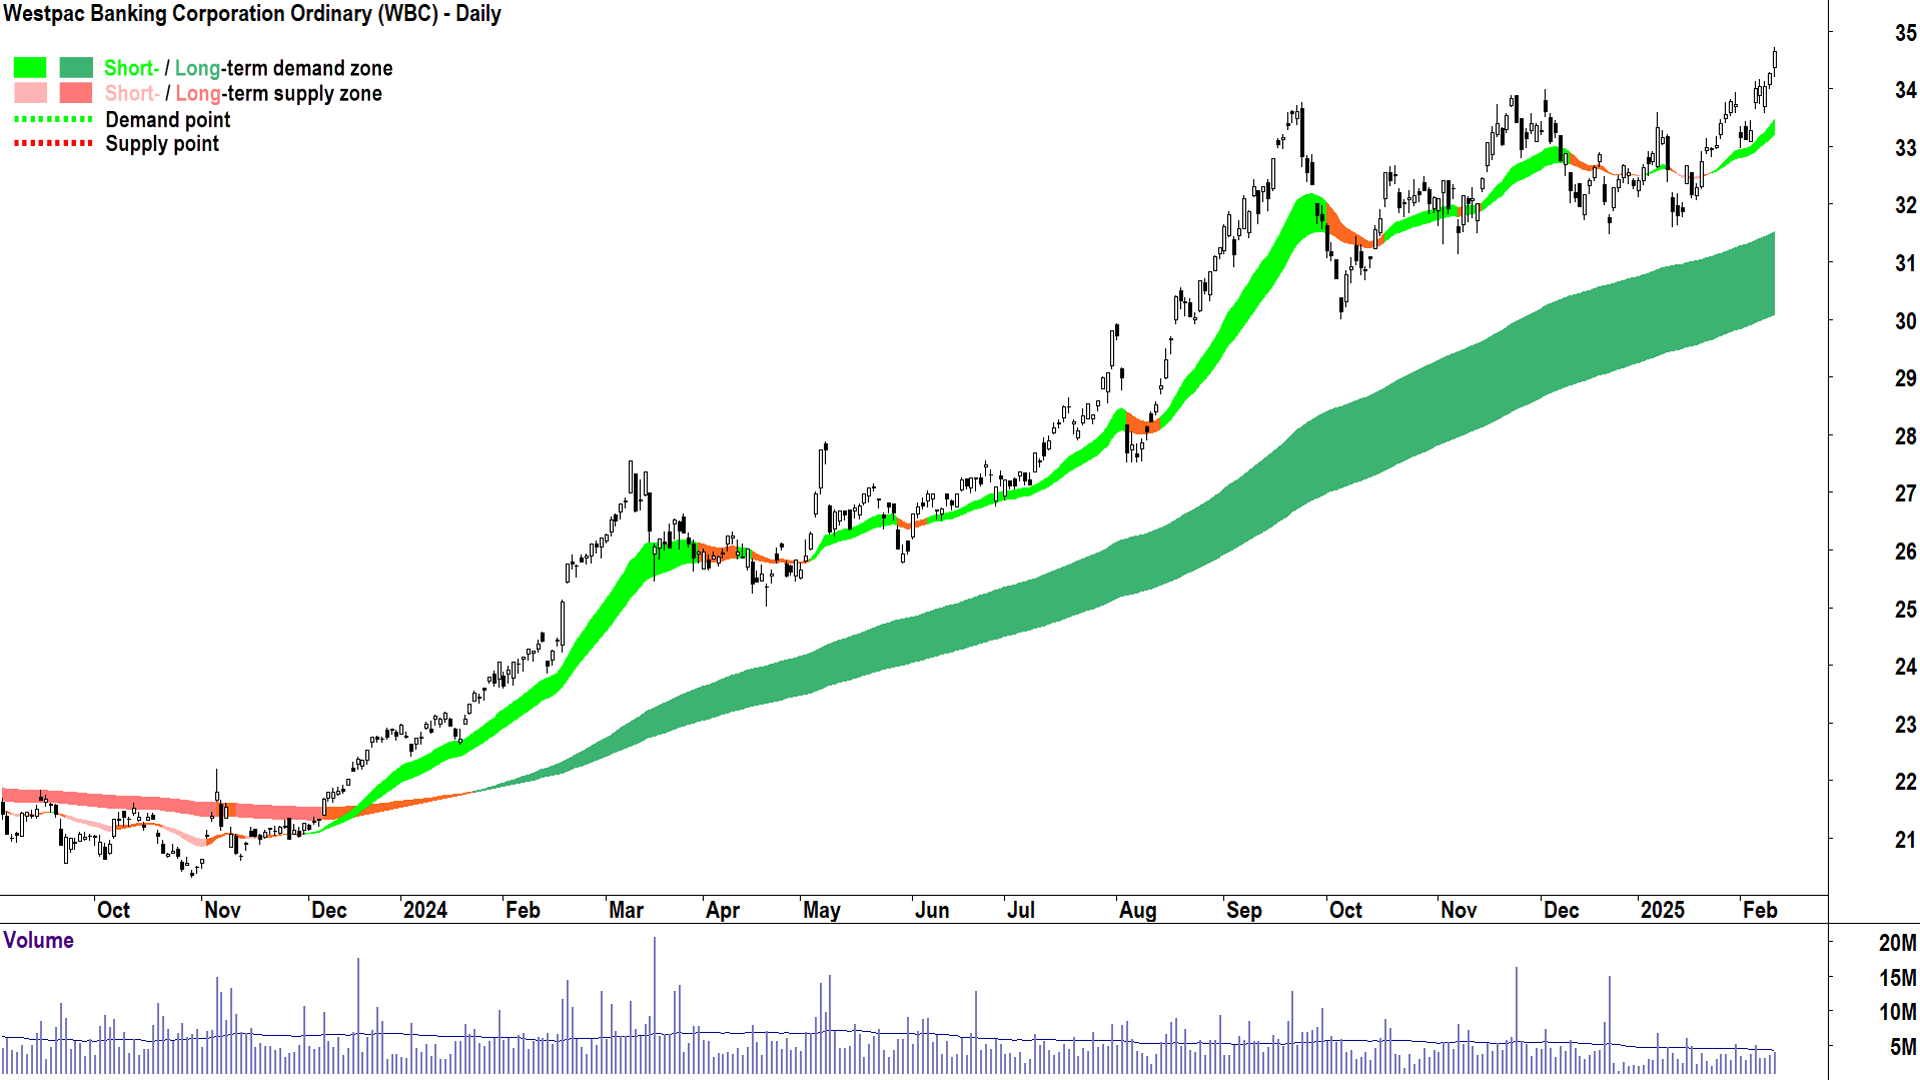
Last but not least is WBC, a ChartWatch Feature Uptrend winner 17 times. Despite it making Feature less than half the number of times as CBA, I put to you the technicals here rival CBA most closely among the Big4.
After a prolonged but shallow consolidation phase (shallow means less supply and plenty of demand lingering in the system), WBC has again broken to new highs. Trend ribbons, price action, and candles are all exemplary – and again are a picture of excess demand.
How long WBC's chart (or any chart for that matter) will stay pointing in the direction of the prevailing trend is beyond my meagre future-predicting abilities. All I can say is what I like to do: Not overthink things too much and just follow the trend. 📈💪
Economy
Today
There weren't any major data releases in our time zone today
Later this week
Wednesday
Time TBA CHN New Loans & Money Supply
New Loans January: 770 billion forecast vs 990 billion previous
M2 Money Supply January: +7.3% p.a. forecast vs +7.3% p.a. previous
Thursday
00:30 USA Core Consumer Price Index (CPI) January (+0.3% m/m and +3.2% p.a. forecast vs +0.2% m/m and +3.2% p.a. in December)
02:00 USA Federal Reserve Chairman Jerome Powell Semi-Annual Monetary Policy Report before the Senate Banking Committee - Day 2
AUS MI Inflation Expectations January (+4.0 p.a. in December)
Friday
00:30 USA Core Producer Price Index (PPI) January (+0.3% m/m and +3.3% p.a. forecast vs 0.0% m/m and +3.5% p.a. in December)
Saturday
00:30 USA Core Retail Sales January (+0.3% m/m forecast vs +0.4% m/m in December)
Latest News
Interesting Movers
Trading higher
+18.6% Bravura Solutions (BVS) - Appendix 4D and Interim Financial Report, 1H25 Results Presentation, and Final ATO Class Ruling on Capital Return, rise is consistent with prevailing short and long term uptrends, a regular in ChartWatch ASX Scans Uptrends list 🔎📈
+15.5% Computershare (CPU) - CPU 1H FY25 Half Year Report (Appendix 4D), CPU 1H FY25 Results Management Presentation, and CPU - Board Update, upgraded to outperform from hold at CLSA and price target increased to $38.70 from $30.70 (there were several other large price target increases - see Broker Moves for more details), rise is consistent with prevailing short and long term uptrends, a regular in ChartWatch ASX Scans Uptrends list 🔎📈
+15.4% Dimerix (DXB) - No news, rise is consistent with prevailing short and long term uptrends 🔎📈
+9.0% Generation Development Group (GDG) - Successful completion of institutional offer, rise is consistent with prevailing short and long term uptrends, a regular in ChartWatch ASX Scans Uptrends list 🔎📈
+9.0% Horizon Minerals (HRZ) - Phillips Find - Processing of First Ore, rise is consistent with prevailing short and long term uptrends 🔎📈
+7.5% Imdex (IMD) - Half Yearly Report and Accounts and IMDEX 1H FY25 Results Presentation, rise is consistent with prevailing short and long term uptrends, a regular in ChartWatch ASX Scans Uptrends list 🔎📈
+5.1% Audinate Group (AD8) - Becoming a substantial holder (Vanguard Group).
+4.2% Droneshield (DRO) - No news 🤔.
+4.0% Botanix Pharmaceuticals (BOT) - No news, rise is consistent with prevailing short and long term uptrends, a regular in ChartWatch ASX Scans Uptrends list 🔎📈
+3.7% McMillan Shakespeare (MMS) - Becoming a substantial holder from PPT, bounced in the wake of the recent sharp selloff.
+3.5% Lycopodium (LYL) - Half Year Results Conference Call Details, rise is consistent with prevailing short term uptrend and long term trend is transitioning from down to up 🔎📈
+3.5% Austal (ASB) - No news, rebounded after yesterday's sharp sell-off due to rating downgrade to neutral from overweight at JP Morgan.
Trading lower
-8.5% Andean Silver (ASL) - No news, general weakness across the broader Gold sector today.
-8.3% Sayona Mining (SYA) - No news, general weakness across the broader Lithium sector today, fall is consistent with prevailing short and long term downtrends, a regular in ChartWatch ASX Scans Downtrends list 🔎📉
-7.7% Peninsula Energy (PEN) - No news, fall is consistent with prevailing short and long term downtrends, a regular in ChartWatch ASX Scans Downtrends list 🔎📉
-7.2% WA1 Resources (WA1) - No news since 04-Feb West Arunta Project - Luni Metallurgical Results, today's move is consistent with recent volatility.
-7.1% Amotiv (AOV) - Appendix 4D - Half Year Report and Accounts, Half Year Results Investor Briefing and Appointment of New Director and Change of Committee Chairs.
-5.0% Fleetpartners Group (FPR) - No news, fall is consistent with prevailing short and long term downtrends, a regular in ChartWatch ASX Scans Downtrends list 🔎📉
-4.9% Perseus Mining (PRU) - No news, general weakness across the broader Gold sector today.
-4.8% Weebit Nano (WBT) - No news, fall is consistent with prevailing short and long term downtrends, a regular in ChartWatch ASX Scans Downtrends list 🔎📉
-4.8% Wildcat Resources (WC8) - No news, general weakness across the broader Lithium sector today, fall is consistent with prevailing short and long term downtrends, a regular in ChartWatch ASX Scans Downtrends list 🔎📉
Broker Moves
29METALS (29M)
Retained at equal-weight at Morgan Stanley; Price Target: $0.230 from $0.290
AGL Energy (AGL)
Retained at neutral at UBS; Price Target: $11.00
Ansell (ANN)
Downgraded to hold from buy at Jefferies; Price Target: $42.00 from $39.00
Retained at hold at Ord Minnett; Price Target: $36.20 from $31.60
Amotiv (AOV)
Retained at outperform at RBC Capital Markets; Price Target: $14.00
Retained at buy at UBS; Price Target: $13.00
Arena Reit. (ARF)
Retained at neutral at UBS; Price Target: $4.09
BHP Group (BHP)
Retained at add at Morgans; Price Target: $49.70 from $49.10
Boss Energy (BOE)
Retained at equal-weight at Morgan Stanley; Price Target: $3.25 from $2.70
Breville Group (BRG)
Retained at neutral at Citi; Price Target: $38.20 from $36.51
Upgraded to hold from underperform at CLSA; Price Target: $38.45
Retained at buy at Goldman Sachs; Price Target: $40.80 from $40.90
Retained at outperform at Macquarie; Price Target: $41.10 from $35.10
Retained at overweight at Morgan Stanley; Price Target: $40.00 from $35.00
Retained at hold at Morgans; Price Target: $33.45 from $30.05
Retained at accumulate at Ord Minnett; Price Target: $40.00 from $38.00
Retained at neutral at UBS; Price Target: $37.40 from $32.70
Bravura Solutions (BVS)
Retained at positive at E&P; Price Target: $2.21
Car Group (CAR)
Retained at buy at Citi; Price Target: $43.40 from $42.40
Retained at hold at Ord Minnett; Price Target: $39.00
Commonwealth Bank of Australia (CBA)
Retained at sell at UBS; Price Target: $115.00
Collins Foods (CKF)
Retained at buy at Citi; Price Target: $9.38
Computershare (CPU)
Retained at neutral at Citi; Price Target: $35.00
Upgraded to outperform from hold at CLSA; Price Target: $38.70 from $30.70
Retained at neutral at Goldman Sachs; Price Target: $35.50
Retained at neutral at Jarden; Price Target: $34.50 from $34.00
Retained at neutral at JP Morgan; Price Target: $34.00 from $33.50
Retained at neutral at Macquarie; Price Target: $35.00 from $34.00
Retained at equal-weight at Morgan Stanley; Price Target: $31.10
Retained at neutral at UBS; Price Target: $37.40 from $36.15
CSL (CSL)
Retained at buy at Bell Potter; Price Target: $335.00 from $345.00
Retained at buy at Citi; Price Target: $335.00 from $345.00
Retained at outperform at CLSA; Price Target: $330.00 from $337.00
Retained at buy at Goldman Sachs; Price Target: $318.40 from $316.70
Retained at outperform at Macquarie; Price Target: $360.30 from $334.00
Retained at add at Morgans; Price Target: $329.26 from $330.75
Retained at buy at Ord Minnett; Price Target: $310.00 from $318.00
Retained at sector perform at RBC Capital Markets; Price Target: $279.00 from $286.00
Retained at buy at UBS; Price Target: $310.00 from $320.00
Dicker Data (DDR)
Upgraded to overweight from equal-weight at Morgan Stanley; Price Target: $10.10 from $9.50
Deterra Royalties (DRR)
Retained at equal-weight at Morgan Stanley; Price Target: $3.95 from $3.90
Deep Yellow (DYL)
Retained at buy at Morgans; Price Target: $1.730 from $1.690
Evolution Mining (EVN)
Downgraded to hold from buy at Canaccord Genuity; Price Target: $6.15
Retained at equal-weight at Morgan Stanley; Price Target: $5.55 from $4.95
Fortescue (FMG)
Retained at hold at Morgans; Price Target: $18.90
Iluka Resources (ILU)
Retained at equal-weight at Morgan Stanley; Price Target: $4.75 from $4.90
Imdex (IMD)
Retained at sell at Citi; Price Target: $1.950
Retained at neutral at UBS; Price Target: $2.60
Incitec Pivot (IPL)
Retained at accumulate at Ord Minnett; Price Target: $3.45
Macquarie Technology Group (MAQ)
Retained at outperform at RBC Capital Markets; Price Target: $110.00
Megaport (MP1)
Retained at sector perform at RBC Capital Markets; Price Target: $10.00
Medibank Private (MPL)
Retained at equal-weight at Morgan Stanley; Price Target: $3.95 from $3.80
Macquarie Group (MQG)
Retained at sell at Citi; Price Target: $177.00
Retained at outperform at CLSA; Price Target: $245.00 from $268.00
Retained at neutral at JP Morgan; Price Target: $222.00 from $224.00
Retained at overweight at Morgan Stanley; Price Target: $253.00 from $255.00
Retained at hold at Morgans; Price Target: $218.57 from $217.21
Retained at accumulate at Ord Minnett; Price Target: $245.00
Myer (MYR)
Retained at accumulate at Ord Minnett; Price Target: $0.950
NIB (NHF)
Retained at equal-weight at Morgan Stanley; Price Target: $6.30 from $6.20
Northern Star Resources (NST)
Retained at equal-weight at Morgan Stanley; Price Target: $17.30 from $15.55
Nextdc (NXT)
Retained at outperform at RBC Capital Markets; Price Target: $20.00
Pilbara Minerals (PLS)
Retained at neutral at Macquarie; Price Target: $2.30 from $3.25
Retained at overweight at Morgan Stanley; Price Target: $2.70 from $2.55
Region Group (RGN)
Retained at buy at Citi; Price Target: $2.40 from $2.60
Downgraded to overweight from buy at Jarden; Price Target: $2.40 from $2.50
Retained at underweight at Macquarie; Price Target: $2.03
Rio Tinto (RIO)
Retained at add at Morgans; Price Target: $125.00
Reckon (RKN)
Retained at equal-weight at Morgan Stanley; Price Target: $0.580
South32 (S32)
Retained at sell at Canaccord Genuity; Price Target: $2.50
Retained at add at Morgans; Price Target: $4.30
Sandfire Resources (SFR)
Retained at underweight at Morgan Stanley; Price Target: $9.10 from $9.00
SGH (SGH)
Retained at buy at Bell Potter; Price Target: $57.00 from $53.00
Retained at buy at Goldman Sachs; Price Target: $45.90 from $45.90
Upgraded to buy from hold at Jefferies; Price Target: $61.00 from $41.30
Retained at outperform at Macquarie; Price Target: $56.10 from $51.90
Retained at accumulate at Ord Minnett; Price Target: $56.00 from $52.00
Retained at buy at UBS; Price Target: $58.65 from $56.00
Suncorp Group (SUN)
Retained at neutral at UBS; Price Target: $20.70
Seven West Media (SWM)
Retained at sell at Goldman Sachs; Price Target: $0.130 from $0.120
Retained at hold at Jefferies; Price Target: $0.200 from $0.180
Retained at neutral at JP Morgan; Price Target: $0.170
Retained at neutral at Macquarie; Price Target: $0.180 from $0.140
Retained at sell at UBS; Price Target: $0.160 from $0.150
Tower (TWR)
Retained at outperform at Macquarie; Price Target: NZ$1.55 from NZ$1.50
Vulcan Steel (VSL)
Retained at neutral at E&P; Price Target: $7.29 from $7.25
Retained at neutral at Jarden; Price Target: NZ$8.00
Retained at sector perform at RBC Capital Markets; Price Target: $7.25 from $6.50
Retained at neutral at UBS; Price Target: $7.30 from $7.10
Whitehaven Coal (WHC)
Retained at overweight at Morgan Stanley; Price Target: $9.10 from $8.95
Scans
Top Gainers
Code | Company | Last | % Chg |
|---|---|---|---|
| CRS | Caprice Resources Ltd | $0.068 | +161.54% |
| CMO | Cosmo Metals Ltd | $0.024 | +41.18% |
| FRS | Forrestania Resources Ltd | $0.014 | +40.00% |
| LAT | Latitude 66 Ltd | $0.05 | +38.89% |
| BSX | Blackstone Minerals Ltd | $0.056 | +36.59% |
Top Fallers
Code | Company | Last | % Chg |
|---|---|---|---|
| S66 | Star Combo Pharma Ltd | $0.13 | -18.75% |
| EV1 | Evolution Energy Minerals Ltd | $0.015 | -16.67% |
| TRM | Truscott Mining Corporation Ltd | $0.075 | -16.67% |
| ARI | Arika Resources Ltd | $0.033 | -15.39% |
| HMG | Hamelin Gold Ltd | $0.055 | -15.39% |
52 Week Highs
Code | Company | Last | % Chg |
|---|---|---|---|
| CRS | Caprice Resources Ltd | $0.068 | +161.54% |
| BXN | Bioxyne Ltd | $0.052 | +30.00% |
| BVS | Bravura Solutions Ltd | $2.74 | +18.62% |
| CPU | Computershare Ltd | $41.53 | +15.49% |
| COY | Coppermoly Ltd | $0.014 | +7.69% |
52 Week Lows
Code | Company | Last | % Chg |
|---|---|---|---|
| EV1 | Evolution Energy Minerals Ltd | $0.015 | -16.67% |
| LLI | Loyal Lithium Ltd | $0.08 | -11.11% |
| LOM | Lucapa Diamond Company Ltd | $0.016 | -11.11% |
| CC9 | Chariot Corporation Ltd | $0.081 | -10.00% |
| BDM | Burgundy Diamond Mines Ltd | $0.047 | -9.62% |
Near Highs
Code | Company | Last | % Chg |
|---|---|---|---|
| WVOL | Ishares MSCI World Ex Aust Minimum Volatility ETF | $43.50 | -0.23% |
| AII | Almonty Industries Inc | $2.35 | +2.17% |
| IAGPF | Insurance Australia Group Ltd | $105.10 | -0.18% |
| GCI | Gryphon Capital Income Trust | $2.05 | +0.99% |
| CTD | Corporate Travel Management Ltd | $15.41 | -1.34% |
Relative Strength Index (RSI) Oversold
Code | Company | Last | % Chg |
|---|---|---|---|
| VUL | Vulcan Energy Resources Ltd | $4.02 | -2.19% |
| PLY | Playside Studios Ltd | $0.21 | +7.69% |
| RFG | Retail Food Group Ltd | $1.93 | -4.46% |
| PXA | Pexa Group Ltd | $11.85 | -0.17% |
| CRN | Coronado Global Resources Inc | $0.61 | -1.61% |
