News | Market Wraps
Evening Wrap: ASX 200 rallies as hopes grow low is in! Tech, gold, banks best, as uranium rally gains momentum
The S&P/ASX 200 closed 90.6 points higher, up 1.16%.

Mentioned
The S&P/ASX 200 closed 90.6 points higher, up 1.16%.
Finally a day for Aussie investors to cheer, and no doubt one that has brought substantial relief to many.
Beaten down Information Technology, Real Estate, Banking, Health Care, and Consumer Discretionary stocks recouped some of their recent heavy correction falls.
In resources, particularly strong gains were seen in both Gold and Uranium stocks as the prices of each of those underlying commodities rallied overnight.
There were losers, though, with iron ore stocks like BHP, RIO, and FMG each seeing heavy falls, as did many lithium stocks (the lithium price was sharply lower in China today).
Click/scroll through for the usual reporting of the major sector and stock-specific moves, the broker responses to them, as well as all the key upcoming economic data in tonight's Evening Wrap.
Also, I have detailed technical analysis on the NASDAQ Composite, ASX 200, Copper, and Uranium in today's ChartWatch.
Let's dive in!
Today in Review
Thu 20 Mar 25, 5:20pm (AEST)
Name | Value | % Chg |
|---|---|---|
Major Indices | ||
| ASX 200 | 7,918.9 | +1.16% |
| All Ords | 8,148.9 | +1.16% |
| Small Ords | 3,073.8 | +1.57% |
| All Tech | 3,537.0 | +2.22% |
| Emerging Companies | 2,250.2 | +1.13% |
Currency | ||
| AUD/USD | 0.6338 | -0.30% |
US Futures | ||
| S&P 500 | 5,705.0 | +0.47% |
| Dow Jones | 42,130.0 | +0.32% |
| Nasdaq | 19,870.75 | +0.63% |
Name | Value | % Chg |
|---|---|---|
Sector | ||
| Information Technology | 2,382.9 | +2.42% |
| Real Estate | 3,640.2 | +2.06% |
| Financials | 8,206.7 | +1.86% |
| Health Care | 41,757.9 | +1.76% |
| Consumer Discretionary | 3,803.8 | +1.44% |
| Industrials | 7,735.9 | +1.30% |
| Energy | 8,018.4 | +1.11% |
| Communication Services | 1,652.9 | +1.03% |
| Consumer Staples | 11,351.4 | +0.28% |
| Utilities | 9,069.2 | -0.19% |
| Materials | 16,509.3 | -0.63% |
Markets

ASX 200 Session Chart
The S&P/ASX 200 (XJO) finished 90.6 points higher at 7,918.9, 1.16% from its session low and just 0.16% from its high. In the broader-based S&P/ASX 300 (XKO), advancers beat decliners by an emphatic margin for the second day in a row – this time by an impressive 229 to 50.
It was broad risk-on rally today. Geez, I haven’t written those words in a while – certainly not since before the Valentine’s Day peak.
But it was, and it largely backed out the themes of dump anything high-PE-high-momentum that was so much the feature of the recent rout in many associated names. The main driver of today's fund flows was undoubtedly the sharp fall in risk-free market yields overnight.
The falls followed US Federal Reserve Chairman Jerome Powell’s post FOMC-meeting speech which was largely considered dovish by markets.


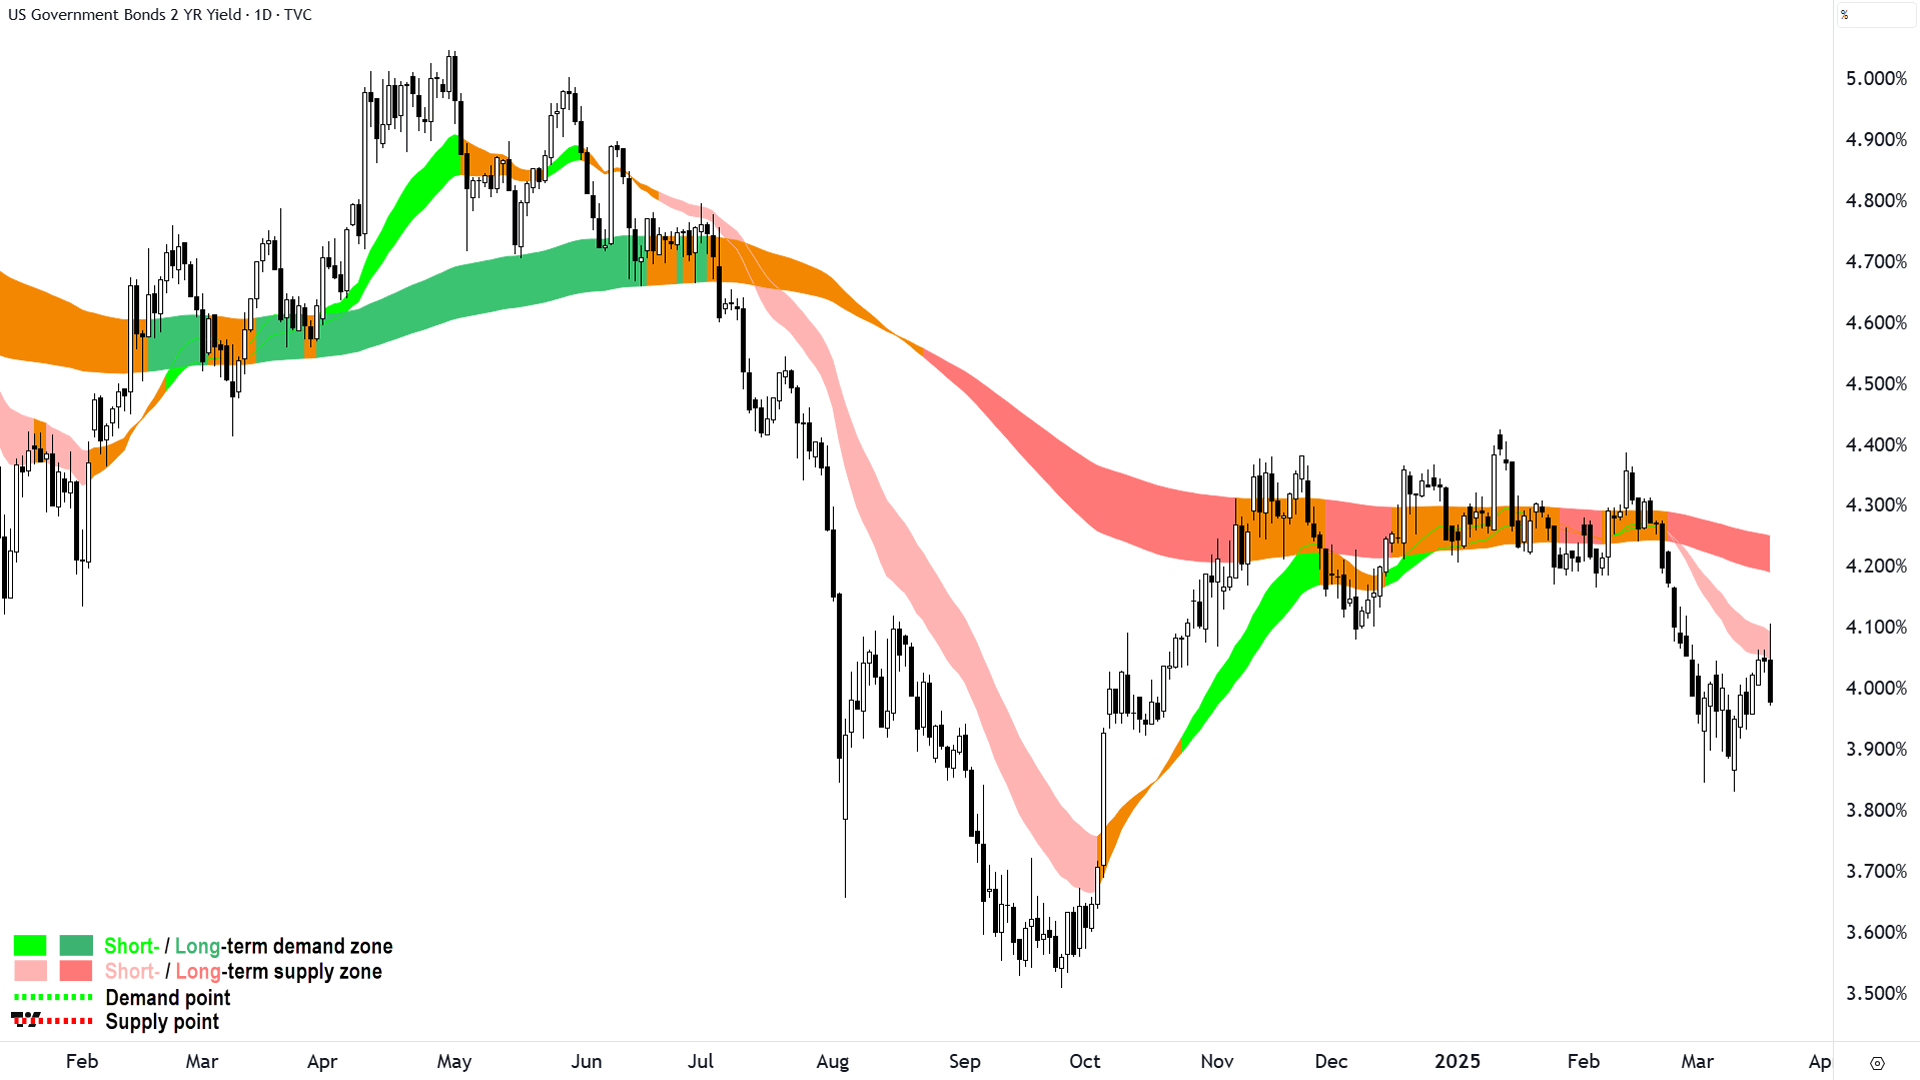
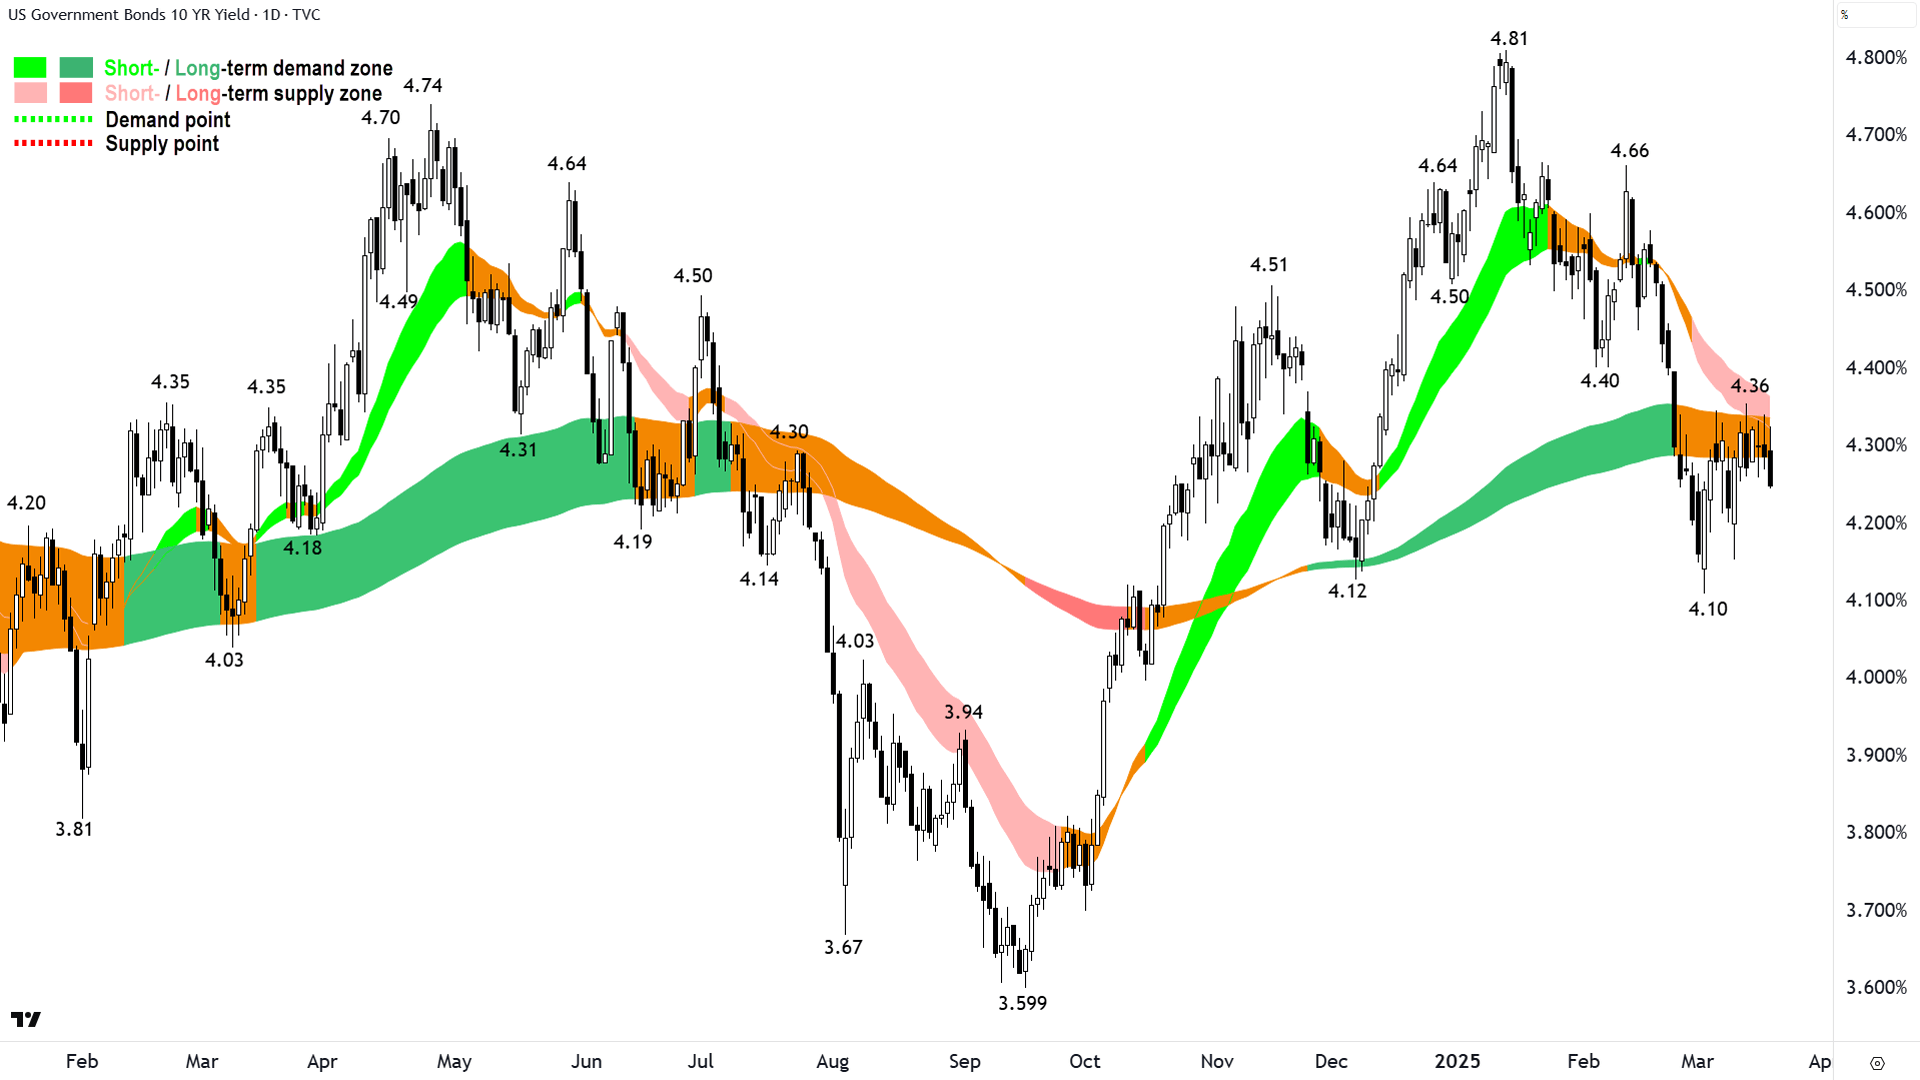
US 2-year (top) and 10-year (bottom) T-Bond Yields (click here and click here for full size images)
If you’ve been suffering through these Evening Wraps for any length of time, you'll know that the charts above, of short and longer term risk-free yields, are the most important charts any market analyst can peruse any day. This is because yields such as these set the cost of risk-free money – and therefore the price of all other assets.
The fall in yields overnight is partly due to the belief the Fed will at some point ride to the US economy’s and the market’s rescue with lower official rates (good), but also that probably at some point also – President Trump’s trade policies could wreck the US economy (bad).
You could say, a little bitter-sweet!
So, top of the winners list today was crowded with interest rate sensitives…the high-PE-high-momentum stocks that were so unceremoniously taken out the back of the coal shed and beaten over the last few weeks of this correction.
Think Information Technology (XIJ) (+2.4%), today’s best performing sector, and similarly about as high-PE as you can get on the ASX. A very broad-based rally here – with big and small constituents rising in unison.
Tech was followed by bond proxy Real Estate Investment Trusts (XPJ) (+2.1%), but – to be fair – there’s plenty of “twist of high-PE-high-momentum” in here too – as so much of the sector’s rise into the correction was driven by pin-up momentum-AI-data centre plays Goodman Group (ASX: GMG) (+2.8%) and HMC Capital (ASX: HMC) (+1.7%).
Gold is also acutely interest rate sensitive, as it doesn’t have a yield, which means there’s an opportunity cost in owning it. The lower the risk-free rate (as risk-free bonds are seen as a direct alternative to gold in the safe-haven stakes) the lower is the opportunity cost of owning gold. So, it should be no surprise that the Gold (XGD) sub-index (+2.1%) also logged a solid gain today.
Financials (XFJ) (+1.9%), Health Care (XHJ) (+1.8%), and Consumer Discretionary (XDJ) (+1.4%) round off the list of major ASX sectors that beat the benchmark ASX 200 today. Each either high momentum or high-PE – and each reversing out some of their heavy correction falls.
There were losers today, though. The switch back to high-PE meant there were fewer investment dollars remaining for the likes of recent low-PE winners like Resources (XJR) (-0.20%), and typically defensive sectors that also held up well in the correction like Utilities (XUJ) (-0.19%) and Consumer Staples (XSJ) (+0.28%).
Resources would have been far worse if not for that strong performance by gold stocks – copper stocks also prospered on a sharp gain in the copper price overnight (I have detailed technical analysis for you in ChartWatch below).
Iron ore stocks were the main drag, probably a delayed response to recent iron ore price weakness. Fortescue (ASX: FMG) (-3.3%) was the worst, but BHP Group (ASX: BHP) (-1.1%) and Rio Tinto (ASX: RIO) (-1.0%) notched +1% falls.
The other lowlight in Resources was in lithium stocks. They’d received a bit of a bump recently on (probably) some short covering, and maybe even a modest swing back to value. I say maybe, because it’s all just excuses unless you go and ask every buyer and every seller why they did what they did. 🤔
What I can say, with certainty, is that the recent strength in ASX lithium stocks was not due to a corresponding resurgence in lithium prices. Those have remained in the doldrums, and they lurched even further into those doldrums today, with benchmark May GFEX lithium carbonate futures down another -2.6% in China.
One other beaten down bright spot lately is uranium – with stocks in that sector also recently putting in an abnormally large rally compared to their respective underlying commodity. But, today, one could argue that their strength was justified given the tidy gain in the uranium price overnight (again, detailed technical analysis for you in ChartWatch below).
That rise in the uranium price was most likely due to Kazatomprom’sFY24 results released Wednesday, in which it indicated production could be at the lower end of its guidance range (which potentially equals a bit less uranium supply than the market was expecting, and so it was considered a positive for the uranium price).
ChartWatch
NASDAQ Composite Index

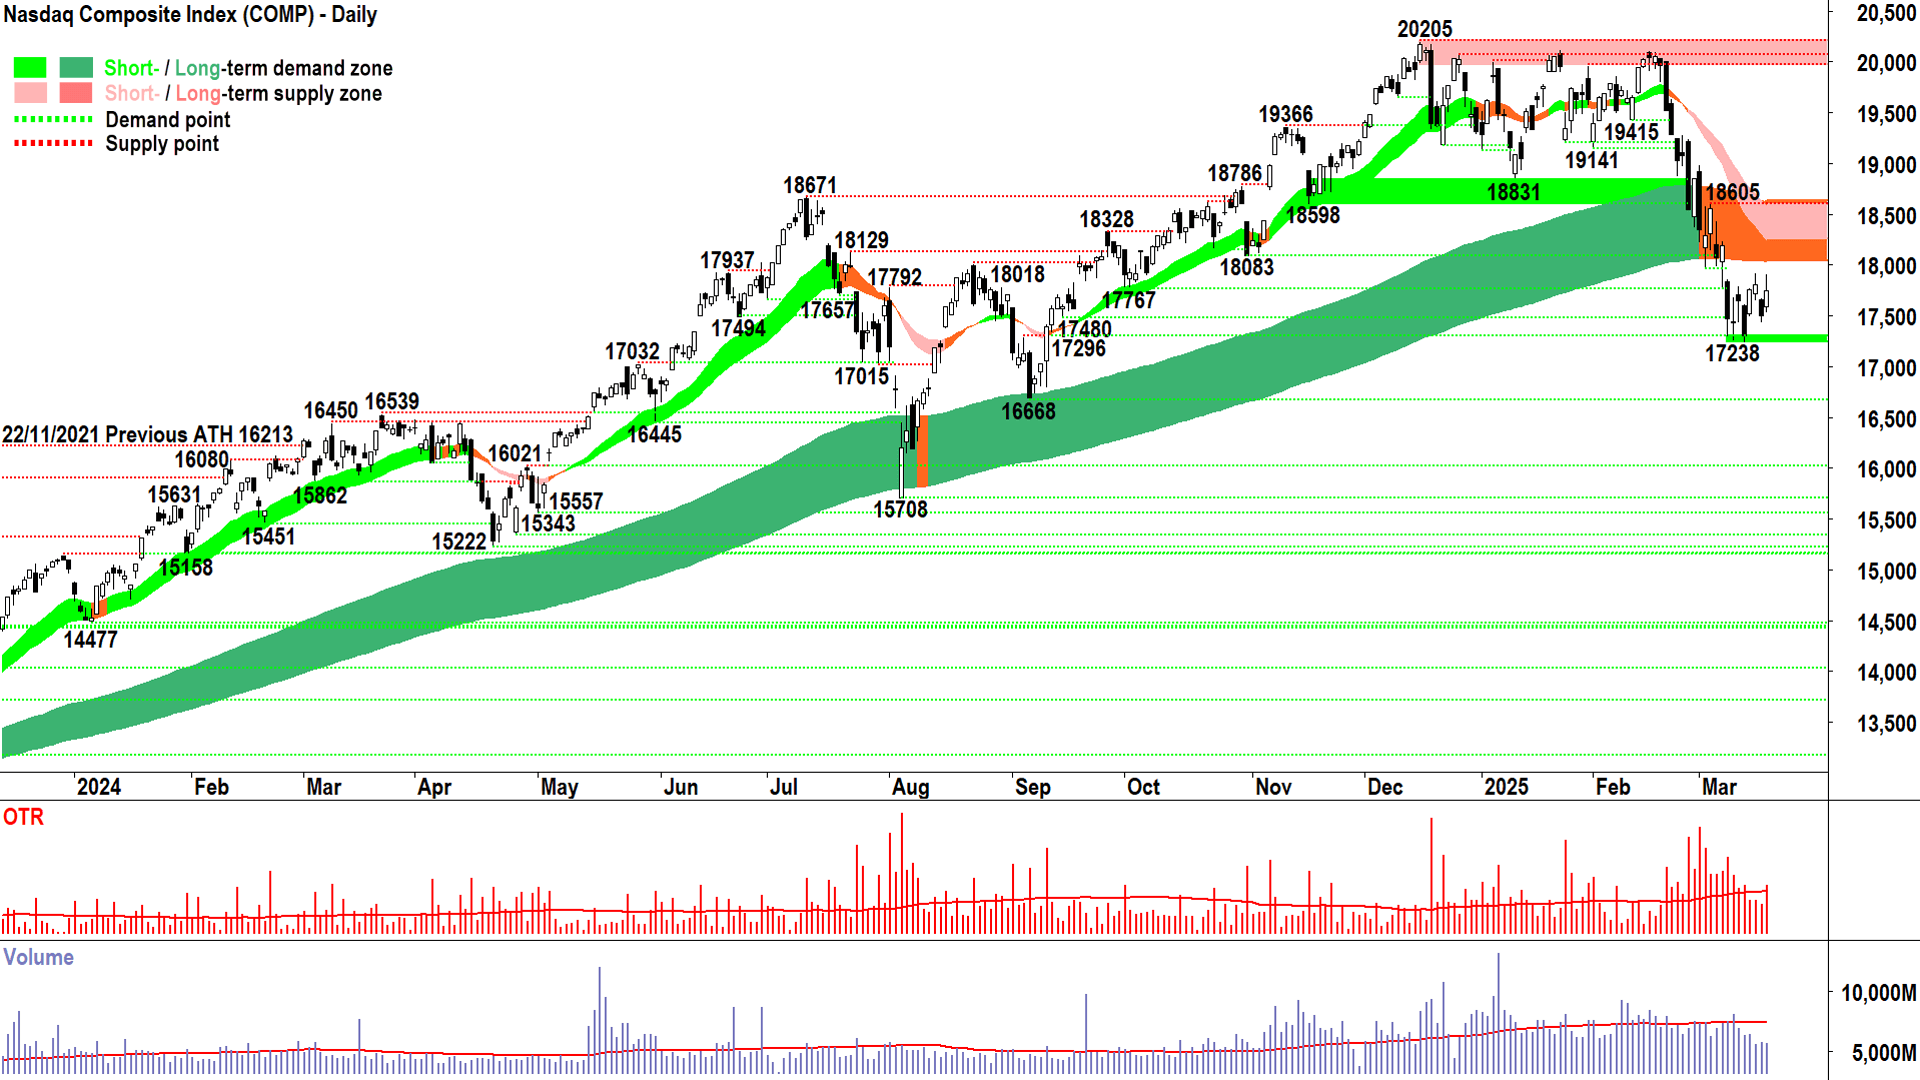
A dark orange cloud overhands the Comp... (click here for full size image)
Either we’re (the XJO) leading the Comp, or we’ve jumped the gun with today’s heroics – because there’s still plenty to be concerned about with respect to the chart above.
Whatever the headlines regarding Chairman Powell’s speech, not all investors bought into the “Fed will cut rates and save our ass(ets)” narrative.
How can you tell? The upward pointing shadow on Wednesday’s candle. Still, though, it ended white – and therefore it’s at worst an indecision candle (not a supply-side one).
I still seems to me, however, that the long term trend ribbon is overhanging the Comp like a dark cloud (well, an orange cloud actually). It must be dealt with, or the results will likely be severe ⚠️.
Wednesday gave us yet another zebra result, as markets continue to flip-flop between hope and despair. I for one, remain hopeful that we can in time regain the faith of the demand and supply sides and reclaim the long term uptrend ribbon.
Until we do – the lack of trend require me to operate at minimum risk levels. Not out – still open to opportunities in great trends (both up and down) as they present themselves – but substantially cautious.
17238 remains the key point of demand. A close beneath it and I propose it’s gonna hurt! 🤕
S&P/ASX 200 (XJO)
%20chart%2020%20March%202025.png)
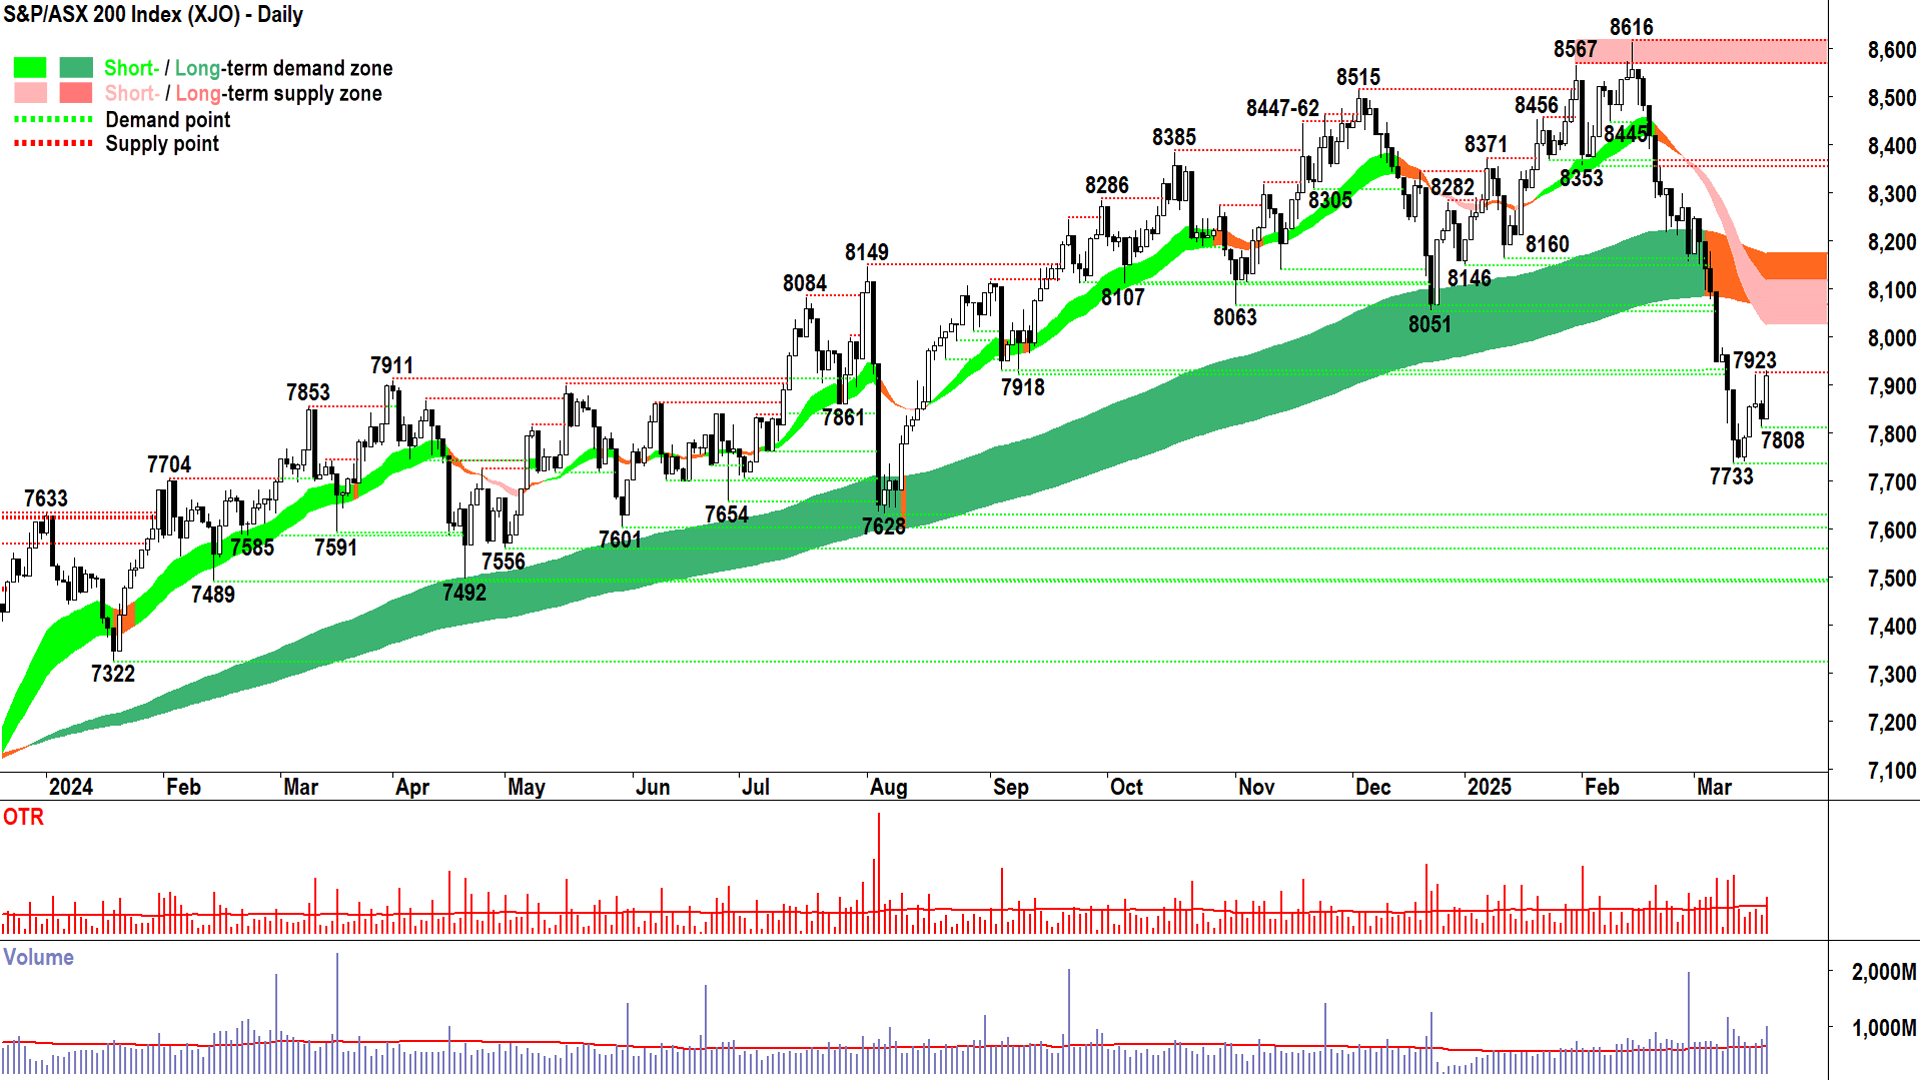
Well that was quite the turn of events! ♻️ (click here for full size image)
A big white candle. Closed very near the high of the session. Accompanied by a very decent volume showing 💪.
Add in the fact that today’s candle set yesterday’s low as a new, rising trough/point of demand, and we closed so close to the 7923 point of supply (suggesting there's not really much supply there…).
It's the sort of bunch of techincals that could easily lead one to believe that the low is in.
There, I said it.
Today’s price action in my opinion, dramatically increases the probability that we’ve just seen the low of this pesky Valantine’s Day correction.
I’ll keep saying this until:
The XJO closes below 7733 – that’s obvious – and as above for Comp 17238 = severe pain below there…😭
I see big supply-side candles (i.e., black-bodied and or those with upward pointing shadows) in the short-long term ribbon overlap zone…or it could be a prolonged cluster of smaller ones…
Those above-noted candles lead to the formation of a peak followed by a lower peak in the short-long term ribbon overlap zone (thus indicating building supply and a lack of demand-side impetus).
So, I suggest today is a reason to be optimistic, but not ecstatic.
The next few candles and short term price action will tell us how control is potentially shifting from the supply to the demand-side – or whether the supply-side is merely waiting for better prices to get out – and get out big! 🥊
High Grade Copper Futures (Front month, back-adjusted) COMEX
%20COMEX%20chart%2020%20March%202025.png)
Hot copper 🔥 (click here for full size image)
You will see this analysis repeated in a dedicated feature I am doing on copper tomorrow:
I note both short and long term uptrends (represented by the light green and dark green ribbons) are well-established, and both trend ribbons appear to be acting as zones of dynamic demand (the price action is bouncing off them). This is consistent with strong demand-side control and a healthy bull market.
The price action, i.e., the relative positioning of peaks and troughs is rising peaks and rising troughs, a signal of supply removal and demand reinforcement. Candles are predominantly demand-side in nature (i.e., white-bodied and or with downward pointing shadows). Both factors are consistent with strong demand-side control and a healthy bull market.
However, and here’s a bit of a short-term sticking point – I do expect there to be a substantial amount of excess supply in a wide zone defined by the 28 May peak of 5.0845 and up to the ‘big one’ a smaller zone defined by the 20 May peak of 5.3805 and the 7 Mar 2022 major peak of 5.3935.
So, as good as copper looks, and as good as the signs are that the demand-side remains firmly in control of its price – we could start to see the fingerprints of excess supply creep in from here. By this, I mean investors should be attentive for:
A growing prevalence and increased size of supply side candles (i.e., black-bodied and or those with upward pointing shadows
These supply-side candles develop into a peak, or series of falling peaks in the supply zone, and or into a series of falling troughs.
The price closing below the short term trend ribbon.
But I am not a trend prognosticator – this is a futile exercise as the future is unknown – I am a trend follower. So, until I see the fingerprints of excess supply listed above, I have no reason to doubt the prevailing short and long term uptrends.
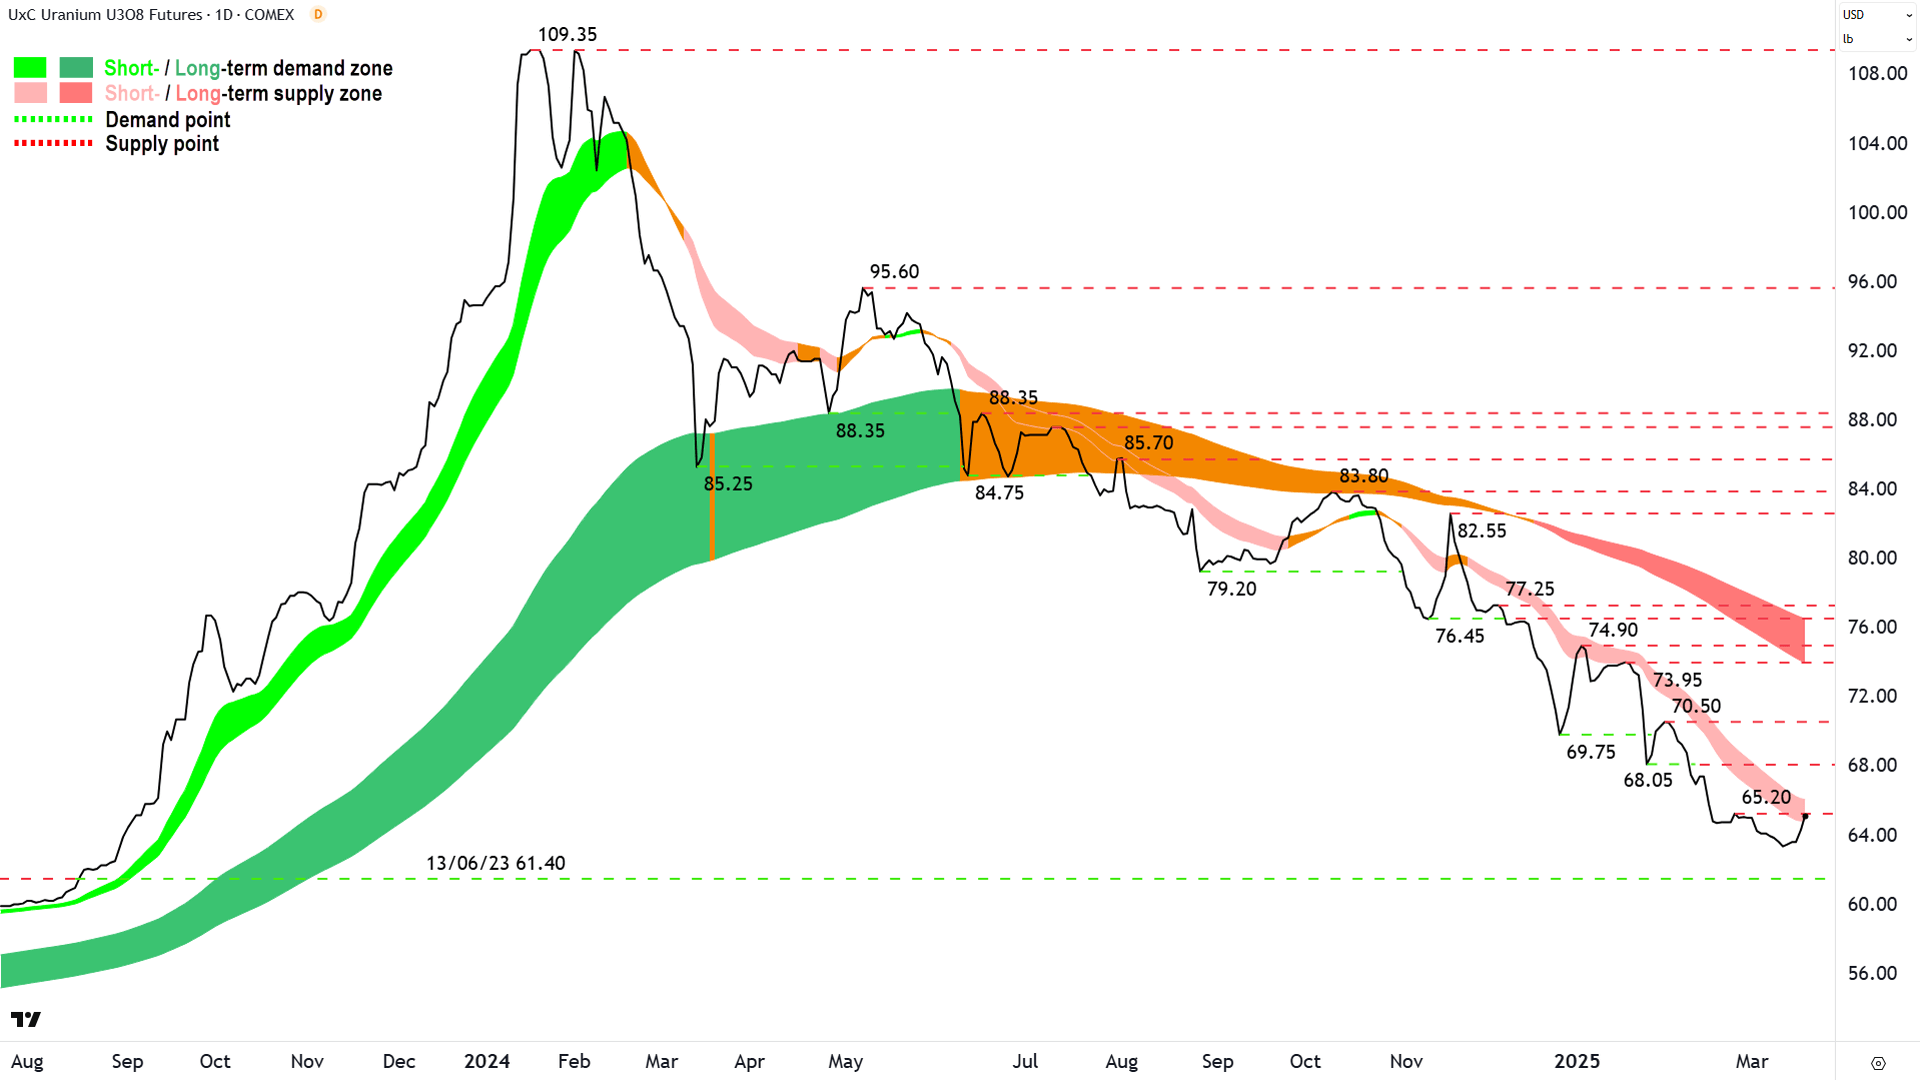
Uranium Futures (Front month, back-adjusted) COMEX
%20COMEX%20chart%2019%20March%202025.png)
Here we go again...🤦 (click here for full size image)
Just a quickie here because not much has really changed with respect to uranium's techncials: short term downtrend, long term downtrend.
But, I do note the recent modest rally extended last night with its biggest gain so far – if only to run smack-bank into the dynamic supply of the short term downtrend ribbon.
That ribbon has killed the last half-dozen similar rallies, and I can't see anything in the chart above to suggest this time won't be the same.
But, no trend lasts forever, and the next bull market in uranium may have started a few days ago.
Don't get too excited, my point is: I just don't know. There's an uptick – that we know – and the next bit of price action, the next, and so on will tell us if this little rally has any legs...
Or if it's just another false dawn and the supply-side remains firmly in control of the uranium price as indicated by absolutely everything else on the chart!
Economy
Today
AUS Employment Change February
-52,800 actual vs +31,400 forecast vs +44,000 in January
Unemployment Rate: unchanged at 4.1% as forecast
Participation rate fell to 66.8 from 67.0%, explains why the unemployment rate held steady despite the contraction in number of employed people
ABS attributed fall to seasonal effects and fewer older workers returning to work in February
CHN Bank of China Prime Loan Rates
1-year PLR: unchanged at 3.1% as forecast
5-year PLR: unchanged at 3.6% as forecast
Later this week
Thursday
22:00 USA Existing Home Sales February (3.94 million forecast vs 4.08 million in January)
Friday
No major economic data releases are scheduled for this day
Latest News
Interesting Movers
Trading higher
+14.5% Findi (FND) - Findi Completes Strongly supported A$40m placement and FND Capital Raising Presentation.
+14.3% CZR Resources (CZR) - Fenix receives acceptances for 10% of CZR, rise is consistent with prevailing short term uptrend and long term trend is transitioning from down to up 🔎📈
+14.0% Nanosonics (NAN) - Nanosonics Receives FDA De Novo Clearance for CORIS, rise is consistent with prevailing short and long term uptrends, a recent regular in ChartWatch ASX Scans Uptrends list 🔎📈
+13.3% Felix Gold (FXG) - No news, general strength across the broader Gold sector today.
+10.6% Live Verdure (LV1) - No news, bounced perfectly from long term uptrend ribbon! 🔎📈
+8.6% 29METALS (29M) - No news, general strength across the broader Copper sector today.
+8.4% Boss Energy (BOE) - No news since 19-Mar Ceasing to be a substantial holder (looks like a short seller pulling out), general strength across the broader Uranium sector today, today’s move likely due to rise in uranium price overnight - that move likely on the back of the Kazatomprom FY24 results released Wednesday in which it indicated production could be at the lower end of guidance range (equals a bit less uranium supply, so market took it as a positive for the uranium price).
+8.1% Lotus Resources (LOT) - No news since 19-Mar Investor Presentation - March 2025, general strength across the broader Uranium sector today, ditto BOE / uranium.
+7.4% EBR Systems (EBR) - No news, rise is consistent with prevailing short and long term uptrends, a regular in ChartWatch ASX Scans Uptrends list 🔎📈
+7.0% AIC Mines (A1M) - Drilling Commences at Jericho, general strength across the broader Copper sector today, rise is consistent with prevailing short term uptrend and long term trend is transitioning from down to up, a recent regular in ChartWatch ASX Scans Uptrends list 🔎📈
+7.0% Weebit Nano (WBT) - No news, general strength across the broader Information Technology sector today.
+6.8% Mesoblast (MSB) - No news, general strength across the broader HealthCare sector today.
+6.6% Echoiq (EIQ) - No news, rise is consistent with prevailing short and long term uptrends, a regular in ChartWatch ASX Scans Uptrends list 🔎📈
+5.9% TPG Telecom (TPG) - TPG welcomes ACCC clearance of sale to Vocus.
+5.7% Predictive Discovery (PDI) - Change of Director's Interest Notice, (on market purchase of 447,500 shares valued at $156,222).
+5.2% Deep Yellow (DYL) - No news, general strength across the broader Uranium sector today, ditto BOE / uranium.
+5.1% BetaShares Crypto Innovators ETF (CRYP) - No news, big bounce in major cryptos overnight following Federal Reserve Chairman Powell comments.
+5.1% Nexgen Energy (NXG) - No news, general strength across the broader Uranium sector today, ditto BOE / uranium.
+5.1% Silex Systems (SLX) - No news, general strength across the broader Uranium sector today, ditto BOE / uranium.
+5.1% Audinate Group (AD8) - No news, general strength across the broader Information Technology sector today.
+5.0% Black Cat Syndicate (BC8) - No news, general strength across the broader Gold sector today, rise is consistent with prevailing short and long term uptrends, a regular in ChartWatch ASX Scans Uptrends list 🔎📈
+4.8% Bannerman Energy (BMN) - No news, general strength across the broader Uranium sector today, ditto BOE / uranium.
Trading lower
-7.5% Imugene (IMU) - No news since 19-Mar Azer-cel Granted FDA Fast Track Designation in Blood Cancer, fall is consistent with prevailing short and long term downtrends, a regular in ChartWatch ASX Scans Downtrends list 🔎📉
-6.2% Judo Capital (JDO) - No news, a block trade representing 9.9% of shares on issue was executed at $1.74 after the market closed yesterday (approx. 6% below last traded price).
-5.3% Myer (MYR) - Continued negative response to 19-Mar Half-Year Results - Release and Presentation, fall is consistent with prevailing short and long term downtrends, a regular in ChartWatch ASX Scans Downtrends list 🔎📉
-5.0% Spark New Zealand (SPK) - No news, ex-div NZ$0.14154412 (approx. $0.1081) unfranked, fall is consistent with prevailing short and long term downtrends, a regular in ChartWatch ASX Scans Downtrends list 🔎📉
-4.8% James Hardie Industries (JHX) - No news, fall is consistent with prevailing short and long term downtrends, a recent regular in ChartWatch ASX Scans Downtrends list 🔎📉
-4.8% Liontown Resources (LTR) - No news, general weakness across the broader Lithium sector today, benchmark May GFEX lithium carbonate futures sharply lower (-2.6%) in China today, fall is consistent with prevailing long term downtrend 🔎📉
-4.6% IDP Education (IEL) - No news, fall is consistent with prevailing short and long term downtrends, one of the most Featured (highest conviction) stocks in ChartWatch ASX Scans Downtrends list 🔎📉
-4.1% IPD Group (IPG) - No news, repelled perfectly from long term downtrend ribbon! 🔎📉
-3.3% Fortescue (FMG) - No news, fall is consistent with prevailing short and long term downtrends, a regular in ChartWatch ASX Scans Downtrends list 🔎📉
-3.0% Lifestyle Communities (LIC) - No news, fall is consistent with prevailing short and long term downtrends, a regular in ChartWatch ASX Scans Downtrends list 🔎📉
Broker Moves
AIC Mines (A1M)
Retained at buy at Shaw and Partners; Price Target: $1.000
Auckland International Airport (AIA)
Retained at buy at Citi; Price Target: NZ$9.80
Atlas Arteria (ALX)
Retained at buy at Citi; Price Target: $5.70
Ansell (ANN)
Initiated at equal-weight at Morgan Stanley; Price Target: $37.20
ANZ Group (ANZ)
Retained at equal-weight at Morgan Stanley; Price Target: $29.30 from $27.20
Arena Reit. (ARF)
Retained at neutral at UBS; Price Target: $4.10
Arafura Rare Earths (ARU)
Retained at buy at Canaccord Genuity; Price Target: $0.300
Brickworks (BKW)
Retained at buy at Citi; Price Target: $32.50
BWP Trust (BWP)
Retained at buy at UBS; Price Target: $4.05
Commonwealth Bank of Australia (CBA)
Retained at underweight at Morgan Stanley; Price Target: $128.00 from $127.00
Codan (CDA)
Upgraded to outperform from neutral at Macquarie; Price Target: $17.00 from $17.13
Challenger (CGF)
Upgraded to buy from hold at Ord Minnett; Price Target: $7.00 from $6.65
Charter Hall Group (CHC)
Retained at neutral at Macquarie; Price Target: $17.15
Retained at sell at UBS; Price Target: $15.49
Centuria Industrial Reit (CIP)
Retained at buy at UBS; Price Target: $3.82
Charter Hall Long Wale Reit (CLW)
Retained at neutral at UBS; Price Target: $4.18
Capricorn Metals (CMM)
Retained at neutral at Macquarie; Price Target: $8.20 from $8.10
Centuria Capital Group (CNI)
Retained at sell at UBS; Price Target: $1.740
Centuria Office Reit (COF)
Retained at sell at UBS; Price Target: $1.140
Cochlear (COH)
Initiated at underweight at Morgan Stanley; Price Target: $267.00
Charter Hall Retail Reit (CQR)
Retained at buy at UBS; Price Target: $3.69
CSL (CSL)
Initiated at overweight at Morgan Stanley; Price Target: $313.00
Cleanaway Waste Management (CWY)
Retained at outperform at RBC Capital Markets; Price Target: $3.40 from $3.30
DigiCo REIT (DGT)
Retained at buy at Goldman Sachs; Price Target: $5.80
Dexus (DXS)
Retained at outperform at Macquarie; Price Target: $8.08
Retained at buy at UBS; Price Target: $9.02
Fisher & Paykel Healthcare Corporation (FPH)
Initiated at equal-weight at Morgan Stanley; Price Target: $36.30
Goodman Group (GMG)
Retained at overweight at Macquarie; Price Target: $36.31
Retained at neutral at UBS; Price Target: $36.80
GPT Group (GPT)
Retained at buy at Citi; Price Target: $5.00
Retained at overweight at Macquarie; Price Target: $5.38
Retained at neutral at UBS; Price Target: $5.29
Homeco Daily Needs Reit (HDN)
Retained at buy at UBS; Price Target: $1.350
HMC Capital (HMC)
Retained at buy at Goldman Sachs; Price Target: $12.30
Retained at buy at UBS; Price Target: $12.40
Ingenia Communities Group (INA)
Retained at neutral at UBS; Price Target: $6.30
Judo Capital (JDO)
Upgraded to add from hold at Morgans; Price Target: $2.08
Lindsay Australia (LAU)
Retained at buy at Ord Minnett; Price Target: $1.020
Lifestyle Communities (LIC)
Retained at buy at UBS; Price Target: $10.20
Lendlease Group (LLC)
Retained at overweight at Macquarie; Price Target: $7.24
Retained at sell at UBS; Price Target: $6.38
Mirvac Group (MGR)
Retained at overweight at Macquarie; Price Target: $2.56
Retained at neutral at UBS; Price Target: $2.28
Myer (MYR)
Retained at overweight at Morgan Stanley; Price Target: $1.050 from $1.100
Retained at accumulate at Ord Minnett; Price Target: $0.860 from $0.950
National Australia Bank (NAB)
Downgraded to equal-weight from overweight at Morgan Stanley; Price Target: $34.80 from $37.40
National Storage Reit (NSR)
Upgraded to buy from hold at Moelis Australia; Price Target: $2.37
Retained at neutral at UBS; Price Target: $2.59
Nextdc (NXT)
Retained at buy at Goldman Sachs; Price Target: $17.10
Premier Investments (PMV)
Upgraded to buy from neutral at UBS; Price Target: $24.00 from $30.00
RAM Essential Services Property Fund (REP)
Retained at buy at UBS; Price Target: $0.750
Rural Funds Group (RFF)
Retained at neutral at UBS; Price Target: $1.840
Region Group (RGN)
Retained at neutral at UBS; Price Target: $2.30
Ramsay Health Care (RHC)
Initiated at equal-weight at Morgan Stanley; Price Target: $36.10
Retained at hold at Ord Minnett; Price Target: $37.50
Resmed Inc (RMD)
Initiated at overweight at Morgan Stanley; Price Target: $280.00
Scentre Group (SCG)
Retained at neutral at UBS; Price Target: $3.74
Stockland (SGP)
Retained at neutral at UBS; Price Target: $5.37
Sonic Healthcare (SHL)
Initiated at equal-weight at Morgan Stanley; Price Target: $28.10
Sigma Healthcare (SIG)
Retained at neutral at Citi; Price Target: $2.90
Transurban Group (TCL)
Retained at neutral at Citi; Price Target: $13.80
Unibail-Rodamco-Westfield (URW)
Retained at neutral at UBS; Price Target: $6.91
Vicinity Centres (VCX)
Retained at neutral at UBS; Price Target: $2.27
Westpac Banking Corporation (WBC)
Retained at underweight at Morgan Stanley; Price Target: $27.30
Webjet (WJL)
Downgraded to hold from add at Morgans; Price Target: $0.650 from $1.050
Scans
Top Gainers
Code | Company | Last | % Chg |
|---|---|---|---|
| TOU | Tlou Energy Ltd | $0.04 | +122.22% |
| D3E | D3 Energy Ltd | $0.074 | +42.31% |
| BRX | Belararox Ltd | $0.12 | +33.33% |
| CYB | Aucyber Ltd | $0.095 | +28.38% |
| AKM | Aspire Mining Ltd | $0.275 | +27.91% |
Top Fallers
Code | Company | Last | % Chg |
|---|---|---|---|
| BSA | BSA Ltd | $0.063 | -25.88% |
| GLH | Global Health Ltd | $0.11 | -18.52% |
| BUX | Buxton Resources Ltd | $0.032 | -17.95% |
| ICE | Icetana Ltd | $0.015 | -16.67% |
| ION | Iondrive Ltd | $0.017 | -15.00% |
52 Week Highs
Code | Company | Last | % Chg |
|---|---|---|---|
| EGR | Ecograf Ltd | $0.29 | +18.37% |
| NSM | North Stawell Minerals Ltd | $0.047 | +17.50% |
| NAN | Nanosonics Ltd | $4.98 | +13.96% |
| FXG | FELIX Gold Ltd | $0.17 | +13.33% |
| ORD | Ordell Minerals Ltd | $0.73 | +8.96% |
52 Week Lows
Code | Company | Last | % Chg |
|---|---|---|---|
| BSA | BSA Ltd | $0.063 | -25.88% |
| CPO | Culpeo Minerals Ltd | $0.014 | -12.50% |
| TRI | Trivarx Ltd | $0.013 | -7.14% |
| TEE | Top End Energy Ltd | $0.08 | -6.98% |
| KOB | Koba Resources Ltd | $0.054 | -6.90% |
Near Highs
Code | Company | Last | % Chg |
|---|---|---|---|
| BILL | Ishares Core Cash ETF | $100.61 | +0.02% |
| GLDN | Ishares Physical Gold ETF | $38.42 | +0.81% |
| MTO | Motorcycle Holdings Ltd | $1.99 | +1.53% |
| GXLD | Global X Gold Bullion ETF | $48.02 | +0.71% |
| ASIA | Betashares Asia Technology Tigers ETF | $11.32 | -0.18% |
Relative Strength Index (RSI) Oversold
Code | Company | Last | % Chg |
|---|---|---|---|
| PGC | Paragon Care Ltd | $0.40 | +2.56% |
| SPK | Spark New Zealand Ltd | $1.81 | -4.99% |
| JDO | Judo Capital Holdings Ltd | $1.74 | -6.20% |
| REH | Reece Ltd | $15.68 | +0.19% |
| AMP | AMP Ltd | $1.25 | +0.40% |
