

The ASX 200 gave back most of an earlier 1.1% rally after June employment data delivered a staggering 76,000 jobs — against expectations of 15,000 — spiking the Australian dollar, lifting bond yields to near 5%, and repricing the odds of an August RBA rate hike from near-zero to 36%. Materials, gold, and energy held their gains; everything else gave back.
Be sure to click/scroll through for the usual reporting of the major sector and stock-specific moves, the broker responses to them, as well as all the key economic data in tonight's Evening Wrap. Also, I have detailed technical analysis on the Nasdaq Composite and the S&P/ASX 200 in today's ChartWatch.
Let’s dive in!
Today in Review
Name | Value | % Chg |
|---|---|---|
Major Indices | ||
| ASX 200 | 8,839.0 | +0.18% |
| All Ords | 9,018.1 | +0.15% |
| Small Ords | 3,348.1 | +0.16% |
| All Tech | 2,845.9 | -2.86% |
| Emerging Companies | 2,853.8 | +1.16% |
Currency | ||
| AUD/USD | 0.7012 | +0.22% |
US Futures | ||
| S&P 500 | 7,522.0 | -0.24% |
| Dow Jones | 52,332.0 | -0.22% |
| Nasdaq | 29,085.25 | -0.33% |
Name | Value | % Chg |
|---|---|---|
Sector | ||
| Materials | 23,405.5 | +1.37% |
| Energy | 10,531.1 | +0.98% |
| Utilities | 9,486.6 | +0.65% |
| Real Estate | 3,564.1 | +0.53% |
| Financials | 9,658.8 | +0.29% |
| Industrials | 8,301.7 | -0.46% |
| Consumer Staples | 13,022.8 | -0.53% |
| Communication Services | 1,597.8 | -1.15% |
| Health Care | 25,440.4 | -1.43% |
| Consumer Discretionary | 3,907.8 | -1.52% |
| Information Technology | 1,699.3 | -3.32% |
ASX 200 Intraday Chart
%20intraday%20chart_23%20Jul.png)
Markets
The S&P/ASX 200 (XJO) finished 16.0 points higher at 8,839.0, 1.0% from its session high and just 0.18% from its low. It will be no surprise to regular readers that the gain in the benchmark was not reflected in the broader-based S&P/ASX 300 (XKO), as advancers lagged decliners by 134 to 140.
Financials (XFJ) (+0.3%) is worth a note. The sector entered the session well-bid — up as much as 1.5% in the late morning — before the 11:30am jobs print triggered a sustained rotation out of rate-sensitive domestic stocks. Banks fell steadily through the afternoon and into the closing auction, the first session in several weeks where the sector did not receive the post-market buying order that has repeatedly cushioned its late-session performance.
%20intraday%20chart_23%20Jul%20-%20Copy.png)
ASX 200 Financials (XFJ) intraday chart
The major banks' gains were trimmed sharply: National Australia Bank (NAB) (+1.4%), Westpac (WBC) (+0.8%), ANZ (ANZ) (+0.6%), and Commonwealth Bank (CBA) (+0.4%) all finished positive but well below intraday highs. Macquarie Group (MQG) (-0.5%) fell after CEO Shemara Wikramanayake announced her retirement in November, with head of banking and financial services Greg Ward appointed as her successor.
Information Technology (XIJ) (-3.3%) was the session's worst performer, hammered by two simultaneous blows — Alphabet's after-hours result disappointed the market and sent its shares down 4% in US trading, casting doubt on near-term AI advertising spend, while the domestic jobs shock pushed Australian benchmark bond yields to 4.97%, lifting the discount rate applied to long-duration tech earnings and compressing their present value. WiseTech Global (WTC) (-7.0%), Xero (XRO) (-5.0%), and Technology One (TNE) (-3.7%) all fell sharply.
%20intraday%20chart_23%20Jul%20-%20Copy.png)
ASX 200 Information Technology (XIJ) intraday chart
Health Care (XHJ) (-1.4%) also bore the bond yield pressure — its largest constituents carry premium valuations justified by long-duration earnings growth, and higher risk-free rates are the sector's most direct valuation headwind. CSL (CSL) (-2.3%), Cochlear (COH) (-2.2%), and Pro Medicus (PME) (-1.6%) were all lower.
%20intraday%20chart_23%20Jul.png)
ASX 200 Healthcare (XHJ) intraday chart
Materials (XMJ) (+1.4%) was the session's strongest performer and the one sector that kept most of its pre-11:30am gains almost intact — commodity price leads were firm enough, and the jobs data is not an immediate negative for mining earnings, so the sector kept its bid. SGX iron ore futures added 0.6% to US$98.20/t and COMEX copper futures edged up 0.2% to US$6.505/lb, consolidating recent gains.
%20intraday%20chart_23%20Jul.png)
ASX 200 Materials (XMJ) intraday chart
James Hardie Industries (JHX) (+6.1%) was the standout individual mover after upgrading its June-quarter sales guidance to US$1.449–1.475 billion, well ahead of market expectations. Sandfire Resources (SFR) (+3.6%) — which reported record quarterly revenue, stronger copper-equivalent production, and a US$353 million net cash position — and South32 (S32) (+2.4%), BHP (BHP) (+1.5%), and Fortescue (FMG) (+1.0%) were also firmer.
The Gold Sub-Index (XGD) (+1.3%) also proved resilient despite a morning shock from the jobs data — gold futures had rallied 1.9% overnight and, while COMEX gold futures gave back 0.8% to US$4,120/oz in Asian trade, the sector entered the session with enough momentum to absorb the bond yield surge without surrendering its gains. Northern Star Resources (NST) (+1.9%), Pantoro Gold (PNR) (+1.9%), Ramelius Resources (RMS) (+1.9%), and Evolution Mining (EVN) (+1.8%) all advanced.
Energy (XEJ) (+1.0%) firmed as ICE Brent crude futures gained 2.9% to US$96.80/bbl in Asian trade after surging 3.4% overnight, following Iran-backed Houthi militants' reported attacks on two Saudi Arabian tankers in the Red Sea and raising the spectre of a broadening conflict beyond the Strait of Hormuz. Brent is now up roughly 30% across July.
Karoon Energy (KAR) (+3.5%) — which reported US$116.4 million in June-quarter sales revenue from 1.08 million barrels of production — and Beach Energy (BPT) (+1.1%) led the oil and gas names, alongside Woodside Energy (WDS) (+0.5%). Coal stocks tracked oil's momentum — Whitehaven Coal (WHC) (+2.2%), Yancoal Australia (YAL) (+1.5%), and New Hope Corp. (NHC) (+1.3%) were all firmer, with globalCoal Newcastle Coal futures gaining 1.2% to US$137.60/t, now up 9.6% since the latest Middle East escalation began.
Lithium stocks rallied for a second consecutive session as confidence built that the commodity price correction had found its floor — GFEX lithium carbonate futures gained 1.2% to CNY 145,000/t and Australian spodumene concentrate in China rose 1.4% to US$2,130/t, both closing comfortably above their session lows. Core Lithium (CXO) (+6.3%), Liontown Resources (LTR) (+3.6%), IGO (IGO) (+3.1%), Mineral Resources (MIN) (+2.2%), and Pilbara Minerals (PLS) (+1.9%) all advanced.
%20%20chart_22%20Jul.png)
Sprott Uranium Miners ETF (NYSE: URNM) chart
Uranium stocks also gained for a second consecutive day, tracking the Sprott Uranium Miners ETF's 1.8% overnight gain — Paladin Energy (PDN) (+11.6%), Deep Yellow (DYL) (+5.6%), Boss Energy (BOE) (+5.0%), and NexGen Energy (NXG) (+2.6%) all rose.
Today's best ASX Top 300 gainers
Company | Last Price | Change $ | Change % | 1mo % | 1yr % |
|---|---|---|---|---|---|
| Generation Development Group (GDG) | $4.58 | +$1.24 | +37.1% | +23.1% | -15.5% |
| Paladin Energy (PDN) | $10.19 | +$1.06 | +11.6% | +3.7% | +40.6% |
| Clarity Pharmaceuticals (CU6) | $2.56 | +$0.22 | +9.4% | +26.1% | -34.5% |
| Brazilian Rare Earths (BRE) | $4.01 | +$0.26 | +6.9% | -19.8% | +56.6% |
| Artrya (AYA) | $5.75 | +$0.34 | +6.3% | +11.4% | +432.4% |
| James Hardie Industries Plc (JHX) | $36.99 | +$2.14 | +6.1% | +6.0% | -11.5% |
| Minerals 260 (MI6) | $0.66 | +$0.035 | +5.6% | -33.0% | +473.9% |
| Southern Cross Gold Consolidated (SX2) | $9.29 | +$0.49 | +5.6% | -4.5% | +53.6% |
| Deep Yellow (DYL) | $1.425 | +$0.075 | +5.6% | -9.2% | -20.8% |
| Lindian Resources (LIN) | $0.745 | +$0.035 | +4.9% | -15.3% | +609.5% |
| Benz Mining Corp (BNZ) | $3.01 | +$0.14 | +4.9% | +42.0% | +401.7% |
| WEB Travel Group (WEB) | $2.54 | +$0.11 | +4.5% | -13.6% | -47.7% |
| Sunrise Energy Metals (SRL) | $15.40 | +$0.66 | +4.5% | -12.7% | +1117.4% |
| Contact Energy (CEN) | $7.83 | +$0.33 | +4.4% | +0.8% | -6.0% |
| PYC Therapeutics (PYC) | $1.675 | +$0.07 | +4.4% | +9.8% | +27.5% |
| Stanmore Resources (SMR) | $2.86 | +$0.11 | +4.0% | +15.8% | +15.8% |
| L1 Gold Fund (LGF) | $1.97 | +$0.07 | +3.7% | +5.9% | -3.0% |
| Liontown (LTR) | $1.28 | +$0.045 | +3.6% | -32.6% | +37.6% |
| Sandfire Resources (SFR) | $19.36 | +$0.67 | +3.6% | -6.5% | +71.8% |
| Karoon Energy (KAR) | $1.615 | +$0.055 | +3.5% | +15.8% | -17.8% |
Today's worst ASX Top 300 losers
Company | Last Price | Change $ | Change % | 1mo % | 1yr % |
|---|---|---|---|---|---|
| Wisetech Global (WTC) | $31.48 | -$2.36 | -7.0% | +4.7% | -73.8% |
| Pro Medicus (PME) | $162.13 | -$11.32 | -6.5% | -7.2% | -50.0% |
| Life360 Inc (360) | $24.12 | -$1.39 | -5.4% | +4.0% | -35.7% |
| IperionX (IPX) | $3.33 | -$0.18 | -5.1% | -23.4% | -39.6% |
| Xero (XRO) | $64.45 | -$3.40 | -5.0% | -6.1% | -64.2% |
| SEEK (SEK) | $13.10 | -$0.68 | -4.9% | +1.6% | -46.1% |
| Neuren Pharmaceuticals (NEU) | $16.46 | -$0.83 | -4.8% | +32.5% | +7.0% |
| Zip Co (ZIP) | $2.65 | -$0.13 | -4.7% | -8.6% | -11.4% |
| 4DMedical (4DX) | $3.24 | -$0.15 | -4.4% | -31.4% | +1196.0% |
| Echo IQ (EIQ) | $1.31 | -$0.06 | -4.4% | +6.5% | +445.8% |
| Block, Inc. (XYZ) | $108.98 | -$4.49 | -4.0% | +3.1% | -10.5% |
| Centuria Capital Group (CNI) | $1.59 | -$0.065 | -3.9% | -27.1% | -10.9% |
| Technology One (TNE) | $28.21 | -$1.07 | -3.7% | -5.5% | -29.8% |
| Zimplats Holdings (ZIM) | $13.11 | -$0.46 | -3.4% | -9.0% | -21.5% |
| Mader Group (MAD) | $7.45 | -$0.25 | -3.2% | -10.2% | +5.7% |
| Catapult Sports (CAT) | $3.49 | -$0.10 | -2.8% | +18.3% | -43.2% |
| Tuas (TUA) | $2.14 | -$0.06 | -2.7% | -9.7% | -57.9% |
| EBOS Group (EBO) | $18.02 | -$0.49 | -2.6% | +7.1% | -50.8% |
| SKS Technologies Group (SKS) | $8.40 | -$0.22 | -2.6% | -12.9% | +273.3% |
| Superloop (SLC) | $3.18 | -$0.08 | -2.5% | -6.7% | +2.6% |
Chartwatch
Nasdaq Composite Index
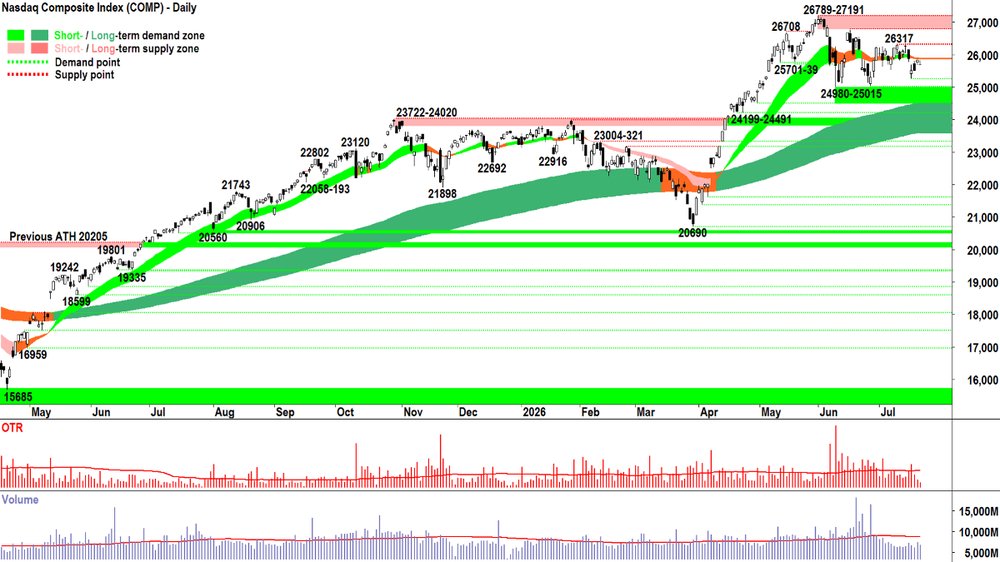
Nasdaq Composite Index chart
Analysis
Is it possible the Comp's price action is hugging the short term trend ribbon? 🤔
No, of course not, the short term trend ribbon (like the long term trend ribbon) doesn't exist!
The trend ribbons are nothing more than colourful figments of our collective imaginations... They're irrelevant... Meaningless!
And yet, somehow, they seem to almost dictate the price action of the security they're applied to.
Well, MOTN they do! 😉
Pure coincidence. There can be no other way... But for me, it's always nice to know they're there to guide me. Is D > S, = S or < S in the short and long term?
As for our trend ribbons vs the Comp:
ST = Very 🟧 and very FLAT! Arguably, there's near-perfect equilibrium between demand and supply in the short term. ⚖️
LT = 🟩 and ⬆️. Losing a little bit of steam as the ST trend extends sideways, but still a clear indication that in the longer term, D > S. 👍
What about the second tent peg of our technical model, price action?
Mixed! I must squint to see the positional relationship between the peaks (actually back to falling after last night's lower low and lower high set the 21-Jul candle as a peak) and the troughs are definitely falling. 📉
Falling peaks & troughs = Building supply and demand removal, an absence of BTD / FOMO / HOFU and a prevalence of STR / NUTE / FOHO (acronym definitions below!) 👎
And candles, the third tent peg?
At least they're not a clear-cut supply side dominated cohort. But Zebra... Barcode... They're hardly a strong vote of confidence in D > S, either. 🦓 ⚖️
Tent-peg 4 is volatility and volume: are there any significant bars that we must take extra care with? What's the engagement of the D and S sides?
Note a great deal of either, and the last significant volatility day was a supply-side controlled one...
Volume is consistent with this time of the year (fund managers are on holiday), and when paired with candles, suggests neither side is particularly motivated to move the price substantially one way or the other. ⚖️
When we put all of our Analysis together, we get ⚖️👍👎⚖️⚖️. Logically, as trend followers, 👍👍👍👍👍 or 👎👎👎👎👎is a good time to trade. These two scenarios carry the greatest probability of success.
That's when we can Act by loading up on risk.
But given we're a long way from either productive scenario, we must Accept that right now is MOTN going to be a poor time to 'go big'. Hence my rather conservative current risk allocation.
View
I am at 1/2RP on my US portfolio (RP = Risk Position — it reflects my personal allowable capital allocation limit for my investments in US stocks. So 1/2RP is 50%, 2/3RP is 67% and FRP is 100% 🪣).
Key Levels
Dead simple! 26789-27191 is the key zone of supply vs 24980-25015 is the key zone of demand. In between = 1/2RP vs >= FRP and <= 1/3RP.
S&P/ASX 200 (XJO)
%20chart_23%20Jul.png)
S&P/ASX 200 (XJO) chart
Analysis
For about an-hour-and-a-half (i.e., until the blowout employment data was released — jolting the likelihood of another RBA rate hike) we got a rare glimpse into what can happen when the stars align and Financials and Materials go up on the same day! ✨✨✨✨✨✅
When was the last time that occurred? Probably the last decent white candle on the OTP's chart! 🤦
But, alas, it wasn't meant to be. Unjuiced.
But you can't un-juice something, Carl. Once that orange is juiced, the juice ain't going back into the orange!
Yes, but the OTP isn't an orange. Juice can go in, and as we saw today, it can come out.
Yes, yes, I know that last sentence is the opposite of the un-juice analogy — but you get what I mean! 😁
Anyways, the financials were looking juicy this morning, and therefore, so too was the OTP. Now, not so much... 😢
So we wait. For what? A move one way or the other that actually sticks!
View
I'm 1/2RP on my Aussie portfolio ⚖️ (i.e., my personal allowable capital allocation limit for my investments in Australian stocks is 50%).
Key Levels
8984-9022 is the key zone of supply, while demand is at 8708-8656.
(Glossary of acronyms! Old Tin Pot (OTP): S&P/ASX 200 | MOTN: More Often Than Not | FOMO: Fear Of Missing Out | HOFU: Holding On For Upside | BTD: Buy The Dip | NUTE: No Urgency To Enter | FOHO: Fear Of Holding On | STR: Sell The Rally | RP: Risk Position | FFS: Fund Flow Shenanigans!)
***CHARTWATCH LIVE WEBINARS — NEW VIDEO DROPPED 📺🍿***
Lithium masterclass, plus CSL flashing sell signal vs WDS flashing buy signal! 🚨🚨
ChartWatch LIVE Webinars – WEEKLY Wednesday's @ 12pm AEST
Learn more about technical analysis and trend following through real case studies on ASX stocks. Australia's premier technical analyst, Carl Capolingua, shares his unique insights on stocks as requested by viewers. Ask about a company in your portfolio or anything related to trading and investing and get Carl's expert opinion.
Places are limited so >REGISTER NOW!<
Economy
Today
AUS June Employment Data
Employment change: +76,300 vs +15,200 m/m forecast and +40,300 m/m in May
Unemployment rate: 4.4%, unchanged, as forecast
Reader: Australia’s labour market remained surprisingly strong in June. The result gives the RBA more room to raise rates again, with policymakers likely to see the jobs market as still tight enough to sustain wage and spending pressures.
Bond market reaction: The implied probability of an August hike rose to 32% from 22% before the data, while the chance of a fourth increase by year-end climbed to 94% from 79%.
What's next: Attention now turns to next week’s June quarter CPI, where trimmed mean inflation above the RBA’s 3.8% forecast could cement an August interest rate hike.
Later this week
Thursday
22:15 EUR European Central Bank (ECB) Main Financing Rate (no change at 2.4% p.a. forecast)
Friday
09:00 AUS July Flash Purchasing Managers Index (PMI)
Manufacturing: vs 51.5 in June (revised up from 51.2)
Services: vs 50.5 in June (revised up from 49.9)
23:45 USA July Flash PMIs
Manufacturing: 54.5 forecast vs 51.5 in June (revised down from 55.7)
Services: 51.4 forecast vs 50.5 in June (revised down from 51.3)
Saturday
00:00 USA June New Home Sales (604,000 forecast vs 580,000 in May)
Interesting Movers
Trading higher
- OFX Group (OFX) $0.81+69.5%
Rose after it announced that it has entered into a deed to be acquired by UK-based Equals Group; OFX shareholders to receive $1.00 cash representing a 110% premium to OFX’s last traded closing share price prior to the announcement.
- Pacgold (PGO) $0.15+39.5%
Rose after it announced drilling at its White Dam North project has intersected high-grade gold and copper sulphide mineralisation; one hole delivered 20m @ 2.5g/t Au and 0.5% Cu from 58m.
- Generation Development Group (GDG) $4.58+37.1%
Rose after it announced record quarterly sales and a 36 per cent increase in funds under management to $46.4 billion over FY26, with Generation Life and managed accounts segment Evidentia driving growth.
- Carnegie Clean Energy (CCE) $0.29+16.3%
No news today, but rise is likely due to continued positive response to yesterday's announcement of a well supported placement to fund growth of the company's multi-megawatt CETO array at Biscay Marine Energy Platform and other business development activities.
- Vitrafy Life Sciences (VFY) $3.20+13.9%
Rose after it announced a partnership with Hoxworth Blood Center to expand its cryopreservation ecosystem solution; the agreement is not expected to generate revenue for the company.
- Paladin Energy (PDN) $10.19+11.6%
No news today, but rise is likely due to continued positive response to yesterday's quarterly activity report and production and costs guidance update; management's upgraded first-quarter EBITDA range was 9 per cent above Visible Alpha consensus.
- 29Metals (29M) $0.26+10.6%
Rose after it delivered a company presentation to the Noosa Mining Conference; CEO noted water levels were 'no longer an impediment' to a restart of production at Capricorn Copper.
- Artrya (AYA) $5.75+6.3%
Rose after it announced its Salix platform has gone live within Northeast Georgia Health System with first patient scans processed and revenue being generated via subscription fees and fee-per-scan.
- James Hardie Industries Plc (JHX) $36.99+6.1%
Rose after it announced a stronger-than-expected first-quarter update and now expects to exceed prior guidance, with higher net sales and adjusted EBITDA forecasts.
- Sandfire Resources (SFR) $19.36+3.6%
Rose after it announced quarterly sales revenue of $574 million and underlying EBITDA of $343 million, with net cash increasing by $277 million to $353 million and higher copper-equivalent production.
- Karoon Energy (KAR) $1.62+3.5%
Rose after it said it now expects a stronger second half of 2026 following completion of Bauna maintenance, restored production (around 22,000 bpd) and $US116.4 million in sales revenue in the June quarter.
Trading Lower
- Wisetech Global (WTC) $31.48-7.0%
Fell on no news; performance reflected general weakness in the broader information technology sector and prevailing short and long term downtrends; regular in the ChartWatch ASX Scans Downtrends List.
- Pro Medicus (PME) $162.13-6.5%
Fell on no news; performance reflected general weakness in the broader healthcare and information technology sectors.
- Life360 Inc (360) $24.12-5.5%
Fell on no news; performance reflected general weakness in the broader information technology sector.
- Xero (XRO) $64.45-5.0%
Fell on no news; performance reflected general weakness in the broader information technology sector and prevailing short and long term downtrends; regular in the ChartWatch ASX Scans Downtrends List.
- SEEK (SEK) $13.10-4.9%
Fell on no news; performance reflected general weakness in the broader information technology sector.
- Appen (APX) $0.90-4.3%
Fell on no news; performance reflected general weakness in the broader information technology sector and prevailing short and long term downtrends; regular in the ChartWatch ASX Scans Downtrends List.
- Technology One (TNE) $28.21-3.7%
Fell on no news; performance reflected general weakness in the broader information technology sector.
- Polynovo (PNV) $0.93-2.6%
Fell after it announced a 16 per cent lift in FY26 revenue to $150 million as US commercial sales drove growth and returned the company to positive free cash flow.
- Domino's Pizza Enterprises (DMP) $16.87-0.1%
Fell after it announced it is reviewing a Federal Court judgment in a seven-year class action over underpaid workers; company said potential wider exposure remains highly uncertain and unquantifiable.
Broker Moves
Company | Broker | Action | Rating | Price Target |
|---|---|---|---|---|
AEUAtomic Eagle | Shaw and Partners | Retained | Buy | $1.70(from $1.40) |
ALLAristocrat Leisure | UBS | Retained | Buy | $69.40 |
BMNBannerman Energy | Shaw and Partners | Retained | Buy | $7.60(from $6.50) |
BOEBoss Energy | Shaw and Partners | Retained | Buy | $3.08(from $2.96) |
BPTBeach Energy | Bell Potter | Retained | Hold | $0.95(from $1.15) |
| Citi | Retained | Sell | $0.80 | |
| Morgan Stanley | Retained | Equal Weight | $0.88 | |
| UBS | Retained | Sell | $0.85(from $0.95) | |
CIPCenturia Industrial REIT | Jefferies | Upgraded | Buy(from Hold) | $3.36(from $3.48) |
COFCenturia Office REIT | Jefferies | Upgraded | Hold(from Underperform) | $0.80(from $0.94) |
CSLCSL | Citi | Retained | Neutral | $110.00 |
| Ord Minnett | Retained | Hold | $123.30(from $121.50) | |
CWYCleanaway Waste Management | Morgans | Retained | Buy | $2.80 |
EDVEndeavour Group | UBS | Retained | Neutral | $3.25 |
ELSElsight | Bell Potter | Retained | Buy | $8.20(from $8.10) |
GPTGPT Group | Citi | Retained | Buy | $6.00 |
HCWHealthCo Healthcare and Wellness REIT | Jefferies | Upgraded | Buy(from Hold) | $0.96(from $0.75) |
JHXJames Hardie Industries Plc | Citi | Retained | Buy | $36.50 |
| Morgans | Retained | Trim | $36.00 | |
LAMLaramide Resources | Canaccord Genuity | Retained | Speculative Buy | $1.60 |
LNWLight & Wonder Inc. | UBS | Retained | Buy | $210.00 |
LYCLynas Rare Earths | Citi | Retained | Sell | $9.50 |
| Jefferies | Retained | Buy | $20.50(from $22.00) | |
| JPMorgan | Retained | Overweight | $18.50(from $22.00) | |
| Ord Minnett | Upgraded | Lighten(from Sell) | $15.00(from $14.00) | |
| UBS | Retained | Buy | $22.75(from $23.45) | |
MMEMoneyMe | Morgans | Retained | Speculative Buy | $0.21 |
MMSMcMillan Shakespeare | Morgan Stanley | Retained | Overweight | $19.00 |
MPLMedibank Private | Macquarie | Retained | Neutral | $4.90 |
MQGMacquarie Group | Citi | Retained | Neutral | $240.00 |
| UBS | Retained | Neutral | $250.00 | |
MSVMitchell Services | Morgans | Downgraded | Accumulate(from Speculative Buy) | $0.60 |
MYRMyer Holdings | Morgan Stanley | Retained | Overweight | $0.55 |
NHFNIB Holdings | Macquarie | Retained | Underperform | $6.05 |
NXGNexGen Energy (Canada) | Shaw and Partners | Retained | Buy | $24.80(from $22.90) |
PDNPaladin Energy | Bell Potter | Retained | Buy | $14.80(from $15.30) |
| Citi | Retained | Buy | $14.00(from $15.00) | |
| JPMorgan | Upgraded | Neutral(from Underweight) | $9.10(from $9.20) | |
| Ord Minnett | Downgraded | Lighten(from Hold) | $8.50(from $9.50) | |
| RBC Capital Markets | Retained | Outperform | $13.50 | |
| Shaw and Partners | Retained | Buy | $19.10(from $17.50) | |
| UBS | Upgraded | Buy(from Neutral) | $11.70(from $12.60) | |
PENPeninsula Energy | Canaccord Genuity | Retained | Speculative Buy | $0.80(from $0.90) |
| Shaw and Partners | Retained | Buy | $0.81(from $1.93) | |
PPSPraemium | Bell Potter | Retained | Buy | $1.20 |
| Ord Minnett | Retained | Buy | $1.05 | |
RPLRegal Partners | Bell Potter | Retained | Buy | $4.80 |
SDRSiteMinder | Morgan Stanley | Retained | Overweight | $6.55 |
SEKSEEK | Citi | Retained | Buy | $18.80 |
SFRSandfire Resources | Canaccord Genuity | Retained | Buy | $22.00(from $21.50) |
| Macquarie | Retained | Neutral | $20.00 | |
SLXSilex Systems | Shaw and Partners | Retained | Buy | $14.30(from $12.80) |
STOSantos | Macquarie | Retained | Outperform | $9.00 |
TAHTabcorp Holdings | UBS | Retained | Buy | $1.05 |
TCGTuraco Gold | Canaccord Genuity | Retained | Speculative Buy | $1.35 |
TLCThe Lottery Corporation | UBS | Retained | Buy | $6.15 |
WESWesfarmers | Morgan Stanley | Downgraded | Underweight(from Equal Weight) | $79.00(from $78.70) |
WGXWestgold Resources | UBS | Retained | Buy | $7.75(from $8.25) |
Scans
Top Gainers
Code | Company | Last | % Chg |
|---|---|---|---|
| CTS | Ceretas Ltd | $0.58 | +132.00% |
| OFX | OFX Group Ltd | $0.805 | +69.47% |
| PGO | Pacgold Ltd | $0.15 | +39.54% |
| IOV | Ion Video Ltd | $0.455 | +37.88% |
| GDG | Generation Development Group Ltd | $4.58 | +37.13% |
Top Fallers
Code | Company | Last | % Chg |
|---|---|---|---|
| RBX | Resource Base Ltd | $0.019 | -29.63% |
| MNB | Minbos Resources Ltd | $0.019 | -20.83% |
| RAN | Range International Ltd | $0.17 | -19.05% |
| BUX | Buxton Resources Ltd | $0.04 | -18.37% |
| RRR | Revolver Resources Holdings Ltd | $0.058 | -17.14% |
52 Week Highs
Code | Company | Last | % Chg |
|---|---|---|---|
| CTS | Ceretas Ltd | $0.58 | +132.00% |
| SLB | Stelar Metals Ltd | $0.205 | +24.24% |
| GW1 | Greenwing Resources Ltd | $0.087 | +19.18% |
| CCE | Carnegie Clean Energy Ltd | $0.285 | +16.33% |
| BFG | Bell Financial Group Ltd | $1.545 | +3.69% |
52 Week Lows
Code | Company | Last | % Chg |
|---|---|---|---|
| RBX | Resource Base Ltd | $0.019 | -29.63% |
| TRP | Tissue Repair Ltd | $0.08 | -15.79% |
| MRZ | Mont Royal Resources Ltd | $0.105 | -12.50% |
| SKO | Serko Ltd | $1.06 | -11.67% |
| SRK | Strike Resources Ltd | $0.023 | -11.54% |
Near Highs
Code | Company | Last | % Chg |
|---|---|---|---|
| WVOL | iShares MSCI World Ex Aust Minimum Volatility ETF | $45.14 | +0.89% |
| IAGPF | Insurance Australia Group Ltd | $106.30 | +0.01% |
| GCI | Gryphon Capital Income Trust | $2.08 | +0.48% |
| VVLU | Vanguard Global Value Equity Active ETF | $79.89 | +0.68% |
| IHD | iShares S&P/ASX DIV Opportunities Esg Screened ETF | $17.06 | +0.47% |
Relative Strength Index (RSI) Oversold
Code | Company | Last | % Chg |
|---|---|---|---|
| CCR | Credit Clear Ltd | $0.12 | -4.00% |
| VUL | Vulcan Energy Resources Ltd | $2.64 | +0.76% |
| PEN | Peninsula Energy Ltd | $0.27 | -26.03% |
| WC8 | Wildcat Resources Ltd | $0.36 | -2.70% |
| BRN | Brainchip Holdings Ltd | $0.13 | 0.00% |
