News | Market Wraps
Evening Wrap: ASX 200 notches third straight gain as golden run continues, MYR dumps, TLX pops
The S&P/ASX 200 closed 35.0 points higher, up 0.40%.

Mentioned
The S&P/ASX 200 closed 35.0 points higher, up 0.40%.
Gold and silver stocks again topped the ASX leaderboard as the melt-up in the precious metals sector continued. In stock specific moves, investors savaged Myer Holdings (MYR) (-25%) after it reported disappointing FY25 results, and Telix Pharmaceuticals (TLX) (+9.2%) rallied after it reported its Gozellix prostate cancer imaging agent had been granted Transitional Pass-Through payment status by United States Medicare.
Be sure to click/scroll through for the usual reporting of the major sector and stock-specific moves, the broker responses to them, as well as all the key economic data in tonight's Evening Wrap.
Also, I have detailed technical analysis on the S&P/ASX 200 (XJO) in today's ChartWatch.
Let's dive in!
Today in Review
Tue 23 Sep 25, 5:06pm (AEST)
Name | Value | % Chg |
|---|---|---|
Major Indices | ||
| ASX 200 | 8,845.9 | +0.40% |
| All Ords | 9,137.8 | +0.39% |
| Small Ords | 3,701.3 | +0.58% |
| All Tech | 4,307.3 | -0.22% |
| Emerging Companies | 2,841.0 | +1.42% |
Currency | ||
| AUD/USD | 0.6591 | -0.14% |
US Futures | ||
| S&P 500 | 6,752.0 | -0.01% |
| Dow Jones | 46,737.0 | +0.03% |
| Nasdaq | 25,010.0 | +0.03% |
Name | Value | % Chg |
|---|---|---|
Sector | ||
| Materials | 18,173.1 | +0.86% |
| Financials | 9,610.7 | +0.63% |
| Industrials | 8,513.6 | +0.26% |
| Health Care | 38,251.7 | +0.21% |
| Communication Services | 1,883.8 | +0.12% |
| Consumer Discretionary | 4,540.0 | +0.10% |
| Energy | 8,320.5 | +0.06% |
| Utilities | 10,063.1 | +0.05% |
| Information Technology | 3,006.5 | -0.06% |
| Consumer Staples | 11,888.5 | -0.29% |
| Real Estate | 4,114.4 | -0.35% |
ChartWatch *LIVE* Webinar
ChartWatch *LIVE* Webinars – WEEKLY Wednesday's @ 12pm AEDT
Learn more about technical analysis and trend following through real case studies on ASX stocks. Australia's premier technical analyst, Carl Capolingua, shares his unique insights on stocks as requested by viewers. Ask about a company in your portfolio or anything related to trading and investing and get Carl's expert opinion.
Places are limited so >REGISTER NOW!<
Markets
%20intraday%20chart_23%20Sep.png)
ASX 200 Session Chart
The S&P/ASX 200 (XJO) finished 35.0 points higher at 8,845.9, roughly mid-range, 0.41% from its session low and 0.35% from its high. In the broader-based S&P/ASX 300 (XKO) advancers beat decliners by a modest 148 to 113.
Evening wrap writers are running out of superlatives for ASX gold stocks – heck, and we can only make so many puns with the words “glitter” and “shine” – so, I won’t attempt to do either!
The Gold Sub-Index (XGD) (+2.1%) was again the best performing sector in the Australian share market today. There are massive moves occurring from big, e.g., Northern Star Resources (NST) (+3.2% day, +24.5% month, +46% year) to small, e.g., Saturn Mining (STN) (+11.7% day, 61% month, 179% year)… and pretty much everything in between.
I note that both of those stocks have been ChartWatch ASX Scans regulars (and pretty much everything in between 💪!)
Strength in the gold sector helped drive Resources (XJR) (0.8%) to a decent gain, and they assisted the majors BHP Group (BHP) (+0.5%) and Rio Tinto (RIO) (1.1%) to offset weakness in other iron ore stocks (Fortescue (FMG) (-1.1%) and Champion Iron (CIA) (-1.1%)) and base metals (South32 (S32) (-1.1%)).
Financials (XFJ) (+0.6%) rounded out the top 3 sector winners, with each of the Big 4 Banks notching gains of 0.7%–1.0%. National Australia Bank (NAB) (+1.0%) was the best there.
Real Estate (XPJ) (-0.4%) was again the laggard, but along with Consumer Staples (XSJ) (-0.3%) and Information Technology (XIJ) (-0.1%) – only very modest declines were felt across today’s have-nots.
Basically, you had 4 big banks, BHP and RIO up, so 99% of the time that’s going to mean the ASX 200 is up…
Today's best blue chip gainers
Company | Last Price | Change $ | Change % | 1mo % | 1yr % |
|---|---|---|---|---|---|
Telix Pharmaceuticals (TLX) | $16.38 | +$1.38 | +9.2% | -12.7% | -12.7% |
Lynas Rare Earths (LYC) | $16.52 | +$1.23 | +8.0% | +15.4% | +144.4% |
Northern Star Resources (NST) | $23.12 | +$0.71 | +3.2% | +24.5% | +46.2% |
Perseus Mining (PRU) | $4.79 | +$0.11 | +2.4% | +28.8% | +82.1% |
Washington H Soul Pattinson (SOL) | $40.88 | +$0.82 | +2.0% | -3.9% | +21.1% |
Bendigo and Adelaide Bank (BEN) | $13.12 | +$0.26 | +2.0% | -0.1% | +7.4% |
Bank of Queensland (BOQ) | $7.21 | +$0.12 | +1.7% | -9.5% | +11.8% |
IGO (IGO) | $4.95 | +$0.07 | +1.4% | -6.8% | -4.8% |
Newmont Corporation (NEM) | $126.49 | +$1.68 | +1.3% | +15.8% | +60.1% |
Atlas Arteria (ALX) | $5.28 | +$0.07 | +1.3% | -3.3% | +10.5% |
Dyno Nobel (DNL) | $3.03 | +$0.04 | +1.3% | -2.9% | -3.2% |
Evolution Mining (EVN) | $10.23 | +$0.13 | +1.3% | +21.9% | +132.5% |
Aurizon (AZJ) | $3.24 | +$0.04 | +1.3% | 0% | -5.5% |
JB HI-FI (JBH) | $119.09 | +$1.38 | +1.2% | +2.4% | +52.4% |
Rio Tinto (RIO) | $118.28 | +$1.36 | +1.2% | +2.5% | +4.1% |
Brambles (BXB) | $24.97 | +$0.27 | +1.1% | -5.2% | +33.2% |
SGH (SGH) | $51.12 | +$0.51 | +1.0% | +3.0% | +21.5% |
National Australia Bank (NAB) | $44.09 | +$0.44 | +1.0% | +5.7% | +11.6% |
Steadfast Group (SDF) | $6.05 | +$0.06 | +1.0% | -1.3% | +6.9% |
Hub24 (HUB) | $106.53 | +$1.03 | +1.0% | -5.3% | +85.6% |
Today's worst blue chip losers
Company | Last Price | Change $ | Change % | 1mo % | 1yr % |
|---|---|---|---|---|---|
Reliance Worldwide (RWC) | $4.18 | -$0.1 | -2.3% | -0.7% | -29.4% |
Computershare (CPU) | $36.51 | -$0.77 | -2.1% | -2.5% | +39.6% |
AMP (AMP) | $1.680 | -$0.025 | -1.5% | -4.5% | +25.4% |
South32 (S32) | $2.59 | -$0.03 | -1.1% | -11.6% | -19.1% |
Fortescue (FMG) | $19.10 | -$0.21 | -1.1% | -4.5% | +8.3% |
Qantas Airways (QAN) | $10.94 | -$0.12 | -1.1% | -1.0% | +54.6% |
Orora (ORA) | $2.08 | -$0.02 | -1.0% | -7.6% | -23.2% |
Insurance Australia Group (IAG) | $8.35 | -$0.08 | -0.9% | -1.1% | +8.2% |
Santos (STO) | $6.74 | -$0.06 | -0.9% | -13.7% | -4.9% |
Life360 (360) | $51.15 | -$0.41 | -0.8% | +10.0% | +197.4% |
Sonic Healthcare (SHL) | $22.08 | -$0.17 | -0.8% | -8.5% | -17.9% |
Goodman Group (GMG) | $33.85 | -$0.24 | -0.7% | -1.0% | -5.8% |
The Lottery Corporation (TLC) | $5.84 | -$0.04 | -0.7% | -0.8% | +15.0% |
Pro Medicus (PME) | $317.90 | -$2.14 | -0.7% | +4.8% | +85.5% |
Stockland (SGP) | $6.17 | -$0.04 | -0.6% | -4.3% | +15.5% |
Amcor (AMC) | $12.50 | -$0.08 | -0.6% | -5.8% | -23.5% |
Lendlease Group (LLC) | $5.24 | -$0.03 | -0.6% | -3.3% | -26.9% |
Mineral Resources (MIN) | $38.82 | -$0.22 | -0.6% | +4.9% | +2.7% |
Woolworths Group (WOW) | $27.15 | -$0.14 | -0.5% | -16.7% | -23.0% |
Coles Group (COL) | $23.50 | -$0.12 | -0.5% | +13.4% | +22.5% |
ChartWatch
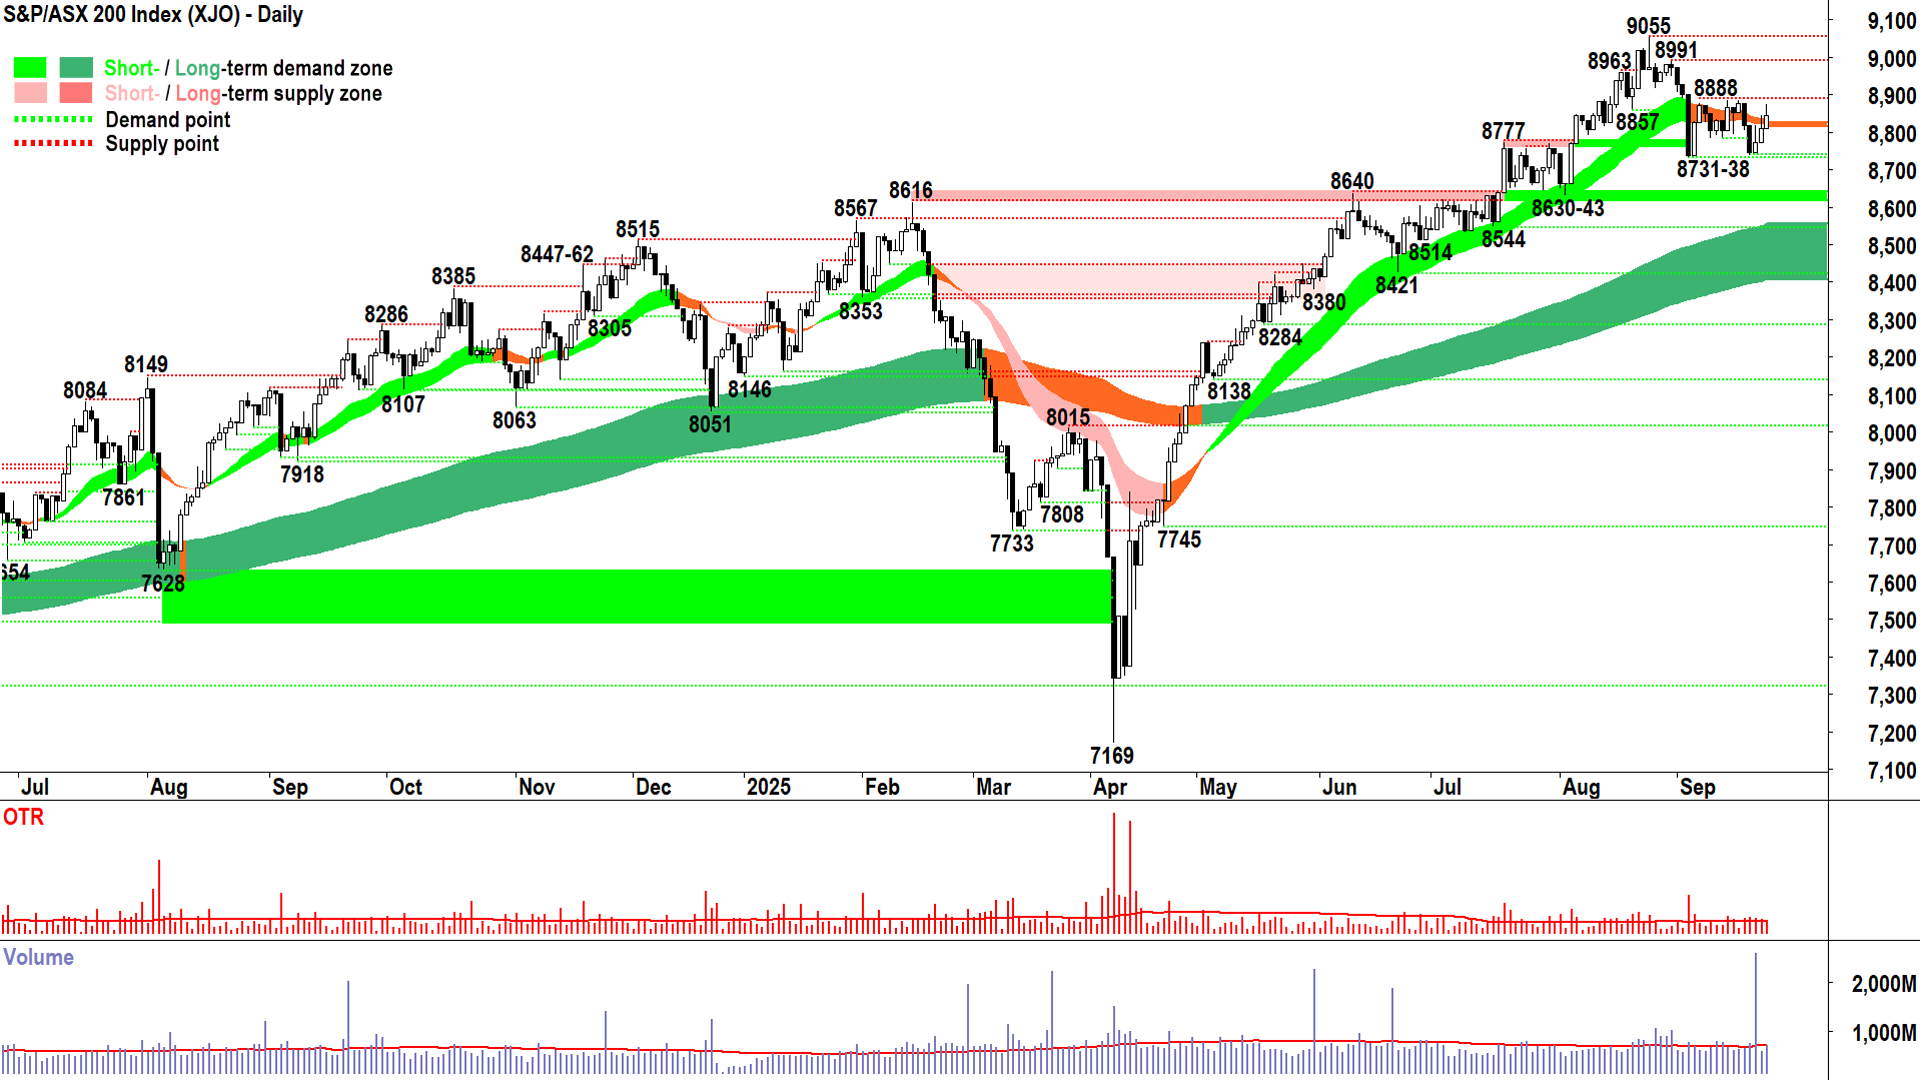
S&P/ASX 200 (XJO)
%20chart_23%20Sep.png)
S&P/ASX 200 chart (click here for full size image)
Shadow, shadow, shadow. That's 3 upward pointing shadows in a row now... and two supply-side candles before that…
There is a fund, or funds, that are drip-feeding stock into anything that resembles a rally here… and when there isn't the customary demand due to positive leads from US stocks overnight – then their selling becomes the sole dominant force.
Who? Why?* 🤔
Us mere mortals will never know! At best, we only infer their presence from the price action.
The reason upward pointing shadows bother me, is that they point to where there’s excess latent supply sitting in the system. It’s opportunistic, sell the rally supply – the most sinister sort! ⚠️
It must be dealt with, i.e., it must be consumed if the XJO price is to break free of its grip and move higher. We will know this has occurred after an emphatic close (i.e., white-bodied candle with close at or very near high) above the top of the upward pointing shadows.
Let’s call that level 8888 – the 16-Sep high that marks the top of a zone of supply encompassing three recent minor peaks (5-Sep 8881, 12-Sep 8888, and 16-Sep 8888).
But as pesky as that overhead supply is, there remains a decent base of excess demand at 8731-38. And so, in the middle, we sit... and wait…
For a break!
A break that will likely define a strong move either to test the all-time high at 9055 (a close > 8888 🤞) or the make-or-break dynamic excess demand at the long term uptrend ribbon (a close < 8731 😭).
Conclusion: While this churn is going on, I’m very happy at 2/3RP (Risk Position = my personal capital allocation model allows me to invest up to 67% (i.e., 2/3) of my capital).
(*I do have a theory regarding who and why. Total stab in the dark… but I’m going with Japanese pension funds repatriating yen after pulling out of Aussie high yield assets 🧐.

Japanese 2-year Government bond yield chart
The chart above is the Japanese 2-year Government bond yield. As it rises, it becomes more attractive for the big Japanese pension funds – who for decades have been forced to look offshore for yield – to bring their money back home. As a stable jurisdiction with a liquid currency and world-leading yields, Australia has long been a favoured destination for these funds!)
Technical analysis for the Nasdaq, commodities, and more has a new home!
ChartWatch coverage of the Nasdaq Composite, other major global stock indices, commodities, bonds, FX and crypto has a new, dedicated home: ChartWatch Markets.
Economy
Today
09:00 AUS September Purchasing Managers Index (PMI)
Manufacturing: 51.6 vs August 53.0
Services: 52.0 vs August 55.8
Comment: Readings over 50 indicate expansion in a category, so we can say from this data that Australian business activity grew at a sharply lower rate in August.
Later this week
Tuesday
17:30 Eurozone Various September PMI's
GER Manufacturing: 50.0 forecast vs August 48.8
GER Services: 49.5 forecast vs August 49.3
EUR Manufacturing: 50.7 forecast vs August 50.7
EUR Services: 50.6 forecast vs August 50.5
23:45 USA September PMI's
Manufacturing: 51.8 forecast vs August 53.0
Services: 53.8 forecast vs August 54.5
Wednesday
02:35 USA US Federal Reserve Chairman Jerome Powell speaks
11:30 AUS August Consumer Price Index (CPI) (+2.9% p.a. forecast vs July +2.8% p.a.)
Thursday
00:00 USA August New Home Sales (651,000 forecast vs July 652,000)
22:30 USA August Core Durable Goods (-0.2% m/m vs July +1.0% m/m)
Friday
00:00 USA August Existing Home Sales (3.96 million forecast vs July 4.01 million)
22:30 USA August Personal Consumption Expenditures (PCE)
Price Index: +0.2% m/m vs July +0.3% m/m
Personal Income: +0.3% m/m vs July +0.4% m/m
Personal Spending: +0.5% m/m vs July +0.5% m/m
Latest News
Interesting Movers
Trading higher
+20.0% Caprice Resources (CRS) – No news, general strength across the broader Precious Metals sector today, rise is consistent with prevailing short and long term uptrends, a regular in ChartWatch ASX Scans Uptrends list 🔎📈
+18.8% Cettire (CTT) – Change in substantial holding, (D. Mintz, 33% to 36%), rise is consistent with prevailing short term uptrend and rising peaks and rising troughs 🔎📈
+17.3% Boab Metals (BML) – Response to ASX Price and Volume Query, rise is consistent with prevailing short and long term uptrends, a regular in ChartWatch ASX Scans Uptrends list 🔎📈
+17.3% Chalice Mining (CHN) – No news, general strength across the broader Critical Minerals sector today, rise is consistent with prevailing short and long term uptrends, a recent regular in ChartWatch ASX Scans Uptrends list 🔎📈
+15.8% St George Mining (SGQ) – No news, general strength across the broader Precious Metals sector today, rise is consistent with prevailing short and long term uptrends, a regular in ChartWatch ASX Scans Uptrends list 🔎📈
+14.3% Dateline Resources (DTR) – Dateline Corporate Presentation September 2025, general strength across the broader Critical Minerals sector today, rise is consistent with prevailing short and long term uptrends, a regular in ChartWatch ASX Scans Uptrends list 🔎📈
+13.2% Elevate Uranium (EL8) – No news, rise is consistent with prevailing short term uptrend and long term trend is transitioning from down to up 🔎📈
+12.0% Ballard Mining (BM1) – No news, general strength across the broader Precious Metals sector today, rise is consistent with prevailing short and long term uptrends, a recent regular in ChartWatch ASX Scans Uptrends list 🔎📈
+11.7% Saturn Metals (STN) – No news, general strength across the broader Precious Metals sector today, rise is consistent with prevailing short and long term uptrends, a regular in ChartWatch ASX Scans Uptrends list 🔎📈
+10.0% Lumos Diagnostics (LDX) – No news, rise is consistent with prevailing short and long term uptrends, a regular in ChartWatch ASX Scans Uptrends list 🔎📈
+9.9% Kingsgate Consolidated (KCN) – No news, general strength across the broader Precious Metals sector today, rise is consistent with prevailing short and long term uptrends, a regular in ChartWatch ASX Scans Uptrends list 🔎📈
+9.3% Veem (VEE) – No news, rise is consistent with prevailing short term uptrend and long term trend is transitioning from down to up 🔎📈
+9.2% Telix Pharmaceuticals (TLX) – CMS Grants Transitional Pass-Through Status for Gozellix.
+9.1% Forrestania Resources (FRS) – Forrestania Resources - Acquires Tenure Adjacent to Edna May, rise is consistent with prevailing short and long term uptrends, a regular in ChartWatch ASX Scans Uptrends list 🔎📈
+8.5% Golden Horse Minerals (GHM) – Diamond Drilling Confirms Further High-Grade At Hopes Hill, rise is consistent with prevailing short and long term uptrends, a regular in ChartWatch ASX Scans Uptrends list 🔎📈
+8.4% Metallium (MTM) – No news, rise is consistent with prevailing short and long term uptrends, a regular in ChartWatch ASX Scans Uptrends list 🔎📈
+8.3% Torque Metals (TOR) – No news since 22-Sep Strong gold intercept and new conductors extend Paris, general strength across the broader Precious Metals sector today, rise is consistent with prevailing short and long term uptrends, a regular in ChartWatch ASX Scans Uptrends list 🔎📈
+8.0% Lynas Rare Earths (LYC) – No news 22-Sep Presentation to ASA QLD Investor Summit, general strength across the broader Precious Metals sector today, rise is consistent with prevailing short and long term uptrends, a regular in ChartWatch ASX Scans Uptrends list 🔎📈
+7.4% Challenger Gold (CEL) – Change in substantial holding, general strength across the broader Precious Metals sector today, (E. Elsztain, 12.8% to 14.2%), rise is consistent with prevailing short and long term uptrends, a regular in ChartWatch ASX Scans Uptrends list 🔎📈
+7.1% Titomic (TTT) – Opening of New European Facility in Heerenveen, Netherlands, rise is consistent with prevailing short and long term uptrends 🔎📈
+6.9% Droneshield (DRO) – No news 🤔
Trading lower
-25.0% Myer (MYR) - FY25 Results - Release and Presentation, fall is consistent with prevailing short and long term downtrends, a regular in ChartWatch ASX Scans Downtrends list 🔎📉
-13.4% Coronado Global Resources (CRN) - No news, repelled perfectly from long term downtrend ribbon! 🔎📉
-8.9% LTR Pharma (LTP) - No news since 22-Sep LTR Pharma secures 33% ownership in LevOmega.
-8.3% Vection Technologies (VR1) - No news 22-Sep Vection secures $22m deal with NATO-approved partner, pulled back after yesterday's sharp rally due to N.
-7.1% Felix Gold (FXG) - No news, pulled back in the wake of recent sharp rally.
Broker Moves
Amcor Plc (AMC)
Initiated at sector perform at RBC Capital Markets; Price Target: $13.60
ANZ Group Holdings (ANZ)
Retained at neutral at Macquarie; Price Target: $32.50 from $31.00
Bendigo and Adelaide Bank (BEN)
Retained at underperform at Macquarie; Price Target: $11.00 from $10.50
Bank of Queensland (BOQ)
Retained at underperform at Macquarie; Price Target: $6.00 from $5.75
Commonwealth Bank of Australia (CBA)
Retained at underperform at Macquarie; Price Target: $106.00 from $105.00
CSL (CSL)
Retained at overweight at Morgan Stanley; Price Target: $285.00 from $291.00
Generation Development Group (GDG)
Initiated at buy at Bell Potter; Price Target: $8.20
IGO (IGO)
Retained at outperform at Macquarie; Price Target: $5.50
Judo Capital Holdings (JDO)
Retained at outperform at Macquarie; Price Target: $1.90
LendLease Group (LLC)
Retained at buy at Citi; Price Target: $6.70
Liontown Resources (LTR)
Retained at underperform at Macquarie; Price Target: $0.65
MA Financial Group (MAF)
Retained at accumulate at Morgans; Price Target: $10.63 from $10.23
Minerals 260 (MI6)
Retained at speculative buy at Bell Potter; Price Target: $0.34
Mineral Resources (MIN)
Retained at underperform at Macquarie; Price Target: $30.00
Monadelphous Group (MND)
Retained at buy at Citi; Price Target: $23.60
National Australia Bank (NAB)
Retained at neutral at Macquarie; Price Target: $37.50 from $35.50
NRW Holdings (NWH)
Retained at buy at Citi; Price Target: $4.05
Pilbara Minerals (PLS)
Retained at outperform at Macquarie; Price Target: $2.30
PMET Resources Inc (PMT)
Retained at outperform at Macquarie; Price Target: $0.50
Platinum Asset Management (PTM)
Downgraded to hold from buy at Bell Potter; Price Target: $0.70 from $0.60
REA Group (REA)
Retained at neutral at Macquarie; Price Target: $255.00
Regis Healthcare (REG)
Retained at overweight at Jarden; Price Target: $8.20 from $8.95
Retained at buy at Jefferies; Price Target: $8.40 from $9.90
Retained at outperform at Macquarie; Price Target: $7.90
Retained at buy at Ord Minnett; Price Target: $8.50 from $9.00
Retained at sector perform at RBC Capital Markets; Price Target: $7.50 from $8.50
Reece (REH)
Retained at neutral at Citi; Price Target: $13.10
Retained at buy at Ord Minnett; Price Target: $14.50
SEEK (SEK)
Upgraded to buy from neutral at Bank of America; Price Target: $33.50 from $28.75
Retained at outperform at Macquarie; Price Target: $32.50
Santana Minerals (SMI)
Retained at buy at Shaw and Partners; Price Target: $1.63
Santos (STO)
Retained at outperform at Macquarie; Price Target: $8.45
Southern Cross Media Group (SXL)
Retained at underweight at Morgan Stanley; Price Target: $0.65
Transurban Group (TCL)
Retained at buy at Citi; Price Target: $16.10
Telstra Group (TLS)
Retained at outperform at Macquarie; Price Target: $5.04
TPG Telecom (TPG)
Retained at outperform at Macquarie; Price Target: $5.60
Universal Store Holdings (UNI)
Retained at outperform at Macquarie; Price Target: $10.20
Vault Minerals (VAU)
Retained at overweight at Barrenjoey; Price Target: $0.68
Retained at buy at Canaccord Genuity; Price Target: $0.75
Downgraded to neutral from buy at Jarden; Price Target: $0.49 from $0.51
Retained at outperform at Macquarie; Price Target: $0.65
Downgraded to hold from buy at Moelis Australia; Price Target: $0.69 from $0.67
Downgraded to neutral from buy at UBS; Price Target: $0.72 from $0.75
Westpac Banking Corporation (WBC)
Retained at underperform at Macquarie; Price Target: $31.00 from $30.00
Scans
Top Gainers
Code | Company | Last | % Chg |
|---|---|---|---|
| EV8 | Everlast Minerals Ltd | $0.31 | +55.00% |
| IS3 | I Synergy Group Ltd | $0.014 | +40.00% |
| HYD | HYDRIX Ltd | $0.018 | +38.46% |
| T92 | Terra Uranium Ltd | $0.085 | +34.92% |
| BGT | Bio-Gene Technology Ltd | $0.041 | +32.26% |
Top Fallers
Code | Company | Last | % Chg |
|---|---|---|---|
| BCC | Beam Communications Holdings Ltd | $0.098 | -27.41% |
| MYR | Myer Holdings Ltd | $0.48 | -25.00% |
| PLN | Pioneer Lithium Ltd | $0.135 | -20.59% |
| XGL | Xamble Group Ltd | $0.016 | -20.00% |
| YUG | Yugo Metals Ltd | $0.041 | -18.00% |
52 Week Highs
Code | Company | Last | % Chg |
|---|---|---|---|
| EV8 | Everlast Minerals Ltd | $0.31 | +55.00% |
| T92 | Terra Uranium Ltd | $0.085 | +34.92% |
| ENX | Enegex Ltd | $0.03 | +25.00% |
| ILT | Iltani Resources Ltd | $0.415 | +23.88% |
| BCM | Brazilian Critical Minerals Ltd | $0.033 | +22.22% |
52 Week Lows
Code | Company | Last | % Chg |
|---|---|---|---|
| MYR | Myer Holdings Ltd | $0.48 | -25.00% |
| OB1DD | Orbminco Ltd | $0.02 | -16.67% |
| CVV | Caravel Minerals Ltd | $0.13 | -7.14% |
| BKT | Black Rock Mining Ltd | $0.017 | -5.56% |
| COB | Cobalt Blue Holdings Ltd | $0.048 | -4.00% |
Near Highs
Code | Company | Last | % Chg |
|---|---|---|---|
| FFM | Firefly Metals Ltd | $1.36 | +3.42% |
| BILL | Ishares Core Cash ETF | $100.66 | -0.01% |
| AGI | Ainsworth Game Technology Ltd | $1.05 | +3.45% |
| HGBL | Betashares Global Shares Currency Hedged ETF | $75.08 | +0.51% |
| CWP | Cedar Woods Properties Ltd | $7.55 | +0.27% |
Relative Strength Index (RSI) Oversold
Code | Company | Last | % Chg |
|---|---|---|---|
| WDS | Woodside Energy Group Ltd | $22.87 | +0.26% |
| PGC | Paragon Care Ltd | $0.29 | 0.00% |
| EBO | Ebos Group Ltd | $26.09 | +2.15% |
| REG | Regis Healthcare Ltd | $6.53 | -3.97% |
| DMP | Domino's PIZZA Enterprises Ltd | $13.62 | -0.80% |
