ChartWatch Markets: Disaster awaits grossly overvalued US stocks, as iron ore and copper flirt with breakouts
Technical analysis of the most important global stock indices, commodities, bonds, FX, and crypto impacting your ASX portfolio each day.


Source: Shutterstock
Mentioned
KEY POINTS
- The Nasdaq Composite just keeps keeping on – and it seems the cries from the doubters have fallen silent!
- Most major investment banks and the Australian government peg the Iron ore price around US$80/t, yet its trading over US$100/t, and its chart suggests it may go even higher.
- US copper prices crashed in late-July after the Trump Administration surprised traders by excluding certain refined products. COMEX prices are recovering slowly, but the London-based contract suggests a brighter outlook for the red metal.
In today's edition of ChartWatch Markets, we'll be covering the technicals for:
Nasdaq Composite
Iron Ore 62% (Front month, back-adjusted) SGX
High Grade Copper Futures (Front month, back-adjusted) COMEX
Copper - LME Official Cash
Nasdaq Composite Index

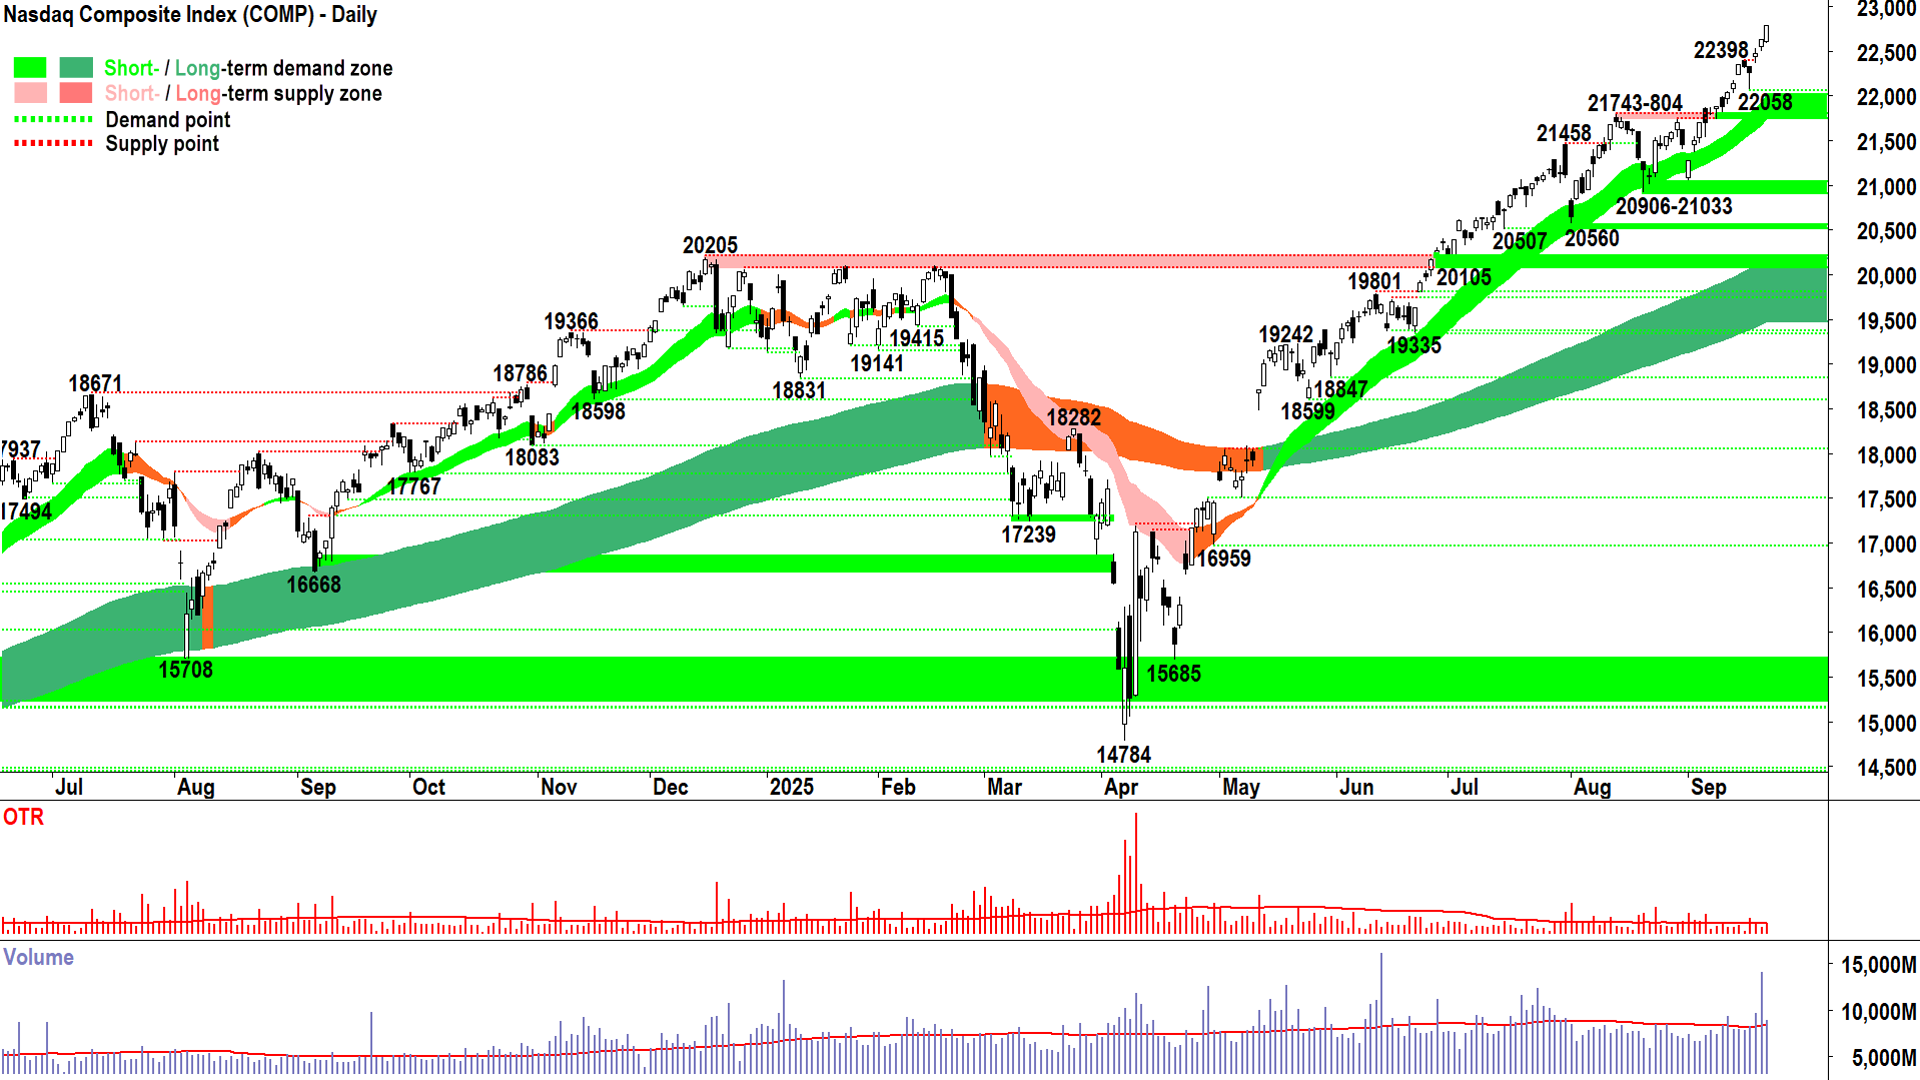
An interesting chart (click here for full size image)
Gotcha! 😉
Click-bait headlines of impending doom never fail when stocks are making new highs!
The headline of this article is very much tongue in cheek, but is it just me, or apart from this one, have the headlines about “insane overvaluations” and “impending crash indicators” for US stocks pretty much disappeared? 🤔
I swear I was reading these headlines several times a day across the major finance websites over the last couple of weeks, but they appear to have died down over the last few trading sessions.
But this happens all the time! They want you to click, but eventually the Comp renders such slogans irrelevant!
To be fair to finance journos, it gets harder and harder to a find value investor prepared to make yet another claim of rampant overvaluations and impending doom! Certainly, value investors are very vocal on the way up as their brains struggle to reconcile their own personal understanding of how markets work against their psychological anchors regarding what constitutes value, or otherwise 🤯.
As stocks pump to one record high after another… value investors tend to grow quieter and quieter... and when the Comp grinds north in a metronomic fashion – like it is now – that’s when they’re completely silent. Most likely, they're hiding away in their offices frantically re-reading their copies of Benjamin Graham’s “The Intelligent Investor” and lighting candles and incense beneath their framed portraits of Warren Buffett! 🤣
But don’t worry, they’ll be back… as soon as the Comp experiences an inevitable pullback – they'll be ready to remind us how they “told us so” and how stock prices are still overvalued! 🤦
Let's drill it down... the Comp chart above is either:
1. Value Investor’s explanation: Overvalued; overbought; being driven by stupid amateurs, stupid speculators, stupid passive funds, dumb money etc.; a bazillion times historical earnings / a bazillion times the Shiller Ratio; identical to 1929, 1973, 1982, 1987, 2001, 2007, 2020 etc.; going to crash, day of reckoning is coming, sure to end in tears; greedy when it should be fearful… etc. etc. etc.
Or:
2. Trend Follower’s Explanation: A picture of extreme excess demand (D > S = P⬆️).
You know which version I prefer! 💯
But I do agree that the first option is a problem IF YOU DON’T have a model for determining when the prevailing uptrend is changing. Fortunately, WE DO:
The price action will change from rising peaks and rising troughs to falling peaks (initially) and falling troughs.
The candles will change from predominantly demand-side in nature (i.e., white-bodied candles and or downward pointing shadows) to predominantly supply-side in nature (i.e., black-bodied candles and or upward pointing shadows).
The short term uptrend ribbon (light green) will neutralise (turn amber), and eventually turn down (light pink). The price will close below the short term uptrend ribbon, and the short term uptrend will begin to act as a zone of dynamic excess supply.
Eventually, the long term uptrend ribbon (dark green) will neutralise (turn amber), and eventually turn down (dark pink). The price will close below the long term uptrend ribbon, and the short term uptrend will begin to act as a zone of dynamic excess supply (when this occurs we’re in a bear market and value investors are delirious with joy! Praise Buffett – look at all those stupid investors swimming naked!!!).
Given I see none, zip, zero, nil and nada of the above, I must therefore conclude total demand-side control. This means:
Owners of cash want to own shares (i.e., demand), and they’re highly motivated to do so (they’re bidding up price rather than hanging around waiting for supply to appear!).
Owners of shares want to own shares (i.e., supply), and they’re highly motivated to do so (they’re only parting with their shares if they’re offered higher, and higher prices… rather than dumping their stock into the market).
Given neither the demand nor supply-sides of the market appear worried about present valuations, neither am I (trend follower remember – my opinion is the market’s opinion!).
= I prefer to stay the course here at FRP (Full Risk Position = my personal capital allocation model allows me to invest up to 100% of my capital).
Key levels: 22058 is the closest point of demand, the price should not close below here if the demand-side is in control of the Comp's price; a close below the short term uptrend ribbon (presently 21740-22010) will nullify the short term uptrend = ⚠️
Iron Ore 62% (Front month, back-adjusted) SGX
%20SGX%20chart_23%20Sep.png)
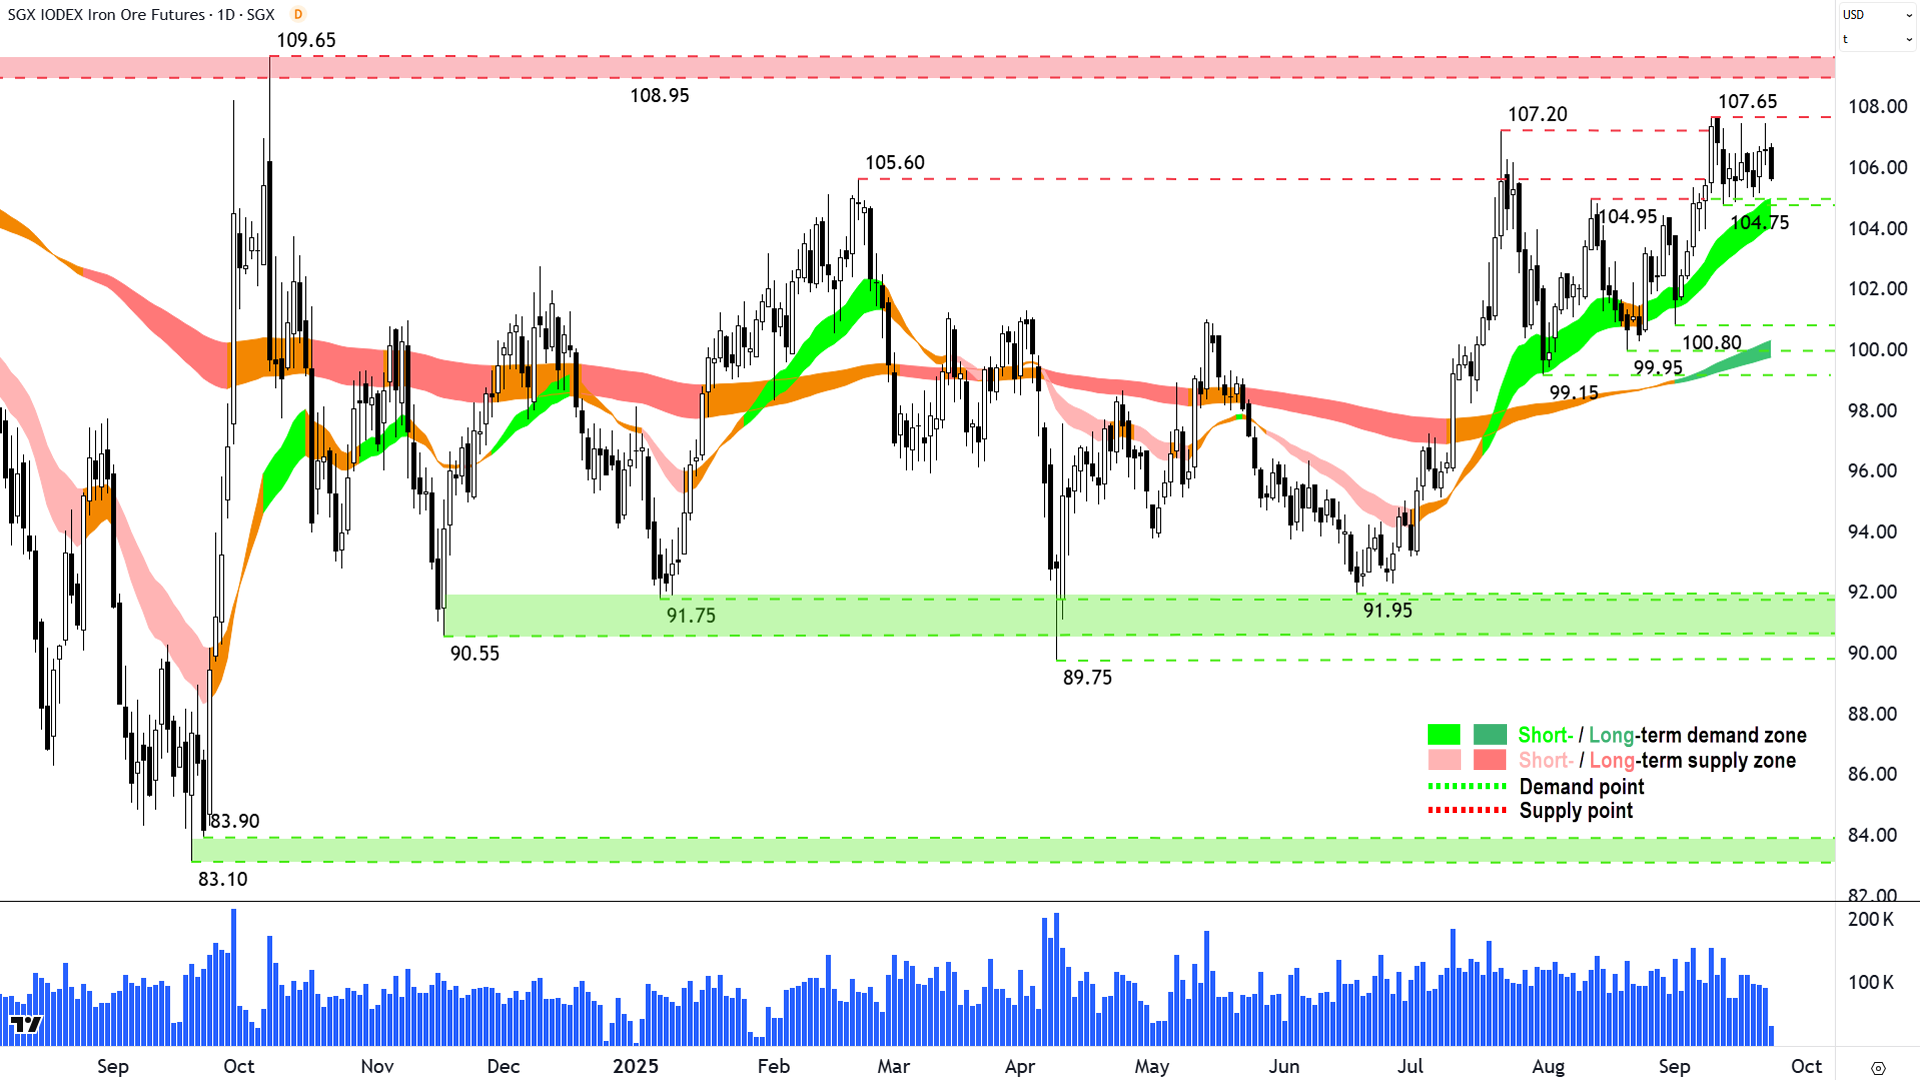
Can it? Will it? Might it? (click here for full size image)
The last time we covered iron ore was in ChartWatch in the Evening Wrap on 5-Sep.
In that update, we noted and improving short term uptrend for iron ore, calling it a “better than a warm prospect for continued upside”.
Such confidence! Yet iron ore has indeed inched higher.
The main issue impeding iron ore’s upside then is the same as right now: A potential wall of latent supply at 108.95-109.65. Some good news, though, the 107.20 point of supply was consumed – if not very emphatically.
Since then, the price has stalled largely between the aforementioned overhead supply and a base of excess demand that’s presenting around 104.75-95.
Price action and candles are mixed in the recent consolidation, offering few clues as to whether iron ore can seal the deal and deliver a decisive attack on 108.95-109.65. I’m happy to give it the benefit of the doubt as long as the short term uptrend ribbon continues to do its job of acting as a zone of dynamic excess demand.
Logic suggests then that a close below the short term uptrend ribbon severely damages the notion that the demand-side is in control of the iron ore’s short term price. Put another way: A close below the short term uptrend ribbon kills the short term uptrend.
Conclusion: Treading water here with an upside bias while the short term uptrend ribbon holds. Clearly, an emphatic close above 107.65 sets a more positive tone, but 108.95-109.65 remains the nut the demand-side will have to crack to trigger a proper shock to the current market thinking that participants have all the time in the world…
Copper: COMEX High Grade (Front month, back-adjusted) & LME Official Cash
%20COMEX%20chart_23%20Sep.png)
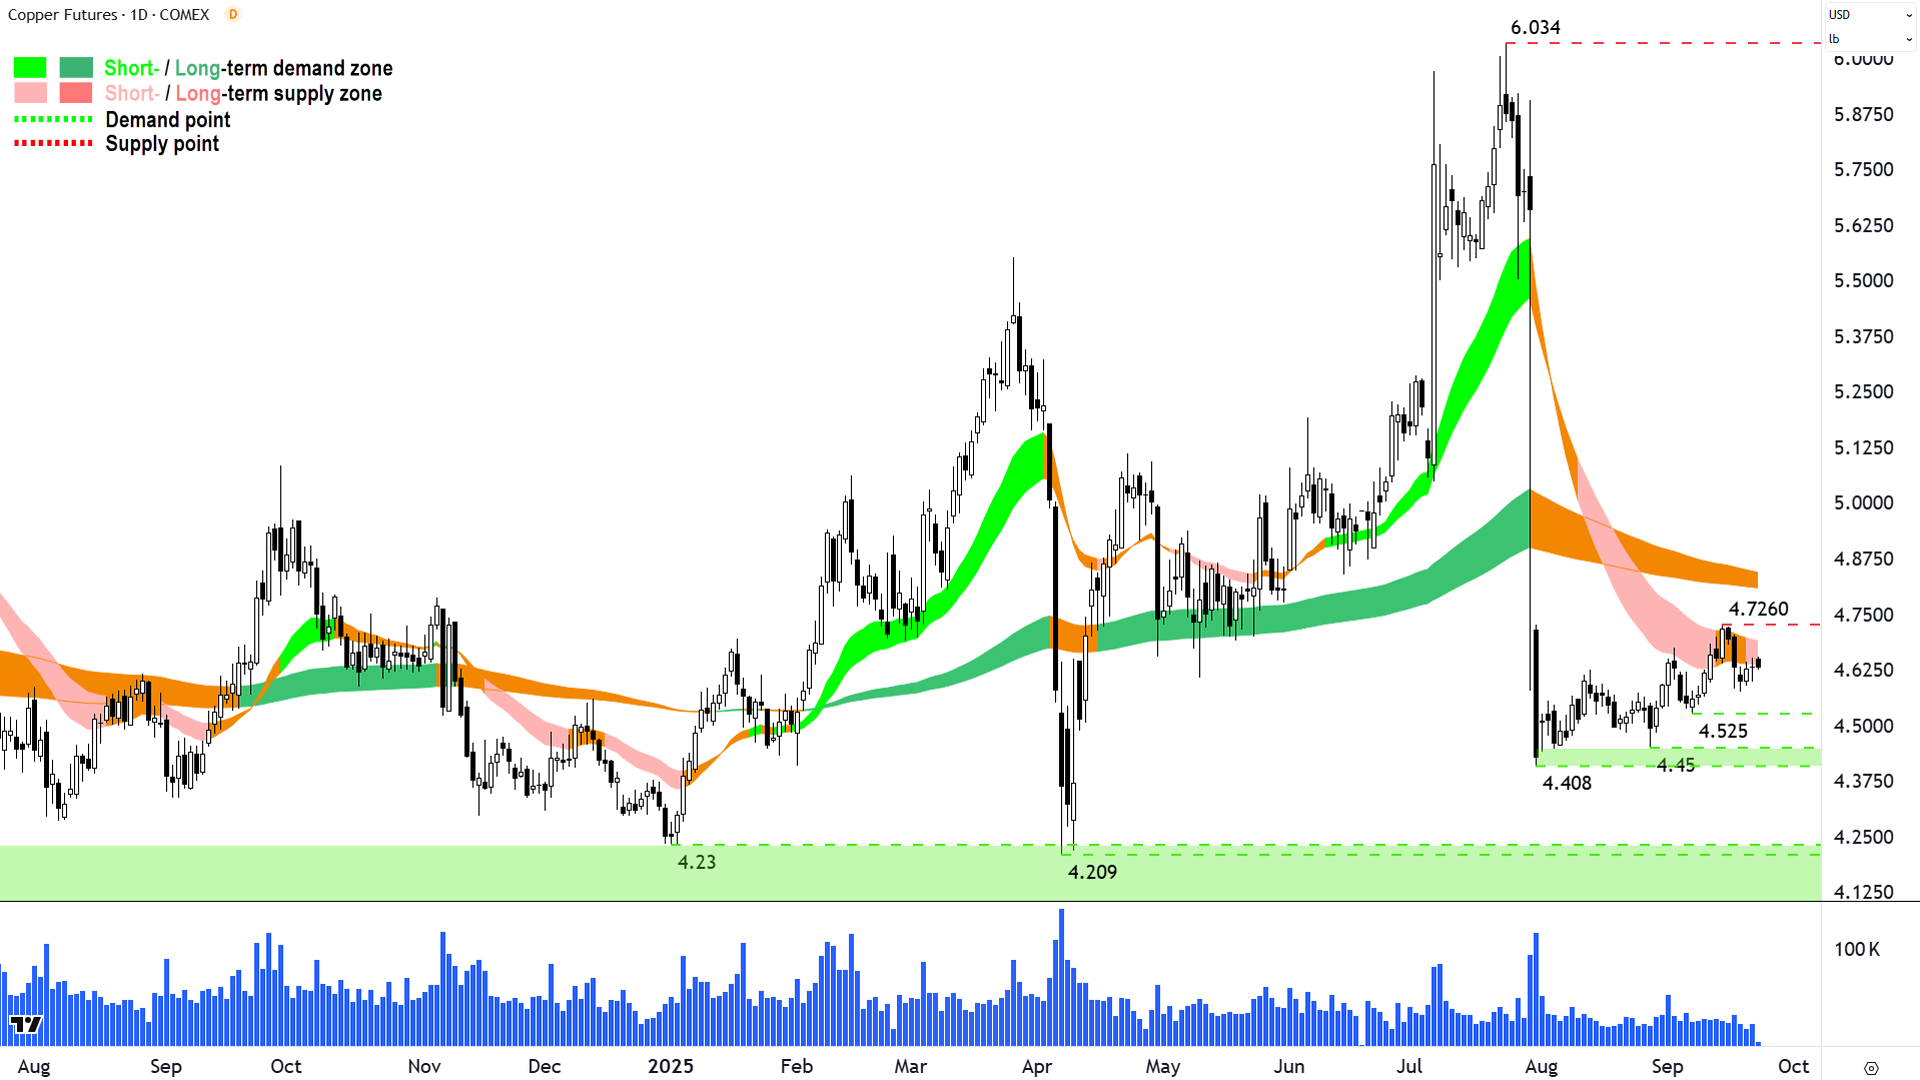
No prize for guessing when the tariff announcement was made! 💥 (click here for full size image)
The last time we covered copper was all the way back in ChartWatch in the Evening Wrap on 31-Jul!
The reason for its absence!?
That last update came immediately after the Trump administration announced its copper tariff policy – which excluded refined copper, cathodes, ores, and concentrates – contrary to widespread expectations that the new tariff regime would target the entire copper supply chain. Since then, high grade copper has been a non-event.
No prizes for spotting the candle that marked the big news!!! 💥
Very brief on COMEX high grade copper, as whilst the price action has reverted to rising peaks and rising troughs, candles remain mixed in my opinion, and the short term trend ribbon remains down and is now behaving as a zone of excess supply. So that's one tick, two crosses, I’m afraid… ✅❌❌.
I don’t think you need to look at this chart until the price closes back above the long term trend ribbon (now neutral).
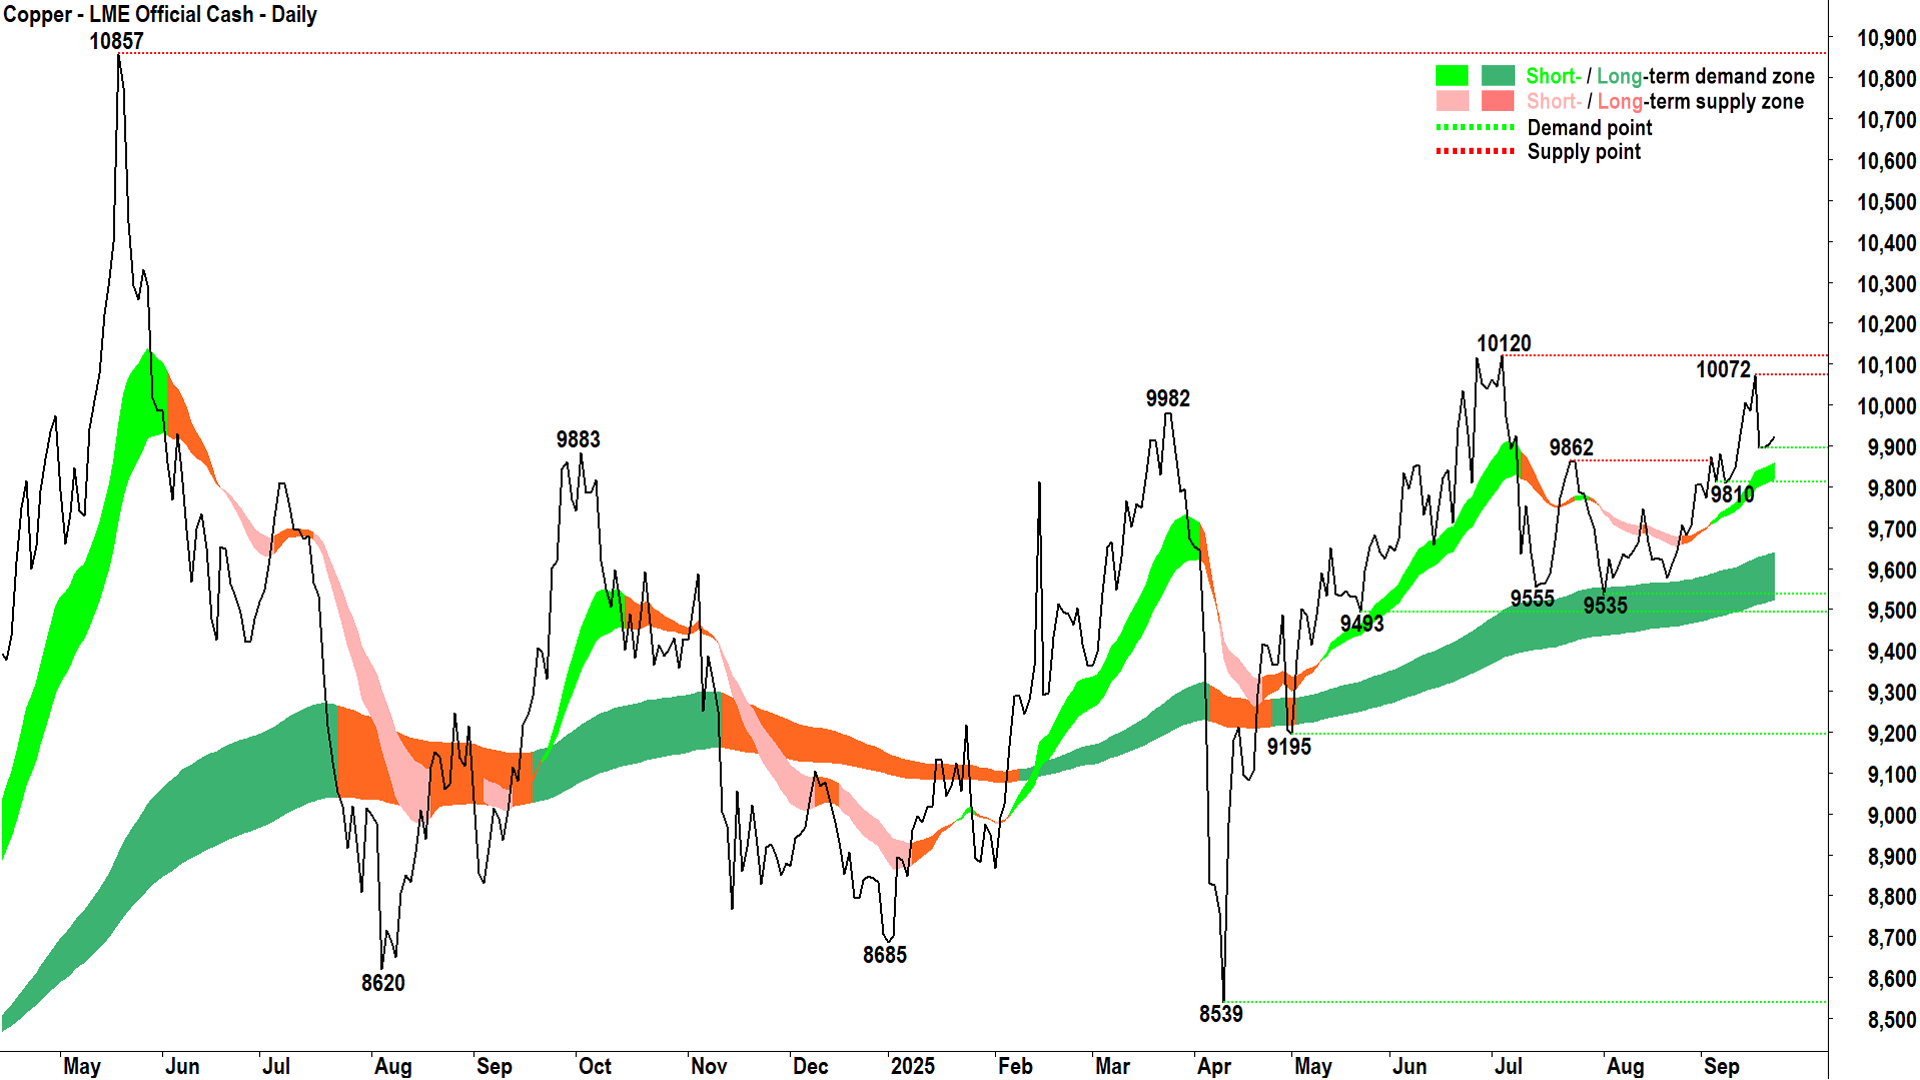
US copper is likely a no-show for the foreseeable future as traders work through a backlog of pre-tariff front-loaded inventory. We can get a better idea of the underlying trends in global copper demand and supply by looking at the LME copper price.

LME Copper (Front month, back-adjusted) COMEX (click here for full size image)
The trends are better here, as we can see a decent short term uptrend within a well-established, but gentle long term uptrend. The price action is largely rising peaks and rising troughs (there are a few minor blips in there but generally speaking).
10072-10120 is capping upside and 9810 and the short term uptrend ribbon is developing as a base of excess demand.
Conclusion: Much like iron ore, copper is: “treading water here with an upside bias while the short term uptrend ribbon holds”. Also like iron ore, my interest is piqued by the fact that an important supply zone is within close proximity (10072-10120) – and a close above it could spark a sharper move to the upside as participants realise there’s been a significant escalation in urgency!
ChartWatch *LIVE* Webinar
ChartWatch *LIVE* Webinars – WEEKLY Wednesday's @ 12pm AEDT
Learn more about technical analysis and trend following through real case studies on ASX stocks. Australia's premier technical analyst, Carl Capolingua, shares his unique insights on stocks as requested by viewers. Ask about a company in your portfolio or anything related to trading and investing and get Carl's expert opinion.
Places are limited so >REGISTER NOW!<
