News | Market Wraps
Evening Wrap: ASX 200 closes week strong on surging Gold stocks, as major danger event looms in US tonight
The S&P/ASX 200 closed 44.7 points higher, up 0.51%.

Mentioned
The S&P/ASX 200 closed 44.7 points higher, up 0.51%.
Snooze... Friday's are rarely shoot the lights out affairs for the ASX 200... but it feels like traders were happy to eke their way into the weekend rather than go out with a big bang!
Gold (XGD) (+2.1%) stocks bounced back from a couple of days of softness to cap what could go down as a pivotal week – certainly many enjoyed solid gains and the gold price did print a new, record high 🚀.
Elsewhere, interest rate sensitive sectors like Consumer Discretionary (XDJ) (+1.3%), Real Estate (XPJ) (+1.4%) and Information Technology (XIJ) (+1.2%) also did well, as Resources (XJR) (+0.1%) stocks were generally flat, and Energy (XEJ) (-0.3%) stocks slipped.
Be sure to click/scroll through for the usual reporting of the major sector and stock-specific moves, the broker responses to them, as well as all the key economic data in tonight's Evening Wrap.
Also, I have detailed technical analysis on the Nasdaq Composite, the S&P/ASX 200, and iron ore in today's ChartWatch.
Let's dive in!
Today in Review
Fri 05 Sep 25, 5:02pm (AEST)
Name | Value | % Chg |
|---|---|---|
Major Indices | ||
| ASX 200 | 8,871.2 | +0.51% |
| All Ords | 9,140.5 | +0.54% |
| Small Ords | 3,635.1 | +1.28% |
| All Tech | 4,191.4 | +1.05% |
| Emerging Companies | 2,675.9 | +1.31% |
Currency | ||
| AUD/USD | 0.6535 | +0.26% |
US Futures | ||
| S&P 500 | 6,526.5 | +0.24% |
| Dow Jones | 45,730.0 | +0.09% |
| Nasdaq | 23,774.0 | +0.45% |
Name | Value | % Chg |
|---|---|---|
Sector | ||
| Real Estate | 4,125.1 | +1.37% |
| Consumer Discretionary | 4,556.6 | +1.33% |
| Information Technology | 2,881.4 | +1.18% |
| Industrials | 8,665.1 | +0.59% |
| Communication Services | 1,887.0 | +0.57% |
| Financials | 9,624.0 | +0.47% |
| Materials | 17,853.6 | +0.28% |
| Utilities | 9,876.7 | +0.19% |
| Health Care | 38,907.4 | +0.06% |
| Energy | 9,135.5 | -0.28% |
| Consumer Staples | 12,212.2 | -0.31% |
Markets
%20intraday%20chart_5%20Sep.png)
ASX 200 Session Chart
The S&P/ASX 200 (XJO) finished 44.7 points higher at 8,871.2, 0.51% from its session low and just 0.11% from its high. In the broader-based S&P/ASX 300 (XKO) advancers beat decliners by resounding 200 to 75. For the week, the XJO finished down 102 points or 1.1% lower, 1.6% from its intraweek low and 1.2% from its intraweek high.
As is usually the case, big moves in stock markets are driven by important / big moves in the bond market.
As you've heard me say every time there's been an important move in the bond market that's moved stocks – everything starts in the bond market.
That's the market that determines the price of money, and the price of money determines the price of all other risk assets (major government bonds are considered risk free).
The general rule of thumb is that stocks prefer lower bond yields to higher bond yields. Here are the main reasons why:
Benchmark bonds set the price of benchmark lending rates – the availability and cost of acquiring capital – sets the tone for risk taking ability.
The cost of capital is a cell in every major investment fund's discounted cash flow analysis (DCF) of stocks in their universe – it helps them account for the time value of money and how this impacts each stock's forecast earnings. The higher the cost of capital, the more punitively future earnings are discounted and vice versa: Higher bond yields diminish the perceived value of stocks in general and lower bond yields support them
There are obvious benefits to companies from lower borrowing costs – via cheaper debt to fund earnings growth, and for their customers, affording consumers greater spending power. This is a double whammy benefit (lower costs, higher revenues equals greater profits 💰💰💰).
Less competition – bonds are seen as "safe" or "risk off" investments compared to stocks which are big balls of risk ("Oh no Carl, not my blue chips... No they're all safe!!!*) and are considered "risk on" investments. Lower bond yields makes stocks yields appear more attractive to investors
So what happened in the bond market this week? 🤔
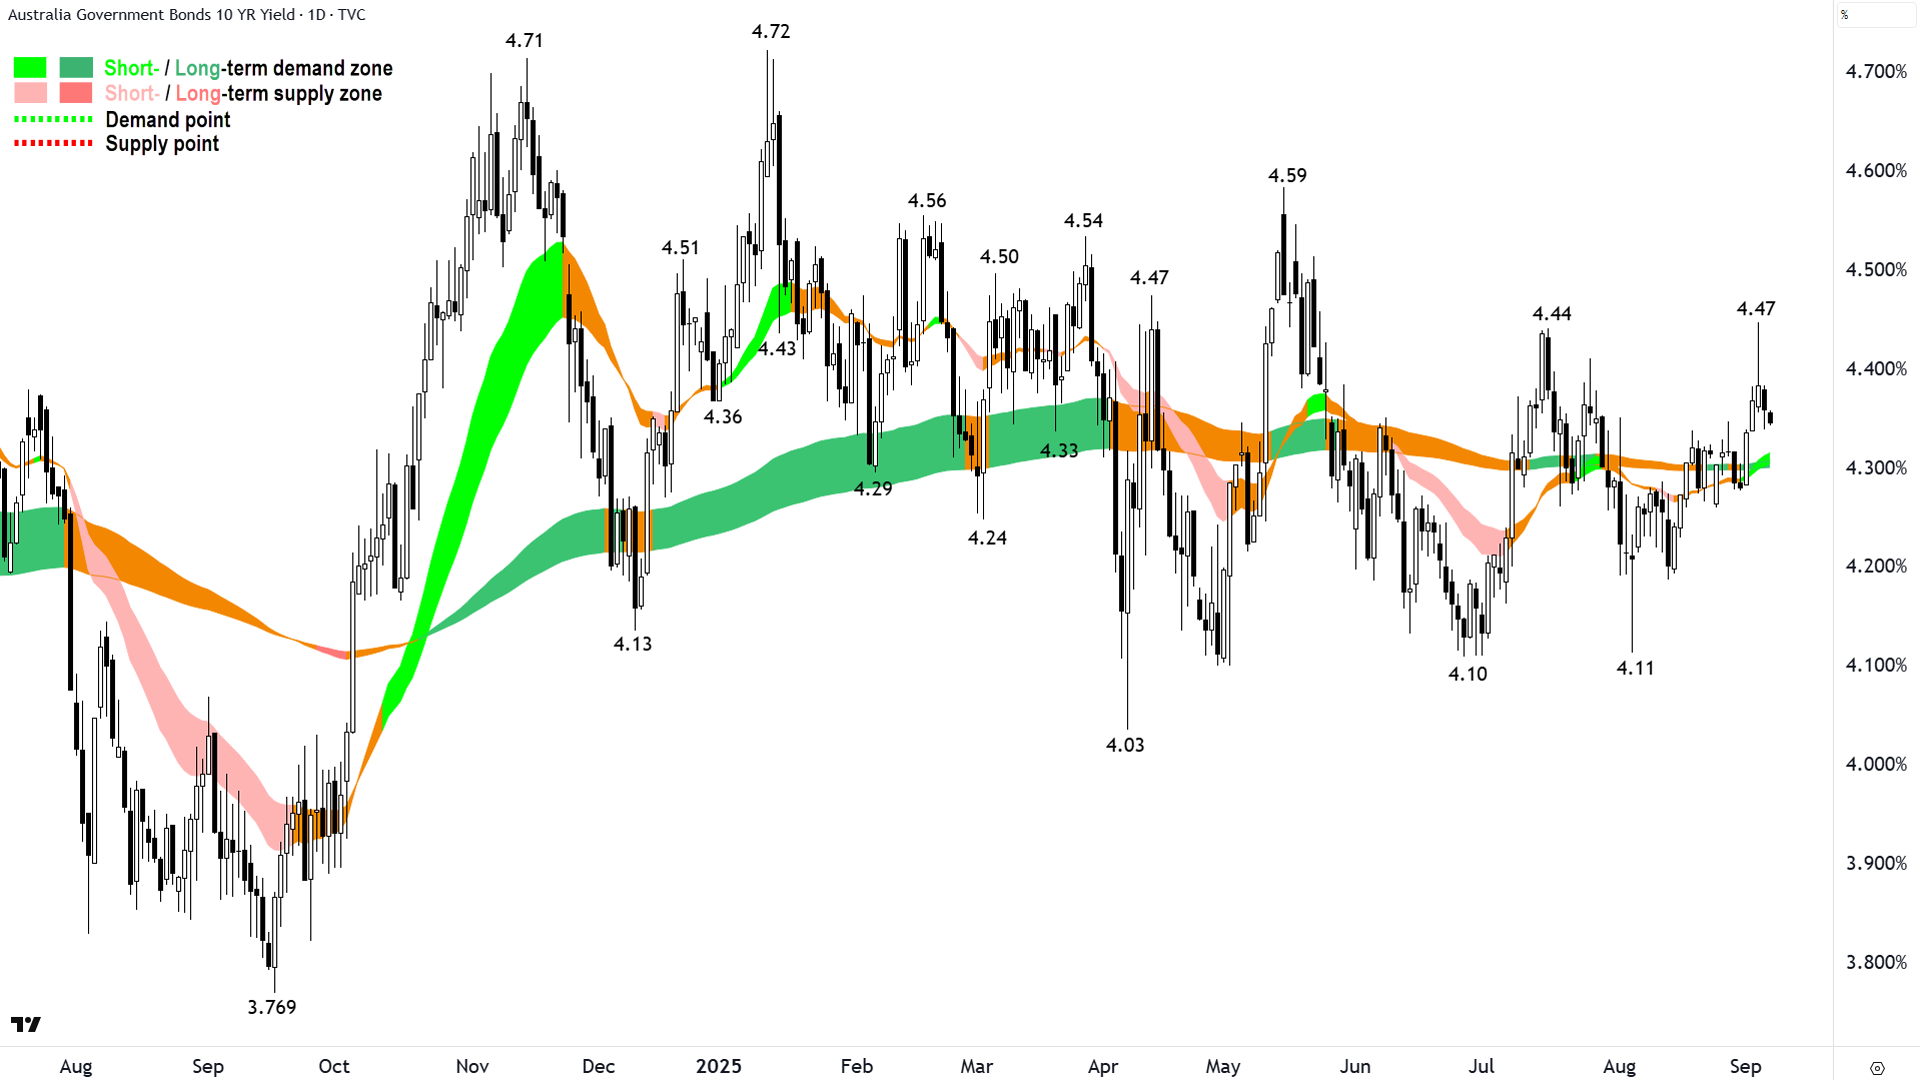
Exhibit 1: Australian Government 10-year Bond yield. Australia's benchmark long term bond.

Australian Government 10-year Bond yield (click here for full size image)
Check out that long upward pointing shadow on Wednesday – yep, the day our stock market crapped out! It pulled back from the brink, but during the session when it was at its peak is when the damage to stocks was done. That pullback, and the subsequent two days softening, is why stocks have been able to rally.
As I pointed out on Wednesday, the hardest hit sectors were the interest rate sensitives – long duration, bond proxies, and consumer discretionary. If we look at yesterday and today's best sectors – surprise, surprise, those same sectors.
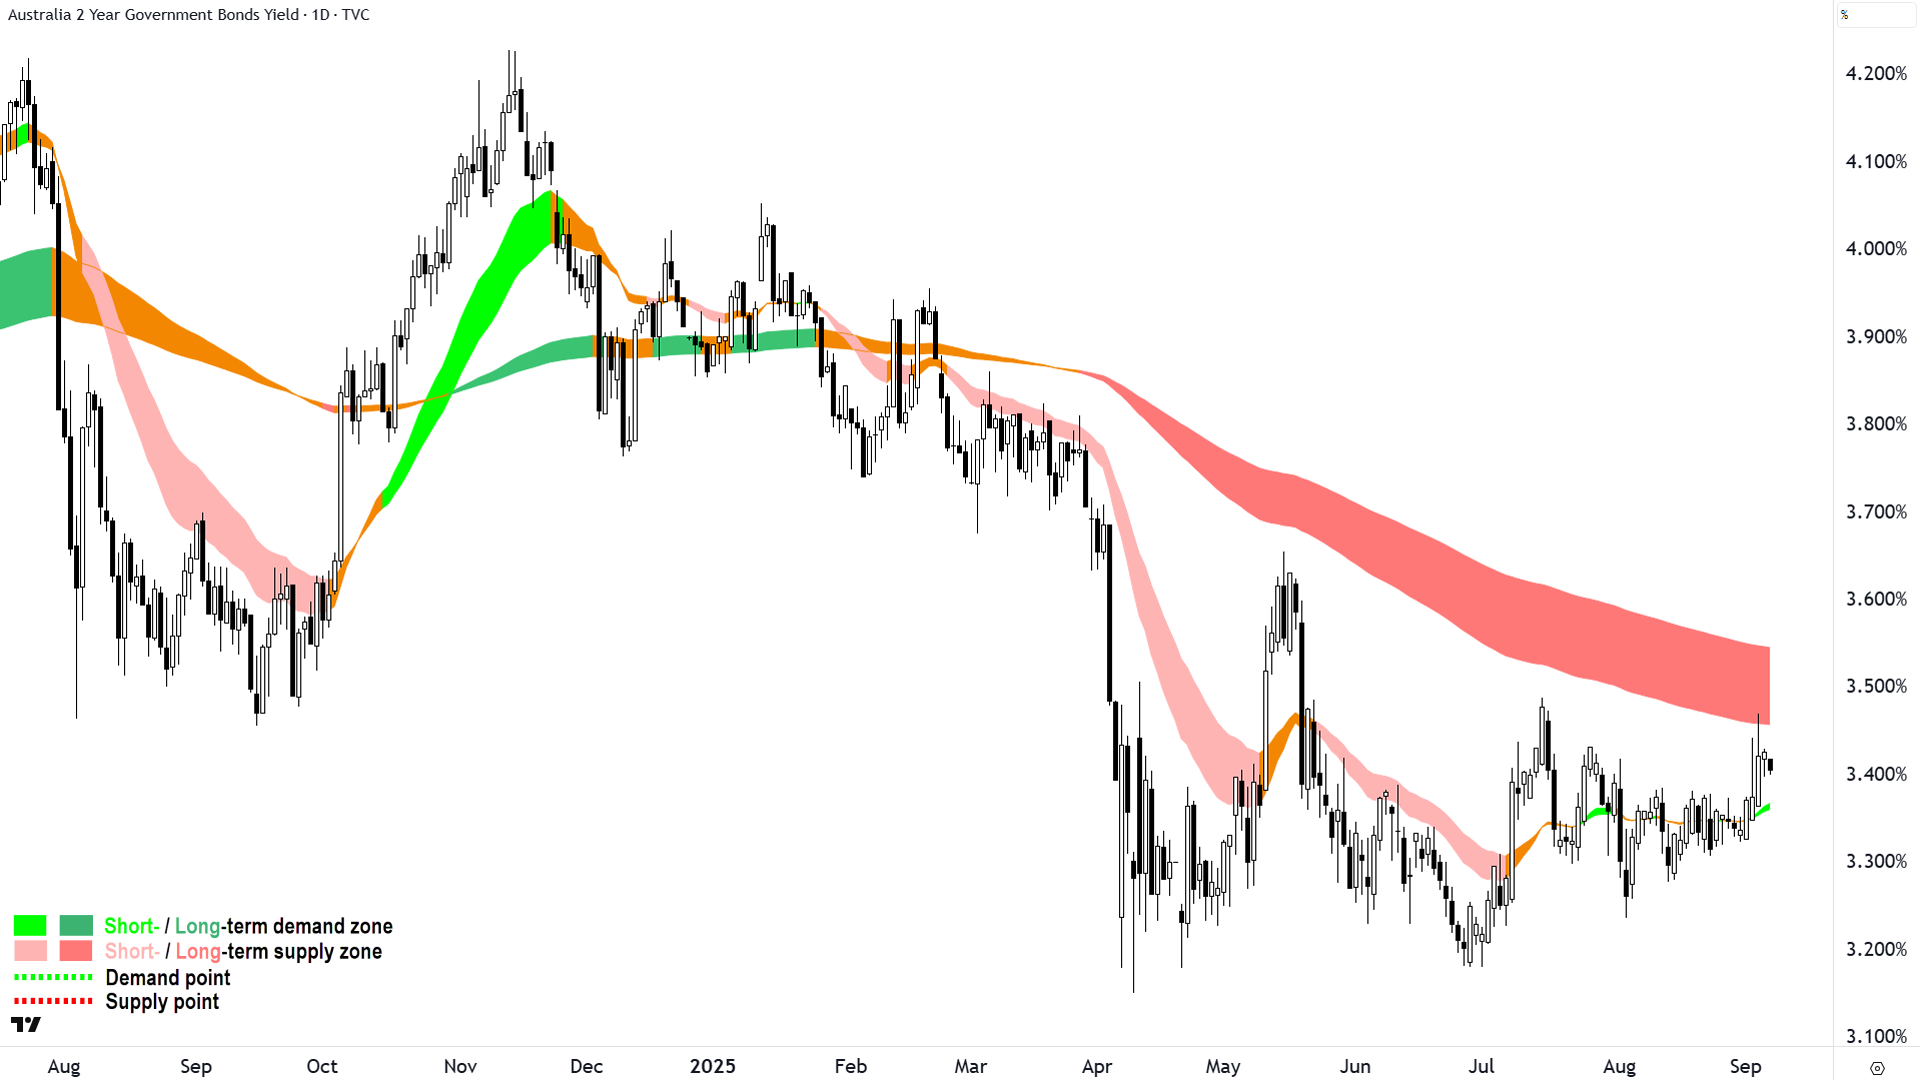
Exhibit 2: Australian Government 2-year Bond yield. Australia's benchmark short term bond.

Australian Government 2-year Bond yield (click here for full size image)
This is the bond that's most aligned with RBA policy. Note how this one has spiked and not really pulled back. That's because traders are factoring out at least some of the remaining RBA interest rate cuts.
What was the catalyst? The better than expected GDP data on Wednesday.
Wednesday, that's no coincidence. I suspect this bond market move has hurt us, certainly it explains why our stock market gains over the last couple of days haven't matched those in the US.
Our stock market and our bond market don't operate in a vacuum. We are also heavily influenced by overseas bond markets, particularly in the US – and that's the final piece of the puzzle I have for you today...
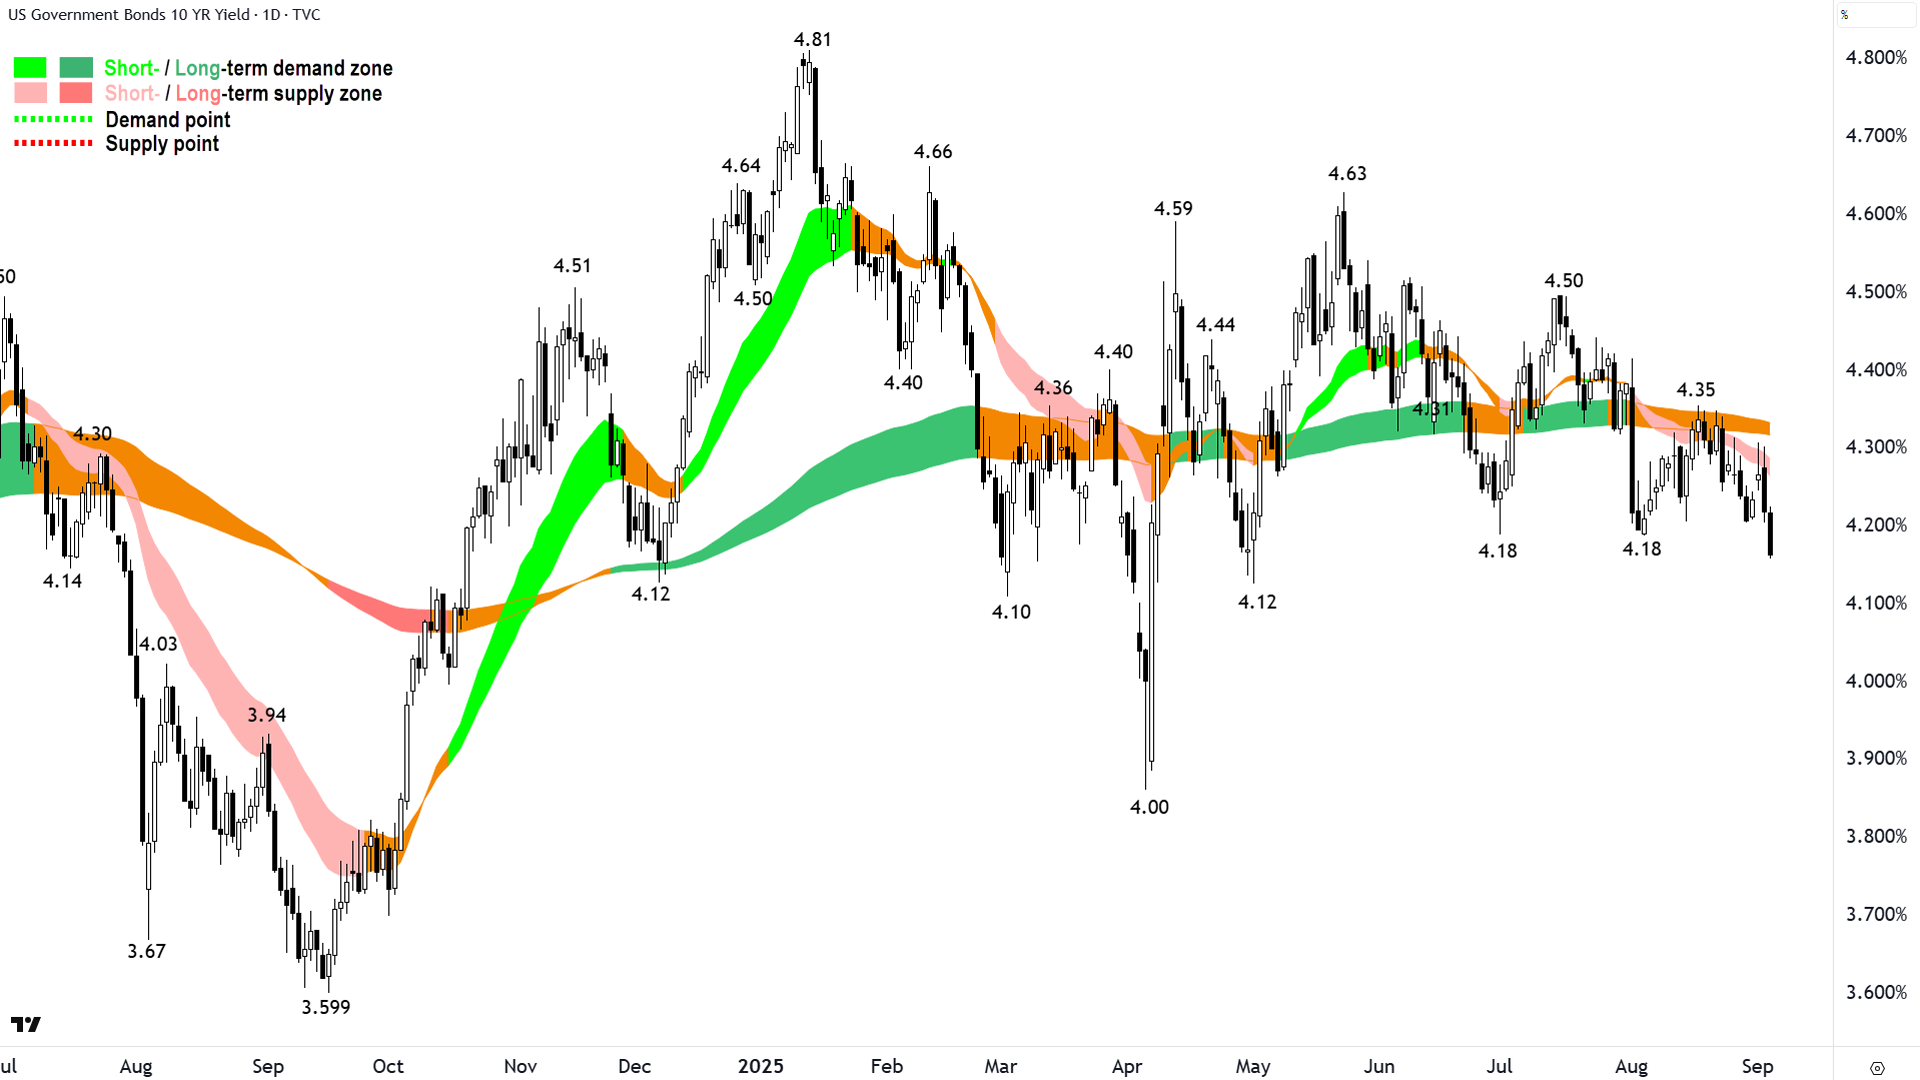
Exhibit 3: US Treasury 10-year Bond yield. America's benchmark long term bond.
%20chart_4%20Sep.png)
US Treasury 10-year Bond yield (click here for full size image)
That's a very different picture to the first two! It shows a substantially large two-day drop in benchmark US rates – and this corresponds to the substantially superior performance of US stocks over our stocks in the last two sessions.
I'd say the yield on US 10's is heading even lower... What do you think? 🤔
Now, on the face of it, based on our discussion earlier on why lower bond yields are typically good for stocks – you'd ordinarily say the above chart is particularly bullish for US stocks. There is one caveat: The relationship of bond yields down-stocks up is true assuming those bond yields aren't falling because markets are forecasting that the US economy is headed for the toilet.
Because if it is, then the Fed will be cutting rates... and that's why bond yields are falling... regardless, a US economy in the toilet is NOT good for stocks 🚽.
Is the US economy headed for the toilet? Personally, I don't think this is the case, but it's far from an open and shut case:
Overall, the data is leaning toward a slight weakening, with several cautionary signals:
Consumer sentiment is down, driven by inflation worries, tariffs, and fears about future job prospects.
Job growth is slowing, and hiring intentions look subdued.
Businesses feel squeezed, with some activity responses skewed by policy rather than strong demand.
That said, there are resilient pockets:
Actual consumer spending remains solid, especially among higher-income consumers.
Unemployment claims remain moderate, suggesting no immediate crisis.
Services activity is growing, albeit for partly technical reasons ahead of tariffs.
Bottom line: The U.S. economy shows signs of cooling – but it's not faltering. No toilet for now 🚫🧻!
BUT! And here's the big, big but... Key upcoming outputs – like TONIGHT's August official jobs report – will be critical to see whether this softness deepens or stabilises. Due at 22:30pm Sydney time. Bring your popcorn and your brown underpants!!! 🍿
(Can I say that every other market wrap out there tells you what happened... e.g., XYZ was up X% blah... but this Market Wrap tells you why it happened! 💪💪💪)
Today's best blue chip gainers
Company | Last Price | Change $ | Change % | 1mo % | 1yr % |
|---|---|---|---|---|---|
Perseus Mining (PRU) | $4.25 | +$0.15 | +3.7% | +19.7% | +68.0% |
Washington H Soul Pattinson & Company (SOL) | $43.96 | +$1.54 | +3.6% | +4.3% | +28.4% |
Light & Wonder (LNW) | $135.75 | +$4.62 | +3.5% | +1.5% | -17.0% |
Pilbara Minerals (PLS) | $2.39 | +$0.08 | +3.5% | +35.0% | -13.1% |
Life360 (360) | $45.69 | +$1.38 | +3.1% | +15.4% | +140.2% |
Nextdc (NXT) | $16.52 | +$0.45 | +2.8% | +12.5% | -0.2% |
Charter Hall Group (CHC) | $23.30 | +$0.6 | +2.6% | +10.1% | +58.7% |
Goodman Group (GMG) | $33.48 | +$0.69 | +2.1% | -5.3% | +0.5% |
Reece (REH) | $10.42 | +$0.2 | +2.0% | -25.0% | -62.0% |
Resmed Inc (RMD) | $42.26 | +$0.79 | +1.9% | -1.8% | +16.7% |
Fisher & Paykel Healthcare Corporation (FPH) | $33.89 | +$0.61 | +1.8% | -0.2% | -0.6% |
Wesfarmers (WES) | $92.56 | +$1.65 | +1.8% | +3.4% | +29.7% |
JB HI-FI (JBH) | $116.00 | +$2.03 | +1.8% | +0.5% | +43.6% |
Reliance Worldwide Corporation (RWC) | $4.09 | +$0.07 | +1.7% | -6.6% | -24.5% |
Mirvac Group (MGR) | $2.34 | +$0.04 | +1.7% | +2.6% | +10.9% |
IGO (IGO) | $4.85 | +$0.08 | +1.7% | +2.5% | -6.0% |
ALS (ALQ) | $18.81 | +$0.31 | +1.7% | +2.6% | +20.4% |
Vicinity Centres (VCX) | $2.56 | +$0.04 | +1.6% | +2.4% | +12.8% |
Cleanaway Waste Management (CWY) | $2.76 | +$0.04 | +1.5% | -2.8% | -3.5% |
James Hardie Industries (JHX) | $29.93 | +$0.4 | +1.4% | -30.0% | -46.8% |
Today's worst blue chip losers
Company | Last Price | Change $ | Change % | 1mo % | 1yr % |
|---|---|---|---|---|---|
Lynas Rare Earths (LYC) | $14.35 | -$0.45 | -3.0% | +20.6% | +107.4% |
Block (XYZ) | $115.51 | -$1.74 | -1.5% | -0.8% | +17.9% |
Wisetech Global (WTC) | $93.56 | -$1.29 | -1.4% | -19.8% | -21.3% |
Ramsay Health Care (RHC) | $33.66 | -$0.45 | -1.3% | -11.2% | -17.3% |
BHP Group (BHP) | $41.61 | -$0.37 | -0.9% | +4.4% | +5.0% |
CSL (CSL) | $209.25 | -$1.6 | -0.8% | -21.2% | -31.6% |
South32 (S32) | $2.64 | -$0.02 | -0.8% | -11.1% | -14.8% |
Treasury Wine Estates (TWE) | $7.79 | -$0.05 | -0.6% | +2.1% | -30.4% |
Santos (STO) | $7.80 | -$0.05 | -0.6% | -0.8% | +7.4% |
Aurizon (AZJ) | $3.18 | -$0.02 | -0.6% | +0.6% | -6.5% |
IDP Education (IEL) | $5.52 | -$0.03 | -0.5% | +26.0% | -65.8% |
Coles Group (COL) | $23.96 | -$0.13 | -0.5% | +14.0% | +29.5% |
Endeavour Group (EDV) | $3.72 | -$0.02 | -0.5% | -8.4% | -27.1% |
Orora (ORA) | $2.06 | -$0.01 | -0.5% | -2.4% | -17.6% |
Bendigo and Adelaide Bank (BEN) | $12.56 | -$0.05 | -0.4% | +0.9% | +4.5% |
Woodside Energy Group (WDS) | $25.68 | -$0.09 | -0.3% | -4.9% | -6.7% |
Whitehaven Coal (WHC) | $6.42 | -$0.02 | -0.3% | -4.9% | -1.7% |
Sonic Healthcare (SHL) | $22.94 | -$0.07 | -0.3% | -17.6% | -18.0% |
Woolworths Group (WOW) | $27.59 | -$0.08 | -0.3% | -13.3% | -20.8% |
Bank of Queensland (BOQ) | $6.90 | -$0.02 | -0.3% | -11.5% | +7.5% |
ChartWatch
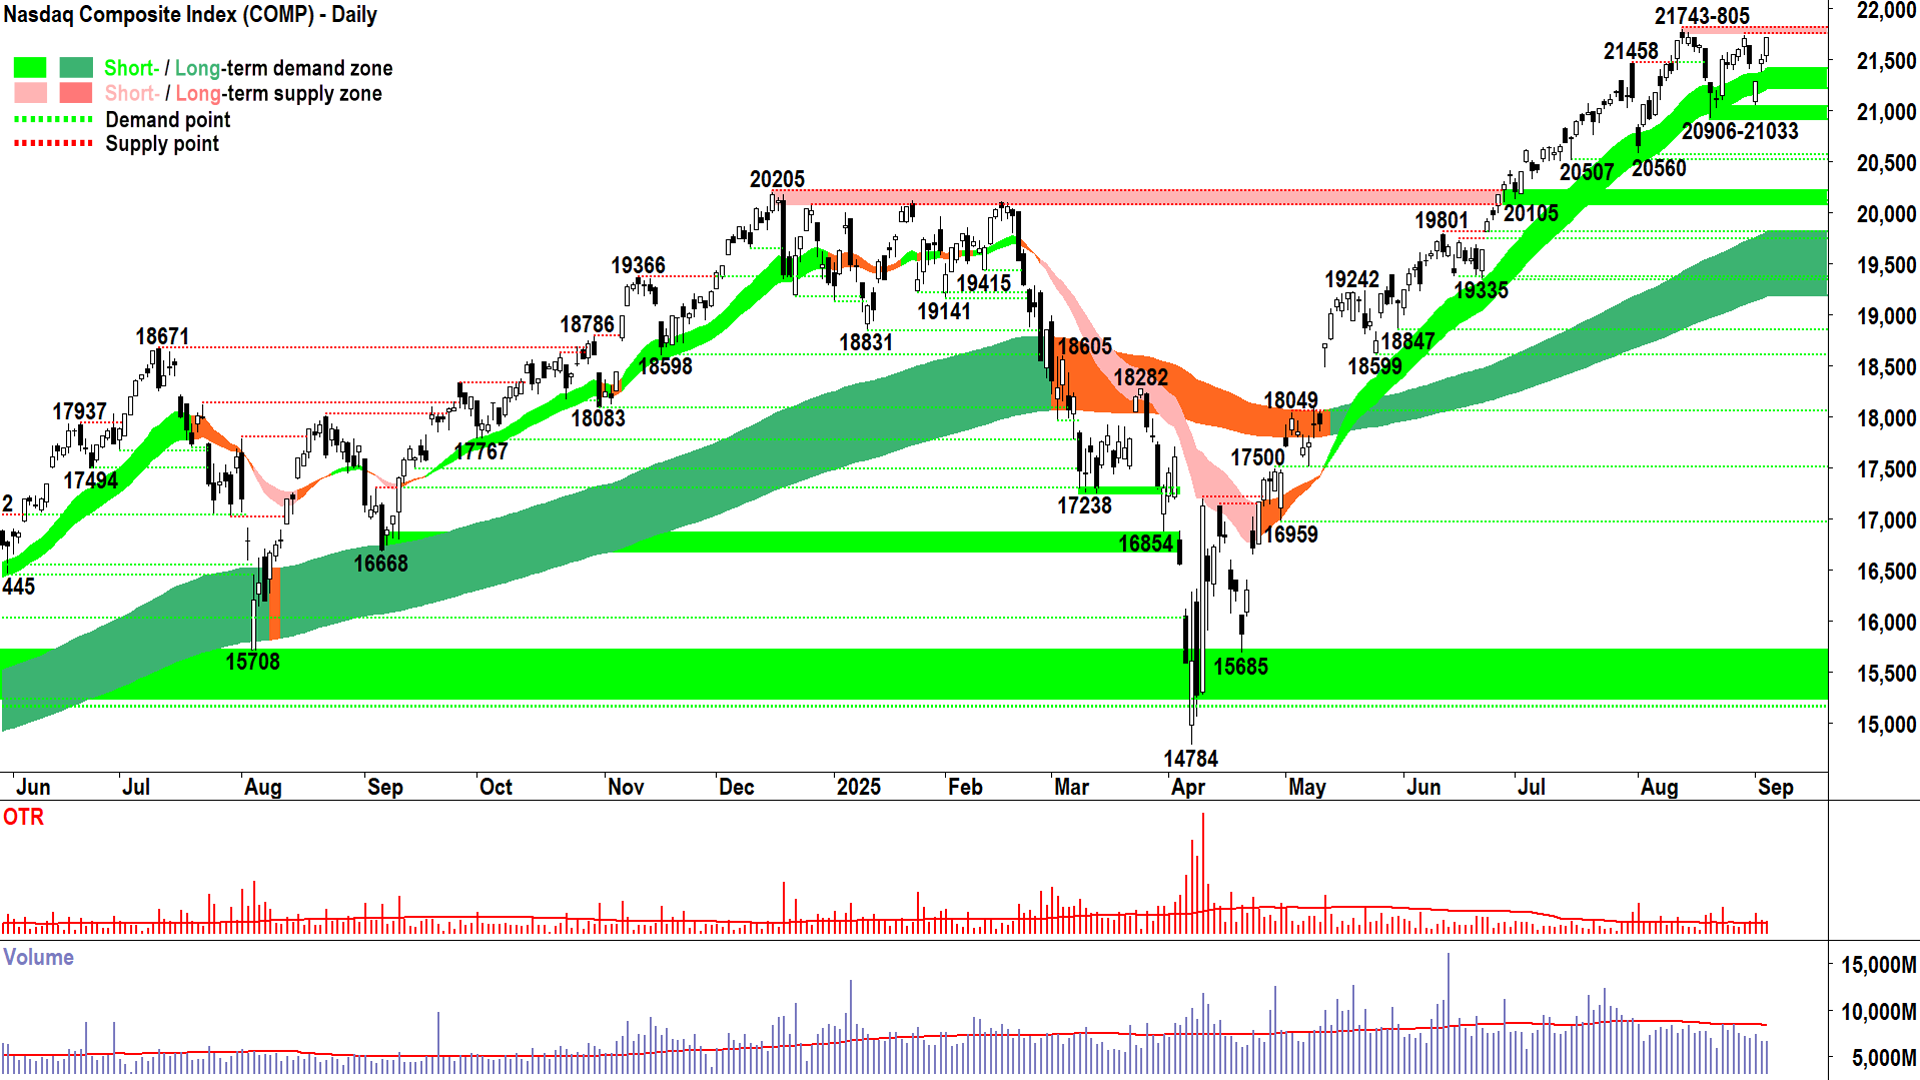
Nasdaq Composite Index

Nasdaq Composite Index chart (click here for full size image)
I wanna say that after Tuesday’s Comp candle inked, pretty much every financial news media outlet ran a headline calling the end of the bull market, warning signs were flashing and some sort of calamity was about to befall us. To back these headlines, they quoted market experts and commentators who pointed out that US stocks were inevitably doomed due to all manner of headwinds… not the least… gross overvaluations … lack of cash on the sidelines… pending economic and earnings downturns… etc. etc. etc.
It's not hard to find those types… Particularly at parties… They’re the ones nobody wants to talk to 🥱!
Yet on the other hand, in this very section of the Evening Wrap, I looked at the Tuesday’s white candle – smack bang in the short term uptrend ribbon – and concluded in about 10 seconds just 3 letters: FRP.
Full Risk Position. No change to prevailing exposure levels.
Aren’t I clever? 🧠
Not really. That call was a fluke. Indeed, any call that I will ever make that turns out to be correct is an absolute fluke.
Because I (just like everyone of my contemporaries), cannot tell the future 🔮.
So, I won’t take any credit for my correct call – because I had nothing to do with the next two candles that subsequently appeared – both of which are credible demand-side showings.
What I did do was simple, and it’s what you can trust I will always do here: Follow the trend.
I.e., based upon the best evidence of which party – the demand-side or the supply-side – is in control of the Comp’s price.
And that’s where I’m going to leave tonight’s analysis. Because I think even Blind Freddy can answer that question looking at the above chart!
(But consider how many will continue to decry this bull market!!! 🤦 Sucks to be them… particularly at parties! 😁)
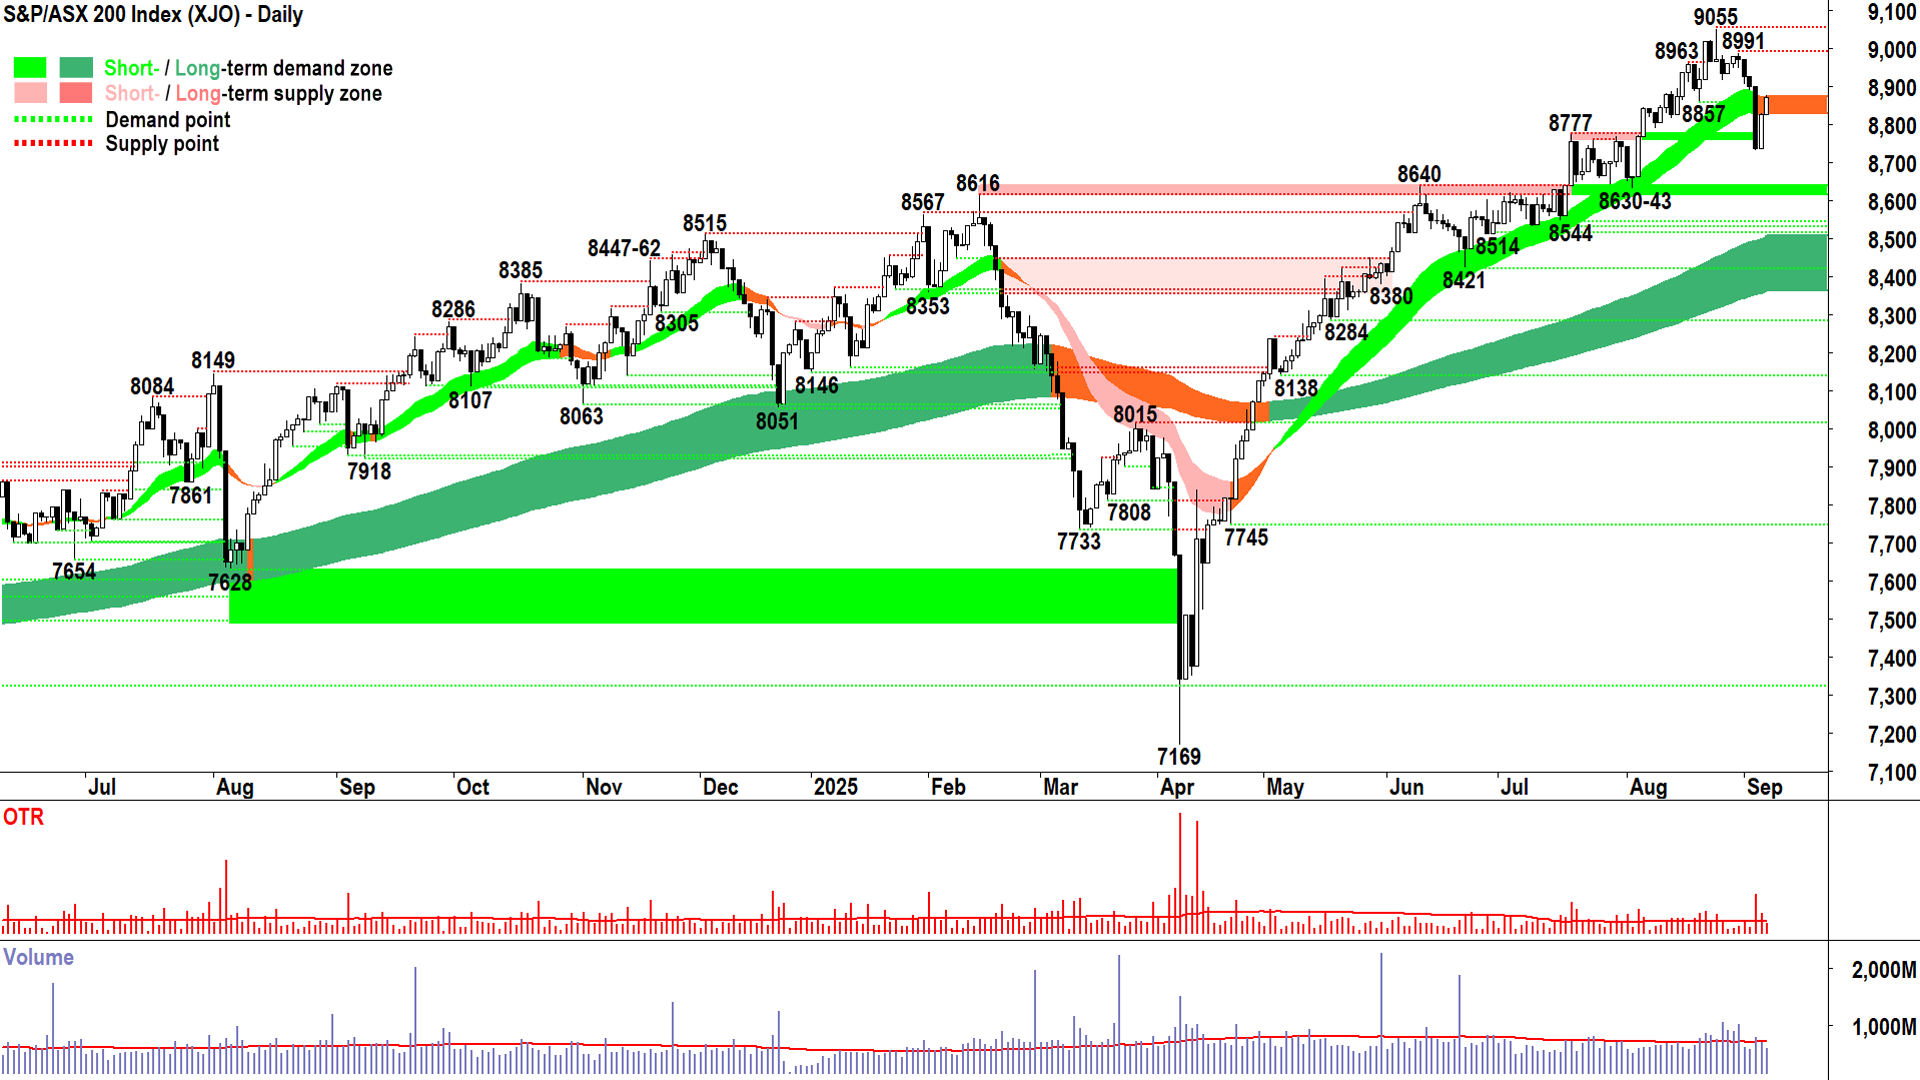
S&P/ASX 200 (XJO)
%20chart_5%20Sep.png)
S&P/ASX 200 chart (click here for full size image)
But you could argue that I did fall for the dummy move here.
There have been two days of gains since I lowered my personal portfolio risk limit from FRP to 2/3RP.
I’m not so sure, though 🤔.
Firstly, the Comp and the XJO are not guaranteed to move lock-step in the same direction all the time. Yes, there’s going to be similarities… mainly as we follow them and never the other way around! But we do waiver between Golden Le Creuset and Old Tin Pot.
At the moment it’s Old Tin Pot.
Secondly, the candles are the candles. If the candles flag a transition from short term demand-side control to supply-side control – well, then that’s what they’ve done = ignore them at your own peril! ⚠️
I am extremely pleased the XJO has logged a couple days gains. One doesn’t get from FRP to 2/3RP instantly – and even if one did, one is still massively invested/exposed to risk.
Note though, two day’s gains don’t necessarily equate to a resumption of demand-side control. Just look at Thursday’s and today’s candles. Compare them with Wednesday's wipe out.
If things were back to bull market normal on the XJO, I put to you that we really should have done substantially better in these last two sessions. The two white ones should together be at least as big as the big black one.
But they’re not.
Let me also put to you, that looking at the above chart, the most obvious conclusion for the XJO is equilibrium – i.e., neither party is in control of the price at this stage. They’re battling it out.
So, for me, the concept of paring at least some risk makes sense. Hey, there’s no law that says one can’t get back in.
So, I proceed without change here: 2/3RP.
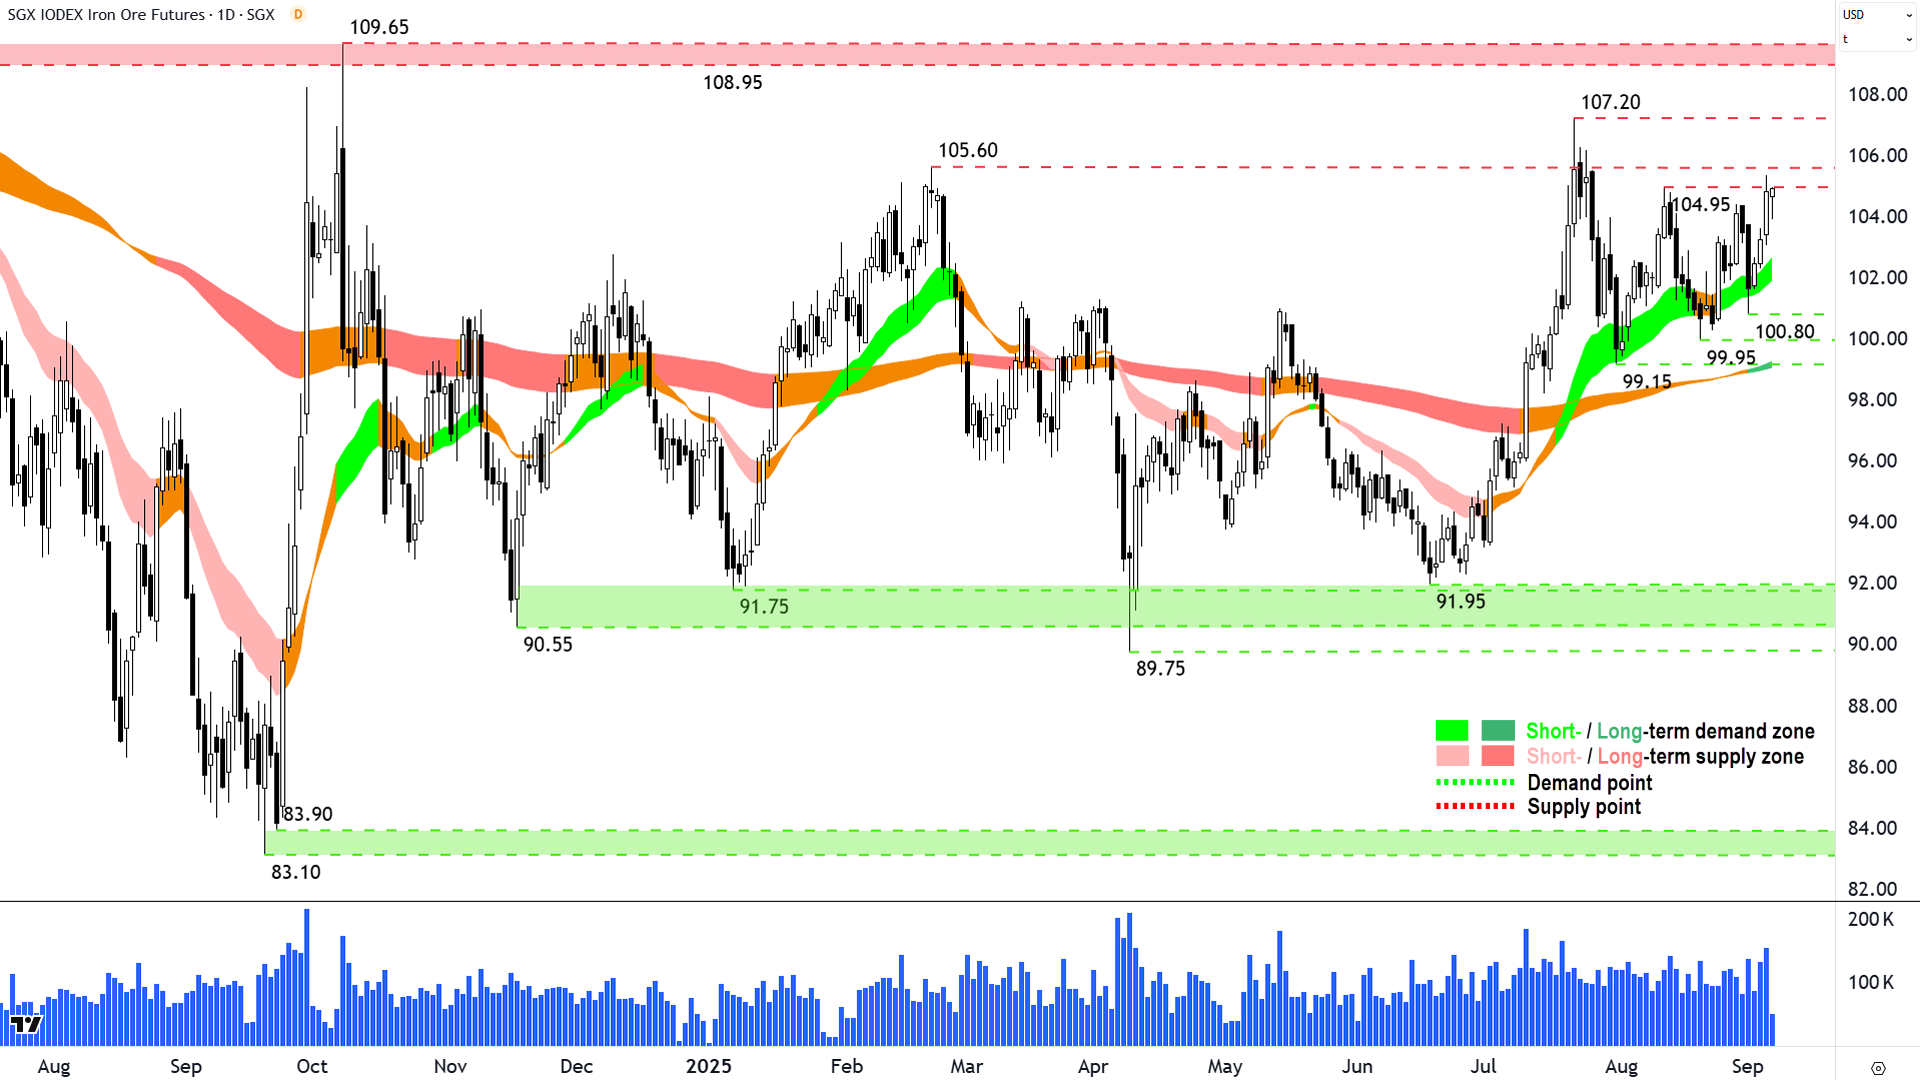
Iron Ore 62% (Front month, back-adjusted) SGX
%20SGX%20chart_5%20Sep.png)
A better than warm prospect! (click here for full size image)
The last time we covered iron ore was in ChartWatch in the Evening Wrap on 29-Aug.
In that update, we noted the “developing” short term uptrend and pondered whether it had the gumption to deal with overhead excess supply likely at 104.95-107.20.
The answer is not yet, but at least there’s another higher trough at 100.80 to suggest the short term uptrend is continuing to “develop” in a healthy way. Indeed, that short term uptrend ribbon continues to do its job of acting as a zone of dynamic demand.
Yesterday’s candle tickled the 104.95 point of supply, and whilst a close above it (to prove its consumption) remains elusive – the strength of the candle suggests that’s likely not far away. That last candle is live, discount it – but it’s downward pointing shadow is a step in the right direction.
Consumption of the supply at 105.60 is the next requirement, it will improve the demand-side’s credentials substantially if it occurs. Let’s leave the inevitable barrier that 107.20 no doubt will present for the time being…
One other thing we didn’t have as per our last update is a green long term trend ribbon – or should I now officially proclaim – a long term uptrend ribbon.
So, with short and long term trends now clearly aligned – and with at least half decent price action and candles… I still think iron ore is looking better than a warm prospect for continued upside.
Economy
Today
There weren't any major economic data releases in our time zone today
Later this week
Friday
22:30 USA Non Farm Payrolls August
Employment Change: +74,000 forecast vs +73,000 in July
Average Hourly Earnings: +0.3% m/m forecast vs +0.3% m/m in July
Unemployment Rate: 4.3% forecast vs 4.2% in July
Latest News
Interesting Movers
Trading higher
+25.4% Peak Rare Earths (PEK) - Scheme consideration increased and declared best and final.
+21.2% Gateway Mining (GML) - No news since 03-Sep High Grade Gold Samples and Soil Anomalism at Great Western, rise is consistent with prevailing short and long term uptrends, a regular in ChartWatch ASX Scans Uptrends list 🔎📈
+18.5% Vertex Minerals (VTX) - Extension of Offer Closing Date Under Options Prospectus, rise is consistent with prevailing short and long term uptrends, a regular in ChartWatch ASX Scans Uptrends list 🔎📈
+17.9% 4DMEDICAL (4DX) - Continued positive response to 03-Sep 4DMedical gains U.S. CMS reimbursement for CTVQ, rise is consistent with prevailing short and long term uptrends, a regular in ChartWatch ASX Scans Uptrends list 🔎📈
+17.0% Felix Gold (FXG) - No news, rise is consistent with prevailing short and long term uptrends, a regular in ChartWatch ASX Scans Uptrends list 🔎📈
+16.0% Ioneer (INR) - No news since 04-Sep Investment Presentation September 2025.
+14.3% New Murchison Gold (NMG) - No news since 03-Sep High Grade Gold Hits Returned from Regional Exploration, rise is consistent with prevailing short and long term uptrends, a recent regular in ChartWatch ASX Scans Uptrends list 🔎📈
+13.2% Vection Technologies (VR1) - No news, rise is consistent with prevailing short and long term uptrends, a regular in ChartWatch ASX Scans Uptrends list 🔎📈
+12.1% Wildcat Resources (WC8) - No news, general strength across the broader Lithium sector today.
+10.3% HMC Capital (HMC) - No news, bounced in the wake of the recent sharp selloff.
+9.6% Ora Banda Mining (OBM) - No news since 04-Sep Exploration Update - Waihi, general strength across the broader Gold sector today, rise is consistent with prevailing short and long term uptrends, a regular in ChartWatch ASX Scans Uptrends list 🔎📈
+9.5% Medallion Metals (MM8) - No news, rise is consistent with prevailing short and long term uptrends, a regular in ChartWatch ASX Scans Uptrends list 🔎📈
+9.4% Aeris Resources (AIS) - No news, rise is consistent with prevailing short and long term uptrends, a recent regular in ChartWatch ASX Scans Uptrends list 🔎📈
+9.3% MLG OZ (MLG) - No news, rise is consistent with prevailing short and long term uptrends, a recent regular in ChartWatch ASX Scans Uptrends list 🔎📈
+9.2% Viva Leisure (VVA) - No news, rise is consistent with prevailing short and long term uptrends, a recent regular in ChartWatch ASX Scans Uptrends list 🔎📈
+9.2% Catalyst Metals (CYL) - No news, rise is consistent with prevailing short and long term uptrends, a recent regular in ChartWatch ASX Scans Uptrends list 🔎📈
Trading lower
-8.3% Tamboran Resources Corporation (TBN) - No news 🤔.
-7.4% Chalice Mining (CHN) - No news 🤔.
-6.7% Native Mineral Resources (NMR) - No news 🤔.
-6.3% Vulcan Steel (VSL) - No news 🤔.
-6.1% Galan Lithium (GLN) - No news 🤔.
-6.0% Brazilian Rare Earths (BRE) - No news 🤔.
Broker Moves
Life360 Inc (360)
Initiated at buy at Citi; Price Target: $47.00
3P Learning (3PL)
Upgraded to speculative buy from unknown at Taylor Collison; Price Target: $0.80
Astral Resources NL (AAR)
Retained at buy at Shaw and Partners; Price Target: $0.45 from $0.38
Baby Bunting Group (BBN)
Retained at buy at Ord Minnett; Price Target: $3.00
BHP Group (BHP)
Retained at neutral at UBS; Price Target: $42.00
Beacon Lighting Group (BLX)
Retained at buy at Ord Minnett; Price Target: $3.85
Bannerman Energy (BMN)
Retained at speculative buy at Canaccord Genuity; Price Target: $3.86
Brightstar Resources (BTR)
Retained at buy at Shaw and Partners; Price Target: $1.21 from $1.14
Coles Group (COL)
Retained at buy at Citi; Price Target: $25.40
Downer EDI (DOW)
Upgraded to outperform from neutral at Macquarie; Price Target: $7.65
Genesis Minerals (GMD)
Upgraded to buy from hold at Shaw and Partners; Price Target: $5.40 from $4.40
Harvey Norman Holdings (HVN)
Retained at buy at Citi; Price Target: $7.70
Insurance Australia Group (IAG)
Retained at equal-weight at Morgan Stanley; Price Target: $8.45
JB Hi-Fi (JBH)
Retained at buy at Citi; Price Target: $120.00
Lunnon Metals (LM8)
Retained at buy at Shaw and Partners; Price Target: $0.75 from $0.60
Lotus Resources (LOT)
Retained at speculative buy at Ord Minnett; Price Target: $0.35 from $0.36
Magnetic Resources NL (MAU)
Retained at buy at Shaw and Partners; Price Target: $3.98 from $3.33
Meteoric Resources NL (MEI)
Retained at speculative buy at Ord Minnett; Price Target: $0.20
Nexted Group (NXD)
Retained at speculative buy at Ord Minnett; Price Target: $0.40 from $0.30
Orica (ORI)
Retained at buy at Citi; Price Target: $20.65
Retained at outperform at RBC Capital Markets; Price Target: $23.00
Paragon Care (PGC)
Retained at buy at Ord Minnett; Price Target: $0.50 from $0.56
Perseus Mining (PRU)
Retained at buy at UBS; Price Target: $4.75
Ramelius Resources (RMS)
Retained at buy at Shaw and Partners; Price Target: $3.64 from $3.19
Regis Resources (RRL)
Retained at accumulate at Morgans; Price Target: $5.80 from $5.00
Santana Minerals (SMI)
Retained at buy at Shaw and Partners; Price Target: $1.63 from $1.36
Sunstone Metals (STM)
Retained at buy at Shaw and Partners; Price Target: $0.04 from $0.03
Super Retail Group (SUL)
Retained at buy at Citi; Price Target: $20.50
Tuas (TUA)
Retained at buy at Citi; Price Target: $7.10
Xero (XRO)
Upgraded to buy from accumulate at Ord Minnett; Price Target: $200.00
Scans
Top Gainers
Code | Company | Last | % Chg |
|---|---|---|---|
| KRR | King River Resources Ltd | $0.011 | +46.67% |
| LAT | Latitude 66 Ltd | $0.065 | +38.30% |
| ANR | Anatara Lifesciences Ltd | $0.011 | +37.50% |
| AMS | Atomos Ltd | $0.012 | +33.33% |
| SP3 | Spectur Ltd | $0.032 | +33.33% |
Top Fallers
Code | Company | Last | % Chg |
|---|---|---|---|
| T88 | Taiton Resources Ltd | $0.07 | -20.46% |
| BEL | Bentley Capital Ltd | $0.013 | -18.75% |
| MGT | Magnetite Mines Ltd | $0.065 | -18.75% |
| SNS | Sensen Networks Ltd | $0.069 | -15.85% |
| KCCDA | Kincora Copper Ltd | $0.85 | -15.00% |
52 Week Highs
Code | Company | Last | % Chg |
|---|---|---|---|
| SP3 | Spectur Ltd | $0.032 | +33.33% |
| PEK | Peak Rare EARTHS Ltd | $0.42 | +25.37% |
| GML | Gateway Mining Ltd | $0.063 | +21.15% |
| GLA | Gladiator Resources Ltd | $0.029 | +20.83% |
| 4DX | 4DMEDICAL Ltd | $1.545 | +17.94% |
52 Week Lows
Code | Company | Last | % Chg |
|---|---|---|---|
| MGT | Magnetite Mines Ltd | $0.065 | -18.75% |
| GAS | State GAS Ltd | $0.017 | -10.53% |
| GTN | GTN Ltd | $0.27 | -10.00% |
| TPC | TPC Consolidated Ltd | $7.30 | -7.36% |
| VHL | Vitasora Health Ltd | $0.022 | -4.35% |
Near Highs
Code | Company | Last | % Chg |
|---|---|---|---|
| SMLL | Betashares Australian Small Companies Select ETF | $4.28 | +1.42% |
| ECF | Elanor Commercial Property Fund | $0.715 | +0.70% |
| OZBD | Betashares Australian Composite Bond ETF | $45.13 | +0.11% |
| DFND | Vaneck Global Defence ETF | $35.53 | -1.36% |
| E25 | Element 25 Ltd | $0.34 | -1.45% |
Relative Strength Index (RSI) Oversold
Code | Company | Last | % Chg |
|---|---|---|---|
| PEN | Peninsula Energy Ltd | $0.295 | -1.67% |
| PGC | Paragon Care Ltd | $0.32 | -3.03% |
| NWL | Netwealth Group Ltd | $31.49 | +3.14% |
| REH | Reece Ltd | $10.42 | +1.96% |
| EBO | Ebos Group Ltd | $27.65 | -1.43% |
