News | Market Wraps
Evening Wrap: ASX 200 steadies like nothing ever happened, WES, RIO and CBA to the rescue as gold stocks slip
The S&P/ASX 200 closed 87.7 points higher, up 1.0%.

Mentioned
The S&P/ASX 200 closed 87.7 points higher, up 1.0%.
Today's market breadth said it all... It was nearly the exact mirror image of yesterday as advancers beat decliners by 190 to 83. Today was, in many ways a mirror of yesterday's big plunge as those that suffered the most, generally rebounded the most. It also means those that were most resilient yesterday – like gold stocks – weren't so lucky...
To make sense of all the above, I have detailed technical analysis on the Nasdaq Composite, the S&P/ASX 200, and Gold in today's ChartWatch.
Be sure to click/scroll through for the usual reporting of the major sector and stock-specific moves, the broker responses to them, as well as all the key economic data in tonight's Evening Wrap.
Let's dive in!
Today in Review
Thu 04 Sep 25, 5:03pm (AEST)
Name | Value | % Chg |
|---|---|---|
Major Indices | ||
| ASX 200 | 8,826.5 | +1.00% |
| All Ords | 9,091.4 | +0.90% |
| Small Ords | 3,589.0 | +0.33% |
| All Tech | 4,147.8 | +0.85% |
| Emerging Companies | 2,641.2 | -0.55% |
Currency | ||
| AUD/USD | 0.6525 | -0.29% |
US Futures | ||
| S&P 500 | 6,465.5 | +0.13% |
| Dow Jones | 45,307.0 | -0.00% |
| Nasdaq | 23,478.0 | +0.12% |
Name | Value | % Chg |
|---|---|---|
Sector | ||
| Financials | 9,579.0 | +1.71% |
| Consumer Discretionary | 4,496.6 | +1.39% |
| Information Technology | 2,847.8 | +1.28% |
| Health Care | 38,882.7 | +1.11% |
| Real Estate | 4,069.5 | +1.07% |
| Consumer Staples | 12,250.2 | +1.03% |
| Industrials | 8,614.6 | +0.87% |
| Utilities | 9,857.6 | +0.58% |
| Energy | 9,161.3 | +0.13% |
| Materials | 17,804.2 | -0.02% |
| Communication Services | 1,876.4 | -0.12% |
Markets
%20intraday%20chart_4%20Sep.png)
ASX 200 Session Chart
The S&P/ASX 200 (XJO) finished 87.7 points higher at 8,826.5, 1.0% from its session low and just 0.06% from its high. In the broader-based S&P/ASX 300 (XKO) the market breadth was nearly the exact mirror image of yesterday as advancers beat decliners by 190 to 83.
I could do a detailed wrap of today’s big thematic moves… but really, we just backed out everything we did yesterday. As a reminder (at the risk of some PTSD!), yesterday was all about selling anything risk on, particularly anything long duration or bond market proxy.
So, Information Technology (XIJ) (+1.3%) (long duration) got belted… today up. Financials (XFJ) (+1.7%) (bond proxy) got belted… today up. Real Estate (XPJ) (+1.1%) (bond proxy) got belted… today up. And so it goes…
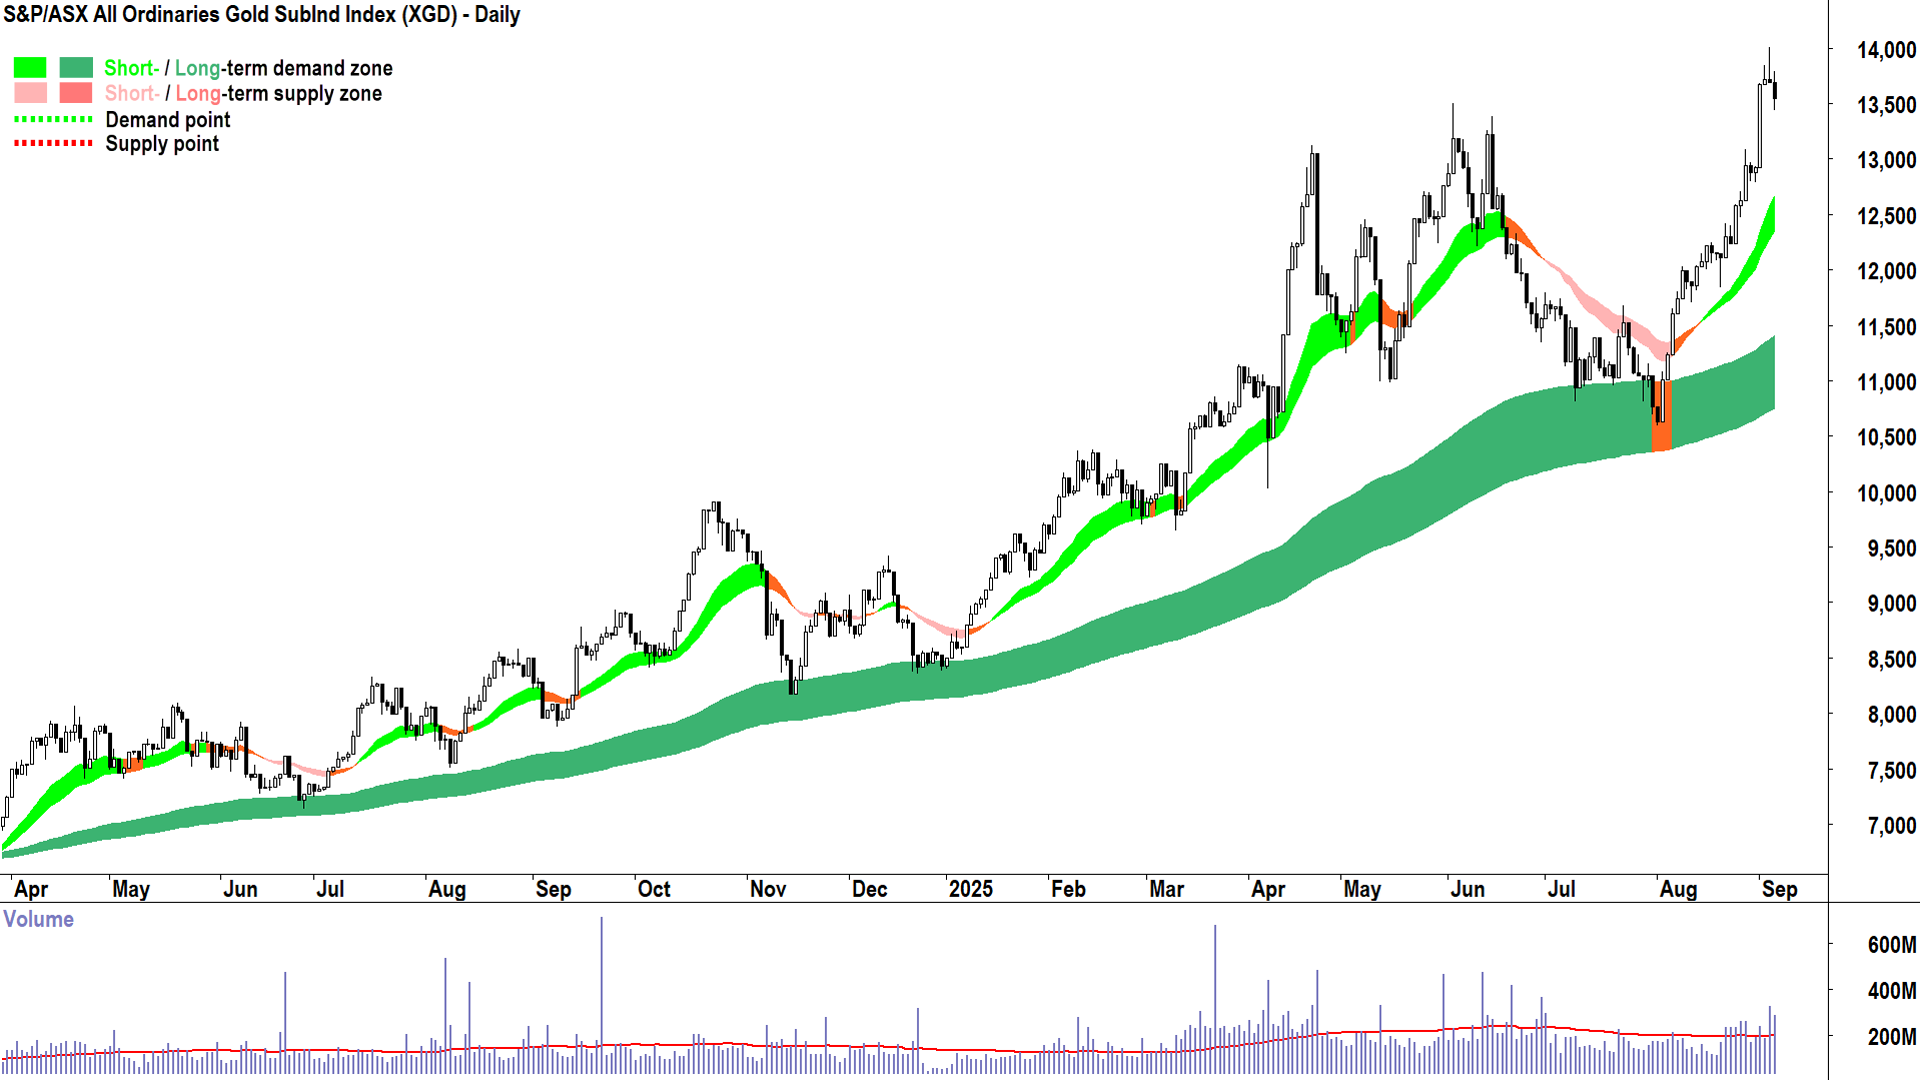
Stuff that didn’t get belted yesterday, like Gold (XGD) (-1.1%) (defensive)… today down. But I think importantly for gold, only modestly compared to its recent strong gains (it was down like all of the other sectors yesterday, but only by 0.2%, it was up 5.8% on Monday).

S&P/ASX All Ordinaries Gold Sub-Index chart (click here for full size image)
Apart from the ups and downs... which you can get from the tables below... I suspect what you really want to know is whether today's recovery is sufficient to set us back on a path to new highs? And what about gold? Is that going to be just a flash in the pan, or is there more to run there? 🤔
I'm glad you asked! Keep scrolling down to ChartWatch 📈👇!
Today's best blue chip gainers
Company | Last Price | Change $ | Change % | 1mo % | 1yr % |
|---|---|---|---|---|---|
Xero (XRO) | $157.00 | +$7.25 | +4.8% | -12.0% | +9.9% |
Lynas Rare Earths (LYC) | $14.80 | +$0.49 | +3.4% | +25.0% | +109.6% |
Wesfarmers (WES) | $90.91 | +$2.24 | +2.5% | +2.3% | +25.5% |
AMP (AMP) | $1.670 | +$0.04 | +2.5% | 0% | +28.5% |
Rio Tinto (RIO) | $116.15 | +$2.58 | +2.3% | +2.8% | +5.6% |
Bendigo and Adelaide Bank (BEN) | $12.61 | +$0.28 | +2.3% | +1.1% | +6.2% |
Commonwealth Bank of Australia (CBA) | $168.00 | +$3.45 | +2.1% | -6.2% | +18.5% |
CSL (CSL) | $210.85 | +$4.23 | +2.0% | -21.8% | -31.0% |
Macquarie Group (MQG) | $221.20 | +$4.38 | +2.0% | +2.3% | +1.9% |
Hub24 (HUB) | $102.80 | +$2.03 | +2.0% | -6.5% | +87.8% |
National Australia Bank (NAB) | $42.81 | +$0.84 | +2.0% | +9.8% | +10.8% |
Westpac Banking Corp. (WBC) | $37.90 | +$0.74 | +2.0% | +11.8% | +19.9% |
Woolworths Group (WOW) | $27.67 | +$0.52 | +1.9% | -12.9% | -21.9% |
Ampol (ALD) | $30.35 | +$0.57 | +1.9% | +11.7% | +2.4% |
Pro Medicus (PME) | $296.35 | +$5.54 | +1.9% | -7.3% | +96.5% |
Block (XYZ) | $117.25 | +$2.15 | +1.9% | +1.0% | +20.0% |
Lendlease Group (LLC) | $5.53 | +$0.1 | +1.8% | -0.4% | -17.6% |
Fortescue (FMG) | $18.66 | +$0.33 | +1.8% | +0.4% | +2.6% |
Goodman Group (GMG) | $32.79 | +$0.53 | +1.6% | -7.6% | -1.8% |
Qantas Airways (QAN) | $11.78 | +$0.17 | +1.5% | +6.7% | +73.2% |
Today's worst blue chip losers
Company | Last Price | Change $ | Change % | 1mo % | 1yr % |
|---|---|---|---|---|---|
IDP Education (IEL) | $5.55 | -$0.18 | -3.1% | +26.4% | -65.1% |
Telix Pharmaceuticals (TLX) | $13.77 | -$0.38 | -2.7% | -25.9% | -23.5% |
Nextdc (NXT) | $16.07 | -$0.41 | -2.5% | +9.0% | -2.2% |
Orica (ORI) | $20.76 | -$0.44 | -2.1% | -2.9% | +15.3% |
Sigma Healthcare (SIG) | $3.03 | -$0.06 | -1.9% | +4.8% | +140.5% |
Pinnacle Investment Management Group (PNI) | $19.06 | -$0.37 | -1.9% | -24.4% | +9.0% |
Light & Wonder (LNW) | $131.13 | -$2.33 | -1.7% | -3.9% | -19.3% |
Amcor (AMC) | $12.58 | -$0.2 | -1.6% | -13.5% | -25.3% |
Reece (REH) | $10.22 | -$0.14 | -1.4% | -26.1% | -63.4% |
Northern Star Resources (NST) | $19.70 | -$0.26 | -1.3% | +15.0% | +30.5% |
Orora (ORA) | $2.07 | -$0.02 | -1.0% | -1.0% | -16.2% |
James Hardie Industries (JHX) | $29.53 | -$0.22 | -0.7% | -32.1% | -47.1% |
BHP Group (BHP) | $41.98 | -$0.31 | -0.7% | +5.2% | +4.1% |
Woodside Energy Group (WDS) | $25.77 | -$0.18 | -0.7% | -4.2% | -6.5% |
Atlas Arteria (ALX) | $5.20 | -$0.03 | -0.6% | -1.5% | +2.4% |
Telstra Group (TLS) | $4.82 | -$0.02 | -0.4% | -2.8% | +22.6% |
Insurance Australia Group (IAG) | $8.65 | -$0.03 | -0.3% | -1.3% | +13.7% |
Worley (WOR) | $14.58 | -$0.05 | -0.3% | +11.6% | -2.5% |
Resmed Inc (RMD) | $41.47 | -$0.13 | -0.3% | -5.6% | +15.2% |
Metcash (MTS) | $4.11 | -$0.01 | -0.2% | +3.3% | +14.2% |
ChartWatch
Nasdaq Composite Index

Nasdaq Composite Index chart (click here for full size image)
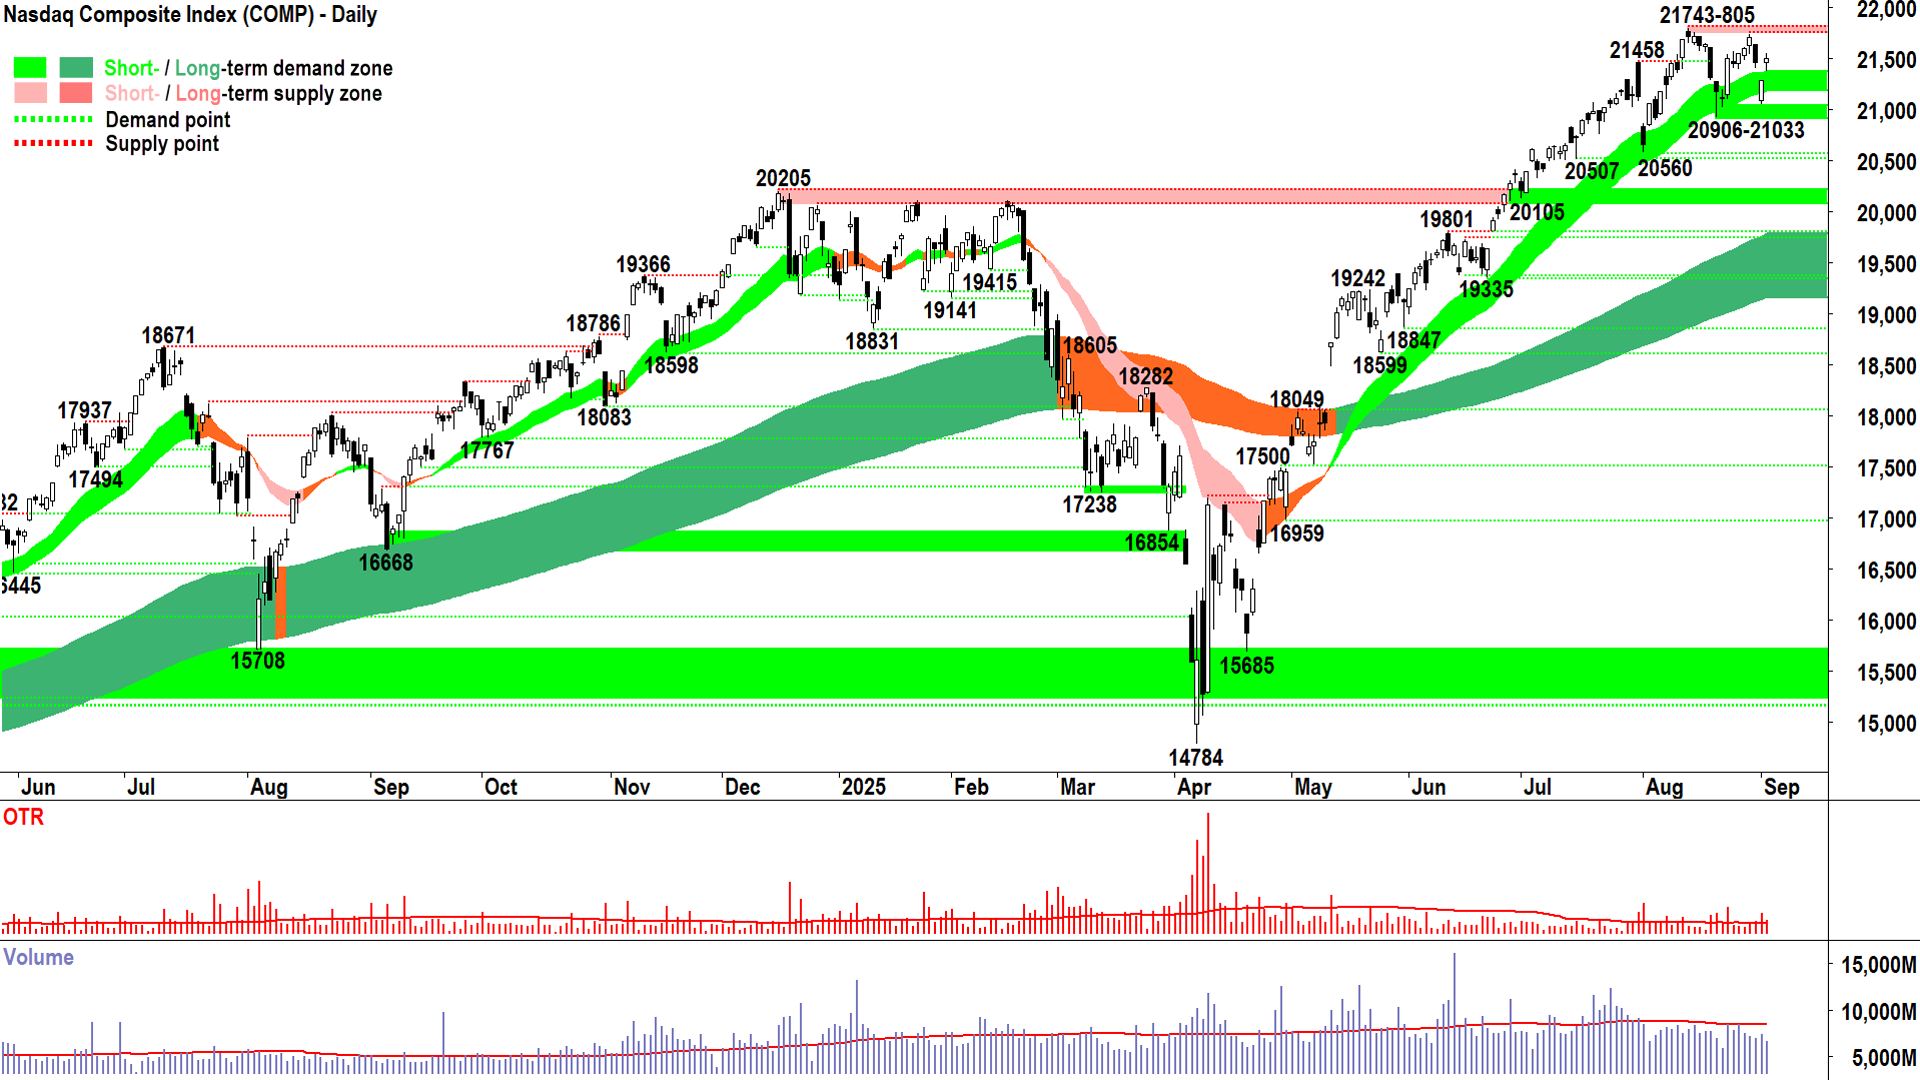
Okay, can I see a show of hands as to who’s surprised by Wednesday’s Comp candle 🖐️.
(You at the back, put your bloody hand down!)…
No, I didn’t think so.
A rally last night (and it’s not even because we were so terrible yesterday that it’s our fate to fall for the Comp’s dummy) – was let’s face it: Always on the cards.
You’ve been suffering through my rants here long enough to know that Tuesday’s candle comes with a set of probabilities for Wednesday’s candle.
We know that Tuesday’s candle – as bad as the headlines in the mainstream media were “bond market flashes warning…overvaluations coming home to roost” and all that other garbage – demonstrates that the demand-side took control after Tuesday’s open.
And didn’t let it go into Tuesday's close.
So, for us, that means at least a MOTN (“more often than not”) for a decent demand-side showing in the next candle – and I put to you – that’s we got: “A decent demand-side showing”.
We also got a new, higher trough set at 21033, that’s nice. We’re also a decent whack back up the decline from 21805. That’s nice too.
But clearly, there’s some supply about the place, and that’s why we ended up at Tuesday’s open. If anything, the chart above is starting to look a little flatter at the end there… As some supply about the place interacts with the still-plenty demand about the place.
Equilibrium.
Constructive equilibrium, though. You know – rising short and long term trend ribbons, a short term uptrend ribbon that’s doing its job of acting as a zone of dynamic demand, rising troughs, and a predominance of demand side candles (I’d still argue).
Clearly, supply at 21743-805 is capping upside. But just as clearly, demand at the short term uptrend ribbon and 20906-21033 is capping downside.
We are in a range. We just have to watch the candles at both barriers to check which side of the market is likely to break through.
In the meantime, with those short and long term uptrends intact (plus the other stuff), I remain FRP.
S&P/ASX 200 (XJO)
%20chart_4%20Sep.png)
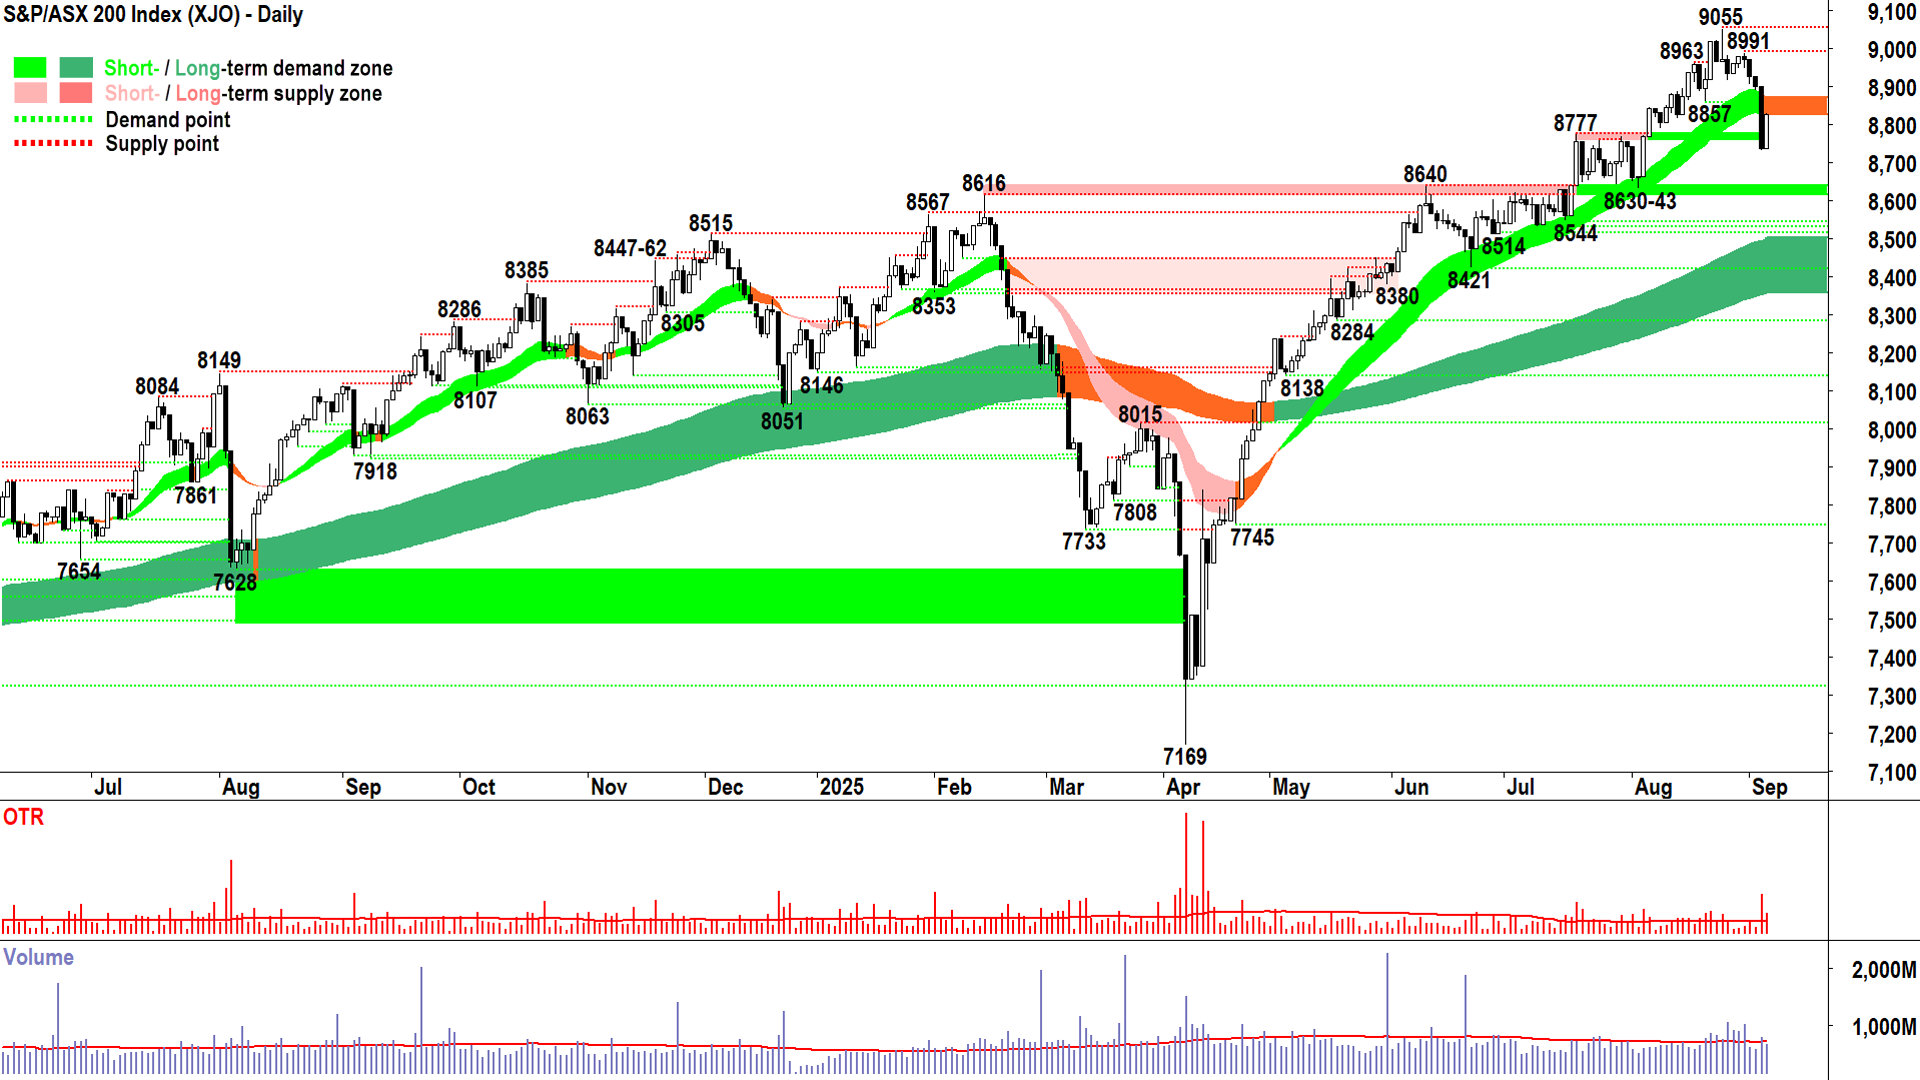
S&P/ASX 200 chart (click here for full size image)
I have a general rule of thumb when it comes to measuring a bounce after a really bad candle like yesterday’s long black showing. Apart from the usual requirement to close at or very, very near the high of the session (✅ for today), ideally, the bounce candle closes at least above the balance point of the previous supply-side candle.
“Balance point” is fancy way for saying half-way mark. Was there enough excess demand in the system today to at least push past half of the supply demonstrated yesterday? 🤔 That’s what I’m after…
If there was, and obviously the higher we push back up yesterday’s range the better – then, on balance (there’s that phrase again), we’re back on the right track.
How did we go today? 🧐
Well, yesterday’s long black candle’s balance point was 8816. Today’s close was 8826.5. So that’s another check ✅.
Am I convinced we’re out of the woods by today’s candle? Nope. I’m only about 53% convinced…or whatever 8826.5 represents back up Wednesday’s candle.
It’s a start. But we need more – much more! We must get back above that short term uptrend ribbon – which you’ll note neutralised today (i.e., transitioned to amber – for the first time in 4 months!!!). Ideally, we close strongly above the top of Wednesday’s candle’s high – that’s where the rot started – so it makes sense if we close back up there then we’ve consumed the supply that started the plunge.
That’s the stuff we want to see. The stuff we don’t want to see is this:
Failure to reclaim the short term uptrend ribbon – meaning it’s now a zone of dynamic excess supply (not the zone of dynamic excess demand it was on the way up) = BIG ⚠️
Upward pointing shadows poking into the short term trend ribbon, or into the high of Wednesday’s big black candle = Latent supply / sell the rally in the system = BIG ⚠️
Another big black candle… No more walls of supply please! = ⚠️
In conclusion, today’s rally is both welcome and constructive – but it’s far from enough to convince me the demand-side is back in control of the XJO price in the short term – and I need to be convinced to change my risk settings. So, I remain 2/3RP.
Gold Futures (Front month, back-adjusted) COMEX
%20COMEX%20chart_4%20Sep.png)
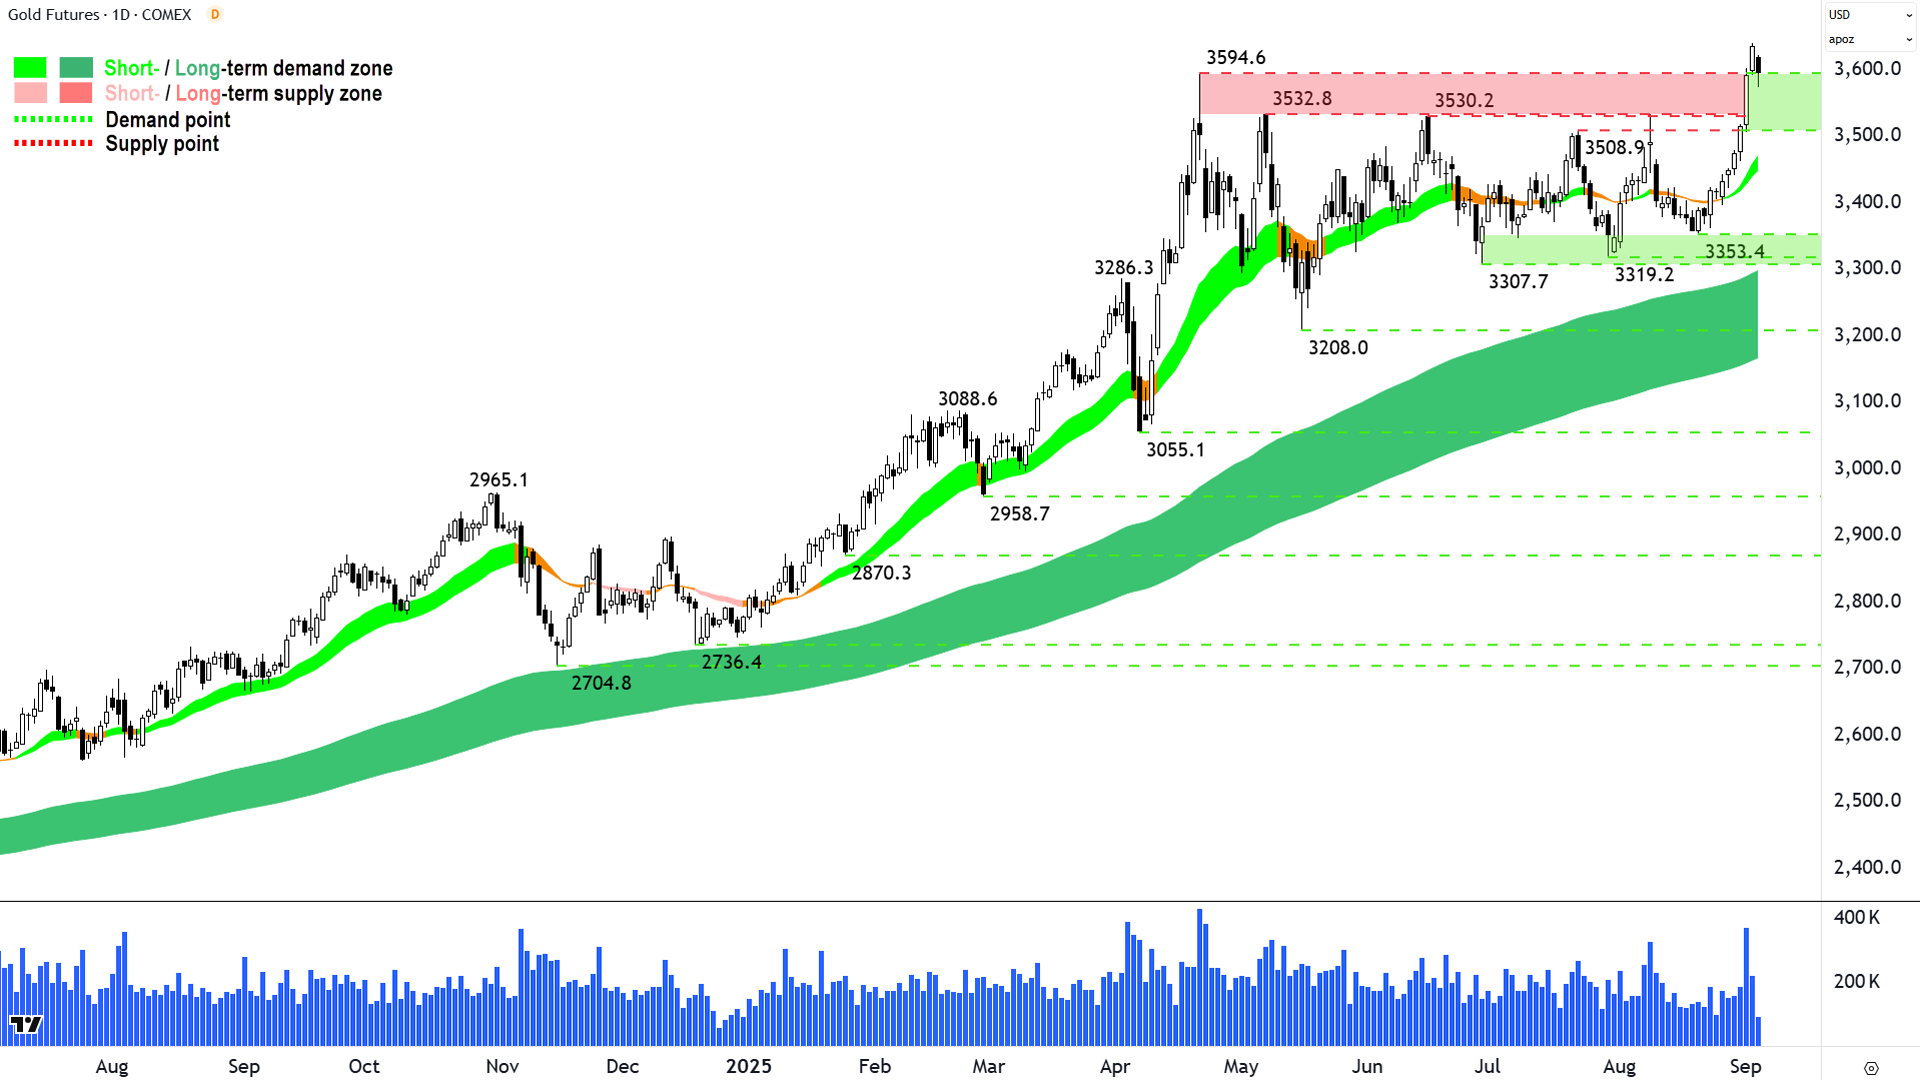
Gold, gold, gold!!! 🥇 (click here for full size image)
That last candle is live, discount it – pretend it doesn't exist.
Wednesday’s candle is the relevant one, and it has as clear demand-side tinge to it. More than a tinge, to be fair, and when considered with the run of its buddies since 3353.4 – they combine to demonstrate clear short term demand-side control of the gold price.
Add in a short term uptrend ribbon that is growing in stature – arguably the best it’s been in many months of consolidation – and we have another check on our checklist for confirming more broad-based demand-side control. Another check (a big one) comes from the fact that the 3594.6 major point of supply has been consumed.
That supply isn’t in gold anymore. It’s in fiat. US dollars in this chart. We know there’s building demand-side interest in the system and this has dislodged a decent whack of supply (rising volume = rising interest and supply removal).
So, if we have increasing demand, and lots of supply having been consumed/dislodged, then we have three critical components of a continued rally:
Excess demand (that one’s obvious)
A decent whack of supply that’s now in cash, rueing their decision to sell (darn… I knew I shouldn’t have gotten out… I knew I shouldn’t have doubted gold here… It really is going to the moon this time… Oh, I better get back in!) To get back in, they’ll have to become part of demand.
Probably a bunch of shorts that have previously benefited from fading the top of gold’s well established trading range. These shorts are losing money, and to stop that – they’ll have to become part of demand.
Put the 3 elements above together… i.e., and environment of substantial latent demand – against a supply-side that has been substantially depleted (that’s 1), and 2, looking at the above chart, why would they want to sell anyway?
And you have a clear and substantial environment of excess demand – and assuming that demand is motivated (i.e., by the prospect of the “to the moon” narrative), prices can rise quickly from here.
It’s called a breakout. And if you read the above analysis a few times, it should really lock in for you the demand-supply dynamics that create and sustain this phenomenon.
There’s nothing in this chart that indicates the demand-side isn’t again in total control of the gold price (add in here the strong long term uptrend), so I remain FRP.
Economy
Today
There weren't any major economic data releases in our time zone today
Later this week
Thursday
22:15 USA ADP Non-Farm Employment Change August (+71,000 forecast vs +104,000 in July)
Friday
00:00 USA ISM Services PMI August (50.5 forecast vs 50.1 in July)
22:30 USA Non Farm Payrolls August
Employment Change: +74,000 forecast vs +73,000 in July
Average Hourly Earnings: +0.3% m/m forecast vs +0.3% m/m in July
Unemployment Rate: 4.3% forecast vs 4.2% in July
Latest News
Interesting Movers
Trading higher
+20.4% MTM Critical Metals (MTM) - Ex-U.S. Dep. Assistant Secretary of Defense Joins Adv. Board, rise is consistent with prevailing short and long term uptrends 🔎📈
+19.8% Sunrise Energy Metals (SRL) - Trading Halt, rise is consistent with prevailing short and long term uptrends, a regular in ChartWatch ASX Scans Uptrends list 🔎📈
+17.5% Brazilian Rare Earths (BRE) - Continued positive response to 03-Sep BRE Secures Final Operating Permit - Rare Earth Pilot Plant, rise is consistent with prevailing short term uptrend and long term trend is transitioning from down to up, added to ChartWatch ASX Scans Uptrends list yesterday 🔎📈
+14.5% Asara Resources (AS1) - No news, rise is consistent with prevailing short and long term uptrends, a regular in ChartWatch ASX Scans Uptrends list 🔎📈
+14.1% Zeotech (ZEO) - No news, rise is consistent with prevailing short and long term uptrends, a recent regular in ChartWatch ASX Scans Uptrends list 🔎📈
+13.4% 4DMEDICAL (4DX) - Continued positive response to 03-Sep 4DMedical gains U.S. CMS reimbursement for CTVQ, rise is consistent with prevailing short and long term uptrends, a regular in ChartWatch ASX Scans Uptrends list 🔎📈
+13.3% GBM Resources (GBZ) - Corporate Presentation, rise is consistent with prevailing short and long term uptrends, a regular in ChartWatch ASX Scans Uptrends list 🔎📈
+13.0% HOT Chili (HCH) - No news, rise is consistent with prevailing short and long term uptrends, a regular in ChartWatch ASX Scans Uptrends list 🔎📈
+9.3% Felix Gold (FXG) - No news, rise is consistent with prevailing short and long term uptrends, a recent regular in ChartWatch ASX Scans Uptrends list 🔎📈
+9.2% Decidr Ai Industries (DAI) - No news, rise is consistent with prevailing short and long term uptrends, a regular in ChartWatch ASX Scans Uptrends list 🔎📈
+8.7% Ioneer (INR) - Investment Presentation September 2025.
+7.0% Iress (IRE) - Iress confirms CEO succession.
+6.7% Electro Optic Systems (EOS) - No news, rise is consistent with prevailing short and long term uptrends, a regular in ChartWatch ASX Scans Uptrends list 🔎📈
+6.4% Deep Yellow (DYL) - No news, rise is consistent with prevailing short and long term uptrends, a regular in ChartWatch ASX Scans Uptrends list 🔎📈
+5.8% Bisalloy Steel Group (BIS) - No news, rise is consistent with prevailing short and long term uptrends, a regular in ChartWatch ASX Scans Uptrends list 🔎📈
Trading lower
-20.0% Lotus Resources (LOT) – Equity Raising Presentation.
-13.0% Catalyst Metals (CYL) – No news, downgraded to accumulate from buy at Morgans.
-12.0% Falcon Metals (FAL) – No news 🤔.
-10.5% Meeka Metals (MEK) – No news 🤔.
-8.8% Ausgold (AUC) – No news 🤔.
-8.3% Astral Resources (AAR) – No news 🤔.
-8.0% Nanoveu (NVU) – No news 🤔.
-7.1% Gateway Mining (GML) – No news 🤔.
-6.9% Pantoro (PNR) – No news, Downgraded to hold from buy at Moelis Australia.
-6.4% Broken Hill Mines (BHM) – No news 🤔.
-6.3% Megaport (MP1) – No news 🤔.
-6.3% St Barbara (SBM) – No news 🤔.
-6.1% Bubs Australia (BUB) – No news 🤔.
-6.1% Great Boulder Resources (GBR) – No news 🤔.
-5.8% Novonix (NVX) – No news 🤔.
-5.7% Wildcat Resources (WC8) – No news 🤔.
-5.4% Sun Silver (SS1) – No news 🤔.
-4.8% Peninsula Energy (PEN) – No news, fall is consistent with prevailing short and long term downtrends, a regular in ChartWatch ASX Scans Downtrends list 🔎📉
Broker Moves
Astral Resources NL (AAR)
Retained at buy at Shaw and Partners; Price Target: $0.38
Eagers Automotive (APE)
Retained at outperform at Macquarie; Price Target: $27.33
ARB Corporation (ARB)
Retained at buy at Ord Minnett; Price Target: $42.00
Autosports Group (ASG)
Retained at outperform at Macquarie; Price Target: $3.63
BHP Group (BHP)
Retained at neutral at Citi; Price Target: $43.00
Beach Energy (BPT)
Retained at underweight at Morgan Stanley; Price Target: $1.14
Brazilian Rare Earths (BRE)
Retained at speculative buy at Canaccord Genuity; Price Target: $5.65 from $5.00
Retained at speculative buy at Ord Minnett; Price Target: $6.30
CAR Group (CAR)
Retained at neutral at Macquarie; Price Target: $39.00
COG Financial Services (COG)
Retained at buy at Bell Potter; Price Target: $2.25 from $2.05
Retained at accumulate at Morgans; Price Target: $2.14 from $1.98
Retained at accumulate at Ord Minnett; Price Target: $2.04 from $1.91
Capstone Copper Corp. (CSC)
Retained at buy at Citi; Price Target: $11.00
CurveBeam AI (CVB)
Downgraded to hold from buy at Bell Potter; Price Target: $0.15 from $0.18
Catalyst Metals (CYL)
Downgraded to accumulate from buy at Morgans; Price Target: $9.26 from $8.82
DUG Technology (DUG)
Retained at buy at Shaw and Partners; Price Target: $3.20 from $3.00
Evolution Mining (EVN)
Retained at trim at Morgans; Price Target: $8.30
Gemlife Communities Group (GLF)
Retained at overweight at Morgan Stanley; Price Target: $5.40
Graincorp (GNC)
Retained at accumulate at Morgans; Price Target: $8.92 from $8.20
Insurance Australia Group (IAG)
Retained at buy at Citi; Price Target: $10.00
Immutep (IMM)
Retained at speculative buy at Bell Potter; Price Target: $0.46 from $0.70
Retained at buy at Bell Potter; Price Target: $0.46 from $0.70
Inghams Group (ING)
Retained at neutral at UBS; Price Target: $2.80 from $3.65
ioneer (INR)
Retained at speculative buy at Canaccord Genuity; Price Target: $0.40 from $0.25
Retained at speculative buy at Ord Minnett; Price Target: $0.25 from $0.19
Karoon Energy (KAR)
Retained at equal-weight at Morgan Stanley; Price Target: $2.00
Lynas Rare Earths (LYC)
Downgraded to hold from buy at Euroz Hartleys; Price Target: $13.00 from $12.00
Meeka Metals (MEK)
Retained at speculative buy at Morgans; Price Target: $0.27 from $0.23
Minerals 260 (MI6)
Retained at speculative buy at Morgans; Price Target: $0.35 from $0.26
Newmont Corporation (NEM)
Retained at accumulate at Morgans; Price Target: $124.00
Northern Star Resources (NST)
Retained at buy at Morgans; Price Target: $24.00
Origin Energy (ORG)
Retained at underweight at Morgan Stanley; Price Target: $11.11
Pantoro Gold (PNR)
Downgraded to hold from buy at Moelis Australia; Price Target: $4.50
REA Group (REA)
Retained at neutral at Macquarie; Price Target: $255.00
Regis Resources (RRL)
Retained at accumulate at Morgans; Price Target: $5.90
Rox Resources (RXL)
Retained at speculative buy at Canaccord Genuity; Price Target: $0.70 from $0.67
SEEK (SEK)
Retained at outperform at Macquarie; Price Target: $32.50
Turaco Gold (TCG)
Retained at speculative buy at Canaccord Genuity; Price Target: $1.10
Technology One (TNE)
Upgraded to hold from sell at Bell Potter; Price Target: $35.75
Scans
Top Gainers
Code | Company | Last | % Chg |
|---|---|---|---|
| LU7 | Lithium Universe Ltd | $0.014 | +40.00% |
| SNS | Sensen Networks Ltd | $0.082 | +26.15% |
| ZMM | ZIMI Ltd | $0.015 | +25.00% |
| RCR | Rincon Resources Ltd | $0.021 | +23.53% |
| PLG | Pearl Gull Iron Ltd | $0.022 | +22.22% |
Top Fallers
Code | Company | Last | % Chg |
|---|---|---|---|
| CVB | Curvebeam Ai Ltd | $0.11 | -21.43% |
| JAL | Jameson Resources Ltd | $0.10 | -20.00% |
| LOT | Lotus Resources Ltd | $0.18 | -20.00% |
| AVD | Avada Group Ltd | $0.175 | -18.61% |
| FMR | FMR Resources Ltd | $0.40 | -18.37% |
52 Week Highs
Code | Company | Last | % Chg |
|---|---|---|---|
| SNS | Sensen Networks Ltd | $0.082 | +26.15% |
| PLG | Pearl Gull Iron Ltd | $0.022 | +22.22% |
| THR | Thor Energy Plc | $0.012 | +20.00% |
| SRL | Sunrise Energy Metals Ltd | $2.00 | +19.76% |
| BRE | Brazilian Rare EARTHS Ltd | $3.35 | +17.54% |
52 Week Lows
Code | Company | Last | % Chg |
|---|---|---|---|
| RNV | Renerve Ltd | $0.095 | -13.64% |
| CYC | Cyclopharm Ltd | $0.83 | -9.78% |
| TGH | Terragen Holdings Ltd | $0.016 | -5.88% |
| CVN | Carnarvon Energy Ltd | $0.10 | -4.76% |
| PEN | Peninsula Energy Ltd | $0.30 | -4.76% |
Near Highs
Code | Company | Last | % Chg |
|---|---|---|---|
| SMLL | Betashares Australian Small Companies Select ETF | $4.22 | +0.24% |
| ECF | Elanor Commercial Property Fund | $0.71 | -0.70% |
| OZBD | Betashares Australian Composite Bond ETF | $45.08 | +0.45% |
| DFND | Vaneck Global Defence ETF | $36.02 | +0.08% |
| E25 | Element 25 Ltd | $0.345 | +1.47% |
Relative Strength Index (RSI) Oversold
Code | Company | Last | % Chg |
|---|---|---|---|
| PEN | Peninsula Energy Ltd | $0.30 | -4.76% |
| KAR | Karoon Energy Ltd | $1.635 | -1.80% |
| NWL | Netwealth Group Ltd | $30.53 | -1.13% |
| REH | Reece Ltd | $10.22 | -1.35% |
| MAQ | Macquarie Technology Group Ltd | $58.30 | +0.52% |
