News | Market Wraps
Evening Wrap: ASX 200 carnage! Stocks tumble on rising long term yields, growing risk off sentiment. Gold only place to hide
The S&P/ASX 200 closed 161.8 points lower, down 1.82%.

Mentioned
The S&P/ASX 200 closed 161.8 points lower, down 1.82%.
It wasn't pretty today. It was the usual get me out of risky assets first, get me some hedges in "safe haven" assets... and ask questions later kind of stuff. Why, well there's a few things you need to know about... and we'll discuss those in the main wrap... so...
Be sure to click/scroll through for the usual reporting of the major sector and stock-specific moves, the broker responses to them, as well as all the key economic data in tonight's Evening Wrap.
I also have detailed technical analysis on the Nasdaq Composite and the S&P/ASX 200 in today's ChartWatch.
Let's dive in!
Today in Review
Wed 03 Sep 25, 5:07pm (AEST)
Name | Value | % Chg |
|---|---|---|
Major Indices | ||
| ASX 200 | 8,738.8 | -1.82% |
| All Ords | 9,010.1 | -1.72% |
| Small Ords | 3,577.3 | -1.15% |
| All Tech | 4,113.0 | -2.47% |
| Emerging Companies | 2,655.7 | -0.03% |
Currency | ||
| AUD/USD | 0.6513 | -0.11% |
US Futures | ||
| S&P 500 | 6,434.5 | +0.14% |
| Dow Jones | 45,228.0 | -0.27% |
| Nasdaq | 23,350.0 | +0.32% |
Name | Value | % Chg |
|---|---|---|
Sector | ||
| Consumer Discretionary | 4,434.8 | -0.37% |
| Health Care | 38,455.7 | -0.95% |
| Industrials | 8,540.4 | -1.05% |
| Materials | 17,807.9 | -1.11% |
| Energy | 9,149.2 | -1.18% |
| Consumer Staples | 12,125.0 | -1.24% |
| Communication Services | 1,878.7 | -1.47% |
| Utilities | 9,800.7 | -2.30% |
| Real Estate | 4,026.6 | -2.41% |
| Financials | 9,418.3 | -2.76% |
| Information Technology | 2,811.9 | -3.85% |
Markets
%20intraday%20chart_3%20Sep.png)
ASX 200 Session Chart
The S&P/ASX 200 (XJO) finished 161.8 points lower at 8,738.8, 1.85% from its session high and just 0.09% from its low. In the broader-based S&P/ASX 300 (XKO) advancers lagged decliners by a dismal 40 to 236.
Welcome to September everyone! Consistently the worst month of the year.
The seasonal analysis pointed to something the techincals only gave us the slightest inkling of (i.e., "that shadow" as per ChartWatch XJO analysis below). But the thing about seasonal analysis is that it tells you nothing about the causes of "insert whichever thing frightened the markets that September".
This September, it looks like a bit of US trade policy, plus just scattergun and do as you please by executive order meddling in the economy, and now social fabric – is probably going to trigger this September's dip. Since the last trading day in New York that investors on Tuesday could respond to (i.e., Friday):
Uncertainty over Fed independence and policy direction deepened. Legal challenges and court battles involving President Trump’s efforts to influence Federal Reserve leadership and tariff authority rattled investors.
Tariff policy shocks also played a role. A federal appeals court ruling throwing into doubt the legality of Trump’s "reciprocal tariffs" intensified concerns about fiscal stability, national debt, and future trade tensions.
Heightened US domestic unrest fears: President Trump’s deployment of the National Guard in in Washington and more recent threats to do so in other states, has fueled concerns about rising social tension and diminishing trust in government, further unsettling investors.
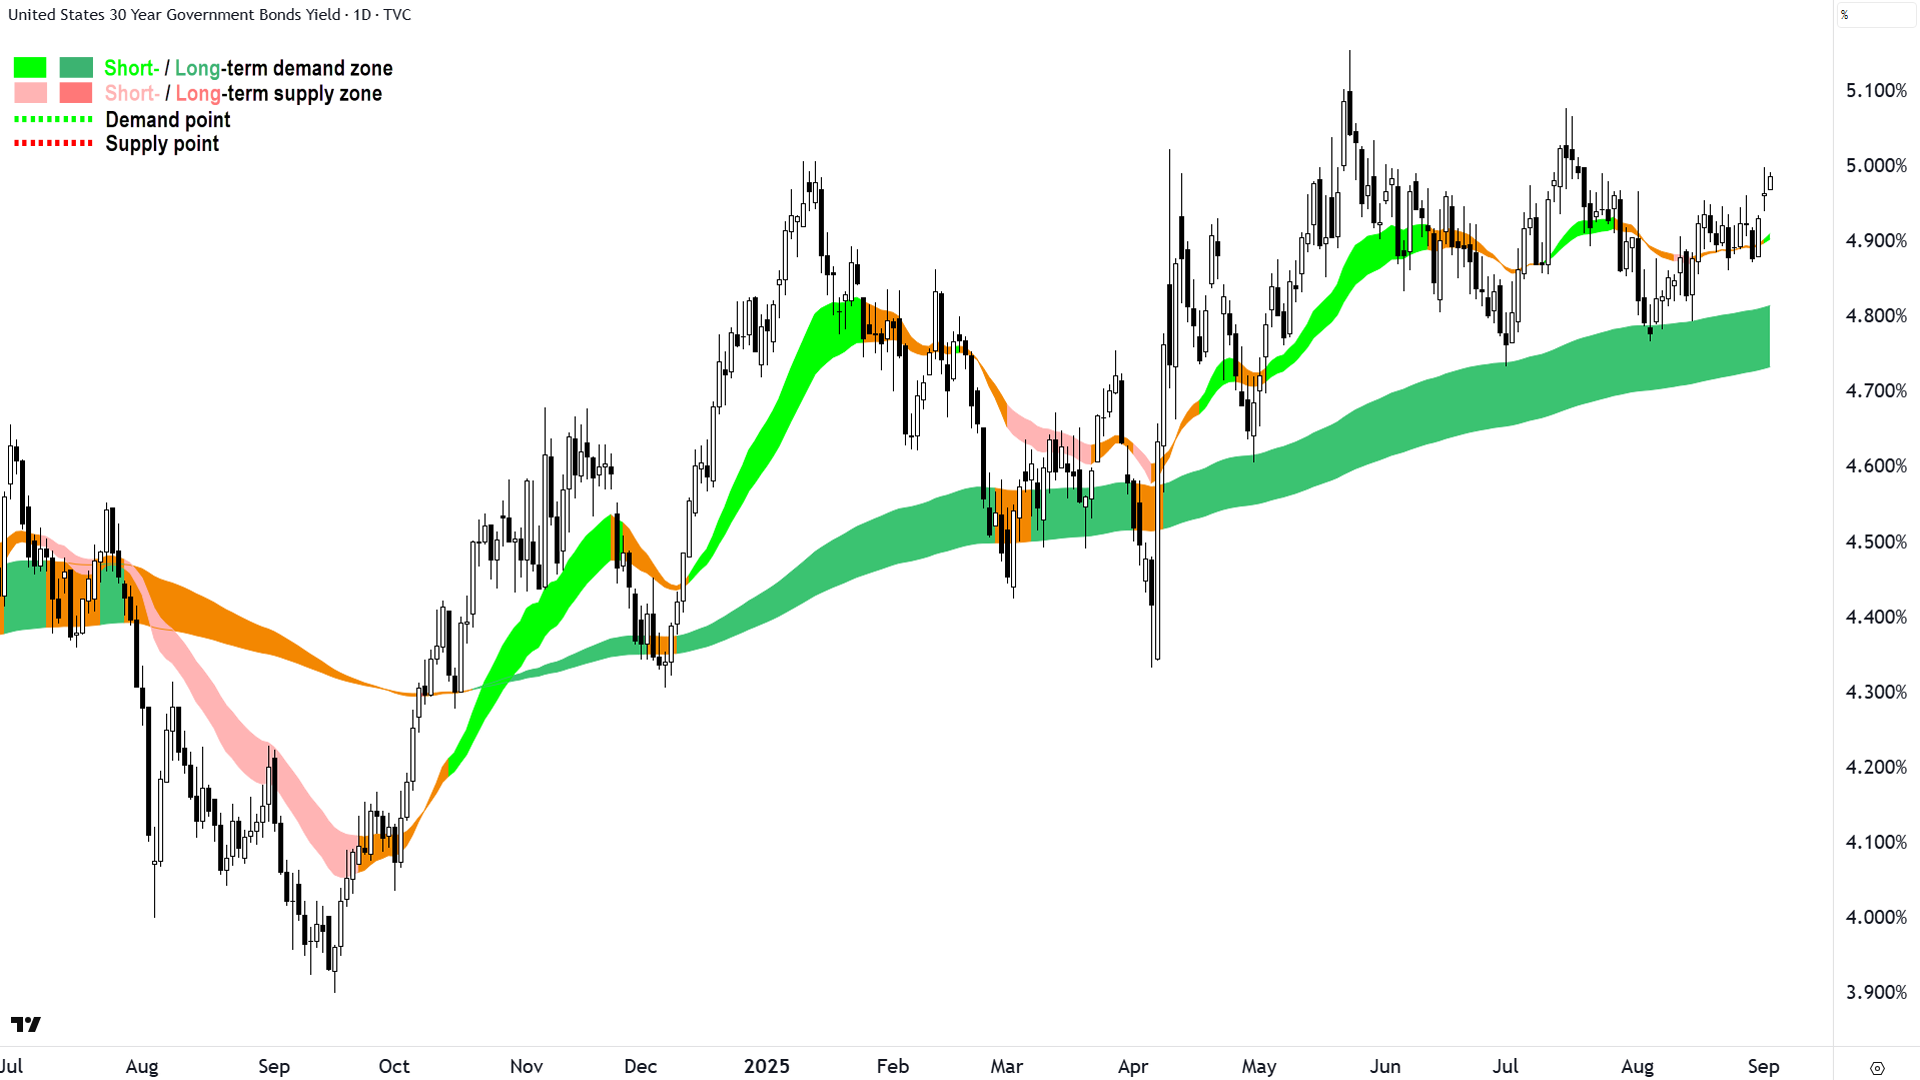
Chuck in the fact that much of the above caused long term US T-bonds to sell off, sending the yields on 10's, but more substantially 30's, higher – and it was a synchronous risk-off move today with stocks across Asia tracking earlier losses in Europe and New York.
%20chart_3%20Sep.png)
US 30-year Treasury Bond (T-Bond) chart (click here for full size image)
Gold and other precious metals rallied: The usual get me out of risky assets first, get me some hedges in "safe haven" assets... and ask questions later kind of stuff.
If you'll remember our discussions here back in the late-March-April shenanigans, we don't want to see that US30's yield climb too high as it signals a lack of confidence in Uncle Sam in general. We don't want what potentially starts as a simple pull back to lead to a more systemic issue.
Hey, we've seen markets snap back from far more than the stuff that's driven the losses of the last 24-hours, and trends are still largely bottom left-top right. Still, that is a rather nasty last candle on the ASX 200, and we'll chat about the possible consequences it creates in ChartWatch below.
For now, I note again those rising long term yields. When you see that, you can bet your bottom dollar that Technology (XIJ) (-3.8%) is going to get hit. You see, tech is what we call long duration. That means earnings are usually coming in the distant future so those earnings are more heavily impacted by discounting back to a present value (because of the time value of money!).
With those earnings so far out, these stocks also tend to be more reliant on debt funding, and many of the key benchmark lending rates are tied to those long term US bond yields (which as we noted above, are going up!). So a double whammy of bad there...
XIJ sector heavyweights Xero (XRO) (-6.2%), and Wisetech Global (WTC) (-4.6%) were hit hard today, but there were many others not so big that were dumped too. I note this might be bad news for some, but potentially good news for devoted ChartWatch ASX Scans followers who know that XRO has appeared as a Feature Downtrend (i.e., highest conviction) several times over the last few weeks.
The next worst sectors, Financials (XFJ) (-2.8%), Real Estate (XPJ) (-2.4%) and Utilities (XUJ) (-2.3%) are also likely to do it tough on days where long term yields are rising because these sectors hold stocks that are most likely to be considered bond proxies. But consider that a T-bond always pays you back... so on a risk adjusted basis, higher long term bond yields usually results in lower stock prices for bond proxies. Commonwealth Bank of Australia (CBA) was a big loser among ASX bond proxies today, down 3.5%.
At the other end of the spectrum today, was erm, stocks at the other end of the risk spectrum! So we saw Gold (XGD) (-0.2%) the least-worst of the major sector bunch. There were still some pretty decent gains within the XGD though, including several ChartWatch ASX Scans recent Feature Uptrends: Meeka Metals (MEK) (+11.8%), African Gold (A1G) (+3.4%), Ora Banda Mining (OBM) (+3.3%), Pantoro Gold (PNR) (+3.1%), Black Cat Syndicate (BC8) (+3.0%), Alkane Resources (ALK) (+2.6%), and Catalyst Metals (CYL) (+2.5%).
Today's best blue chip gainers
Company | Last Price | Change $ | Change % | 1mo % | 1yr % |
|---|---|---|---|---|---|
Worley (WOR) | $14.63 | +$0.21 | +1.5% | +12.6% | -3.9% |
Northern Star Resources (NST) | $19.96 | +$0.1 | +0.5% | +22.3% | +30.8% |
Wesfarmers (WES) | $88.67 | +$0.42 | +0.5% | +1.3% | +22.1% |
Fisher & Paykel Healthcare Corporation (FPH) | $33.08 | +$0.08 | +0.2% | -1.8% | +0.2% |
Today's worst blue chip losers
Company | Last Price | Change $ | Change % | 1mo % | 1yr % |
|---|---|---|---|---|---|
Xero (XRO) | $149.75 | -$9.9 | -6.2% | -15.2% | +4.6% |
Lendlease Group (LLC) | $5.43 | -$0.3 | -5.2% | -0.7% | -19.7% |
Block (XYZ) | $115.10 | -$5.91 | -4.9% | -2.6% | +17.0% |
Wisetech Global (WTC) | $94.80 | -$4.6 | -4.6% | -17.7% | -19.5% |
Sonic Healthcare (SHL) | $22.74 | -$1.01 | -4.3% | -17.7% | -17.8% |
Whitehaven Coal (WHC) | $6.37 | -$0.27 | -4.1% | -3.3% | -4.8% |
Technology One (TNE) | $37.30 | -$1.49 | -3.8% | -8.5% | +62.8% |
IGO (IGO) | $4.78 | -$0.19 | -3.8% | +2.4% | -13.9% |
Goodman Group (GMG) | $32.26 | -$1.24 | -3.7% | -7.6% | -2.6% |
Westpac Banking Corporation (WBC) | $37.16 | -$1.41 | -3.7% | +10.4% | +19.0% |
Origin Energy (ORG) | $12.37 | -$0.46 | -3.6% | +3.3% | +24.2% |
Pinnacle Investment Management Group (PNI) | $19.43 | -$0.71 | -3.5% | -15.6% | +13.3% |
Commonwealth Bank of Australia (CBA) | $164.55 | -$5.91 | -3.5% | -7.2% | +18.0% |
SGH (SGH) | $48.77 | -$1.72 | -3.4% | -3.4% | +18.7% |
Light & Wonder (LNW) | $133.46 | -$4.3 | -3.1% | -6.2% | -17.1% |
Vicinity Centres (VCX) | $2.49 | -$0.08 | -3.1% | +0.4% | +12.2% |
Bendigo and Adelaide Bank (BEN) | $12.33 | -$0.39 | -3.1% | -1.0% | +2.3% |
Downer EDI (DOW) | $6.89 | -$0.21 | -3.0% | -1.1% | +23.3% |
South32 (S32) | $2.63 | -$0.08 | -3.0% | -10.2% | -16.2% |
Amcor (AMC) | $12.78 | -$0.38 | -2.9% | -12.1% | -23.4% |
ChartWatch
Nasdaq Composite Index

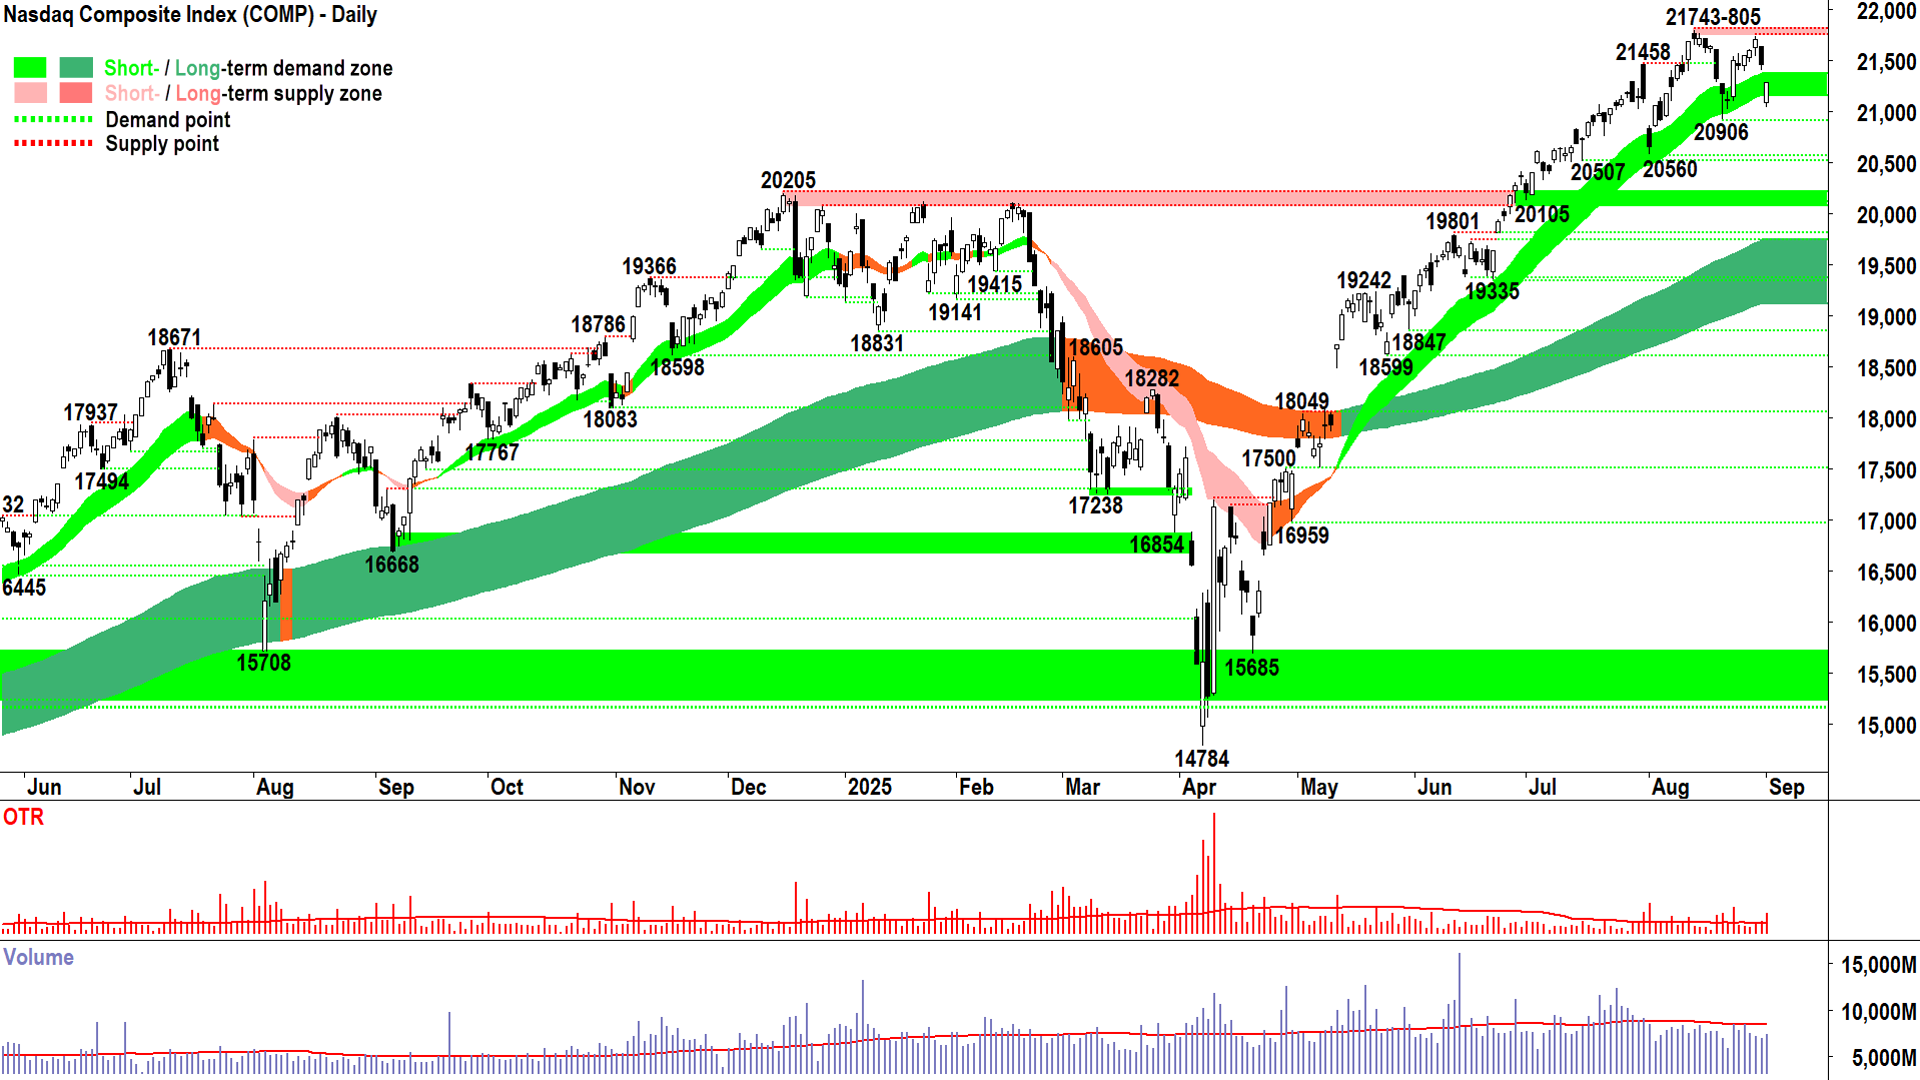
Nasdaq Composite Index chart (click here for full size image)
That’s what you call a “fighting retreat”.
The papers will say it was a terrible day for the Comp… but the candles say: Ok, agree, it wasn’t a great day – hey that gap is real… the fact the price lost so much ground on the previous session is real… the fact it doubly confirms the lower peak at 21743 is real… and the dip below the short term uptrend ribbon is real…
But that’s still a long, white candle by the close… and the short term uptrend ribbon does appear to be doing its job of acting as a zone of dynamic demand.
= It’s not a total write off by any stretch of the imagination!
There was a credible demand-side showing on Tuesday, albeit starting at a very defensive posture. Volume is still an issue – or rather lack thereof. We saw the entire demand-supply environment reprice risk at the open in a negative way (the gap down), then from there, modest but motivated demand failed to find an opposing wall of supply.
Modest but motivated demand is good – it’s still in keeping with the buy the dip mentality that bull markets critically depend upon. Not a great deal of supply after the open getting in their way (check below average volume) isn’t terrible either.
We dearly want to see a higher high and higher low in Wednesday’s trade to set Tuesday's low as a new point of demand. A strong candle, white-bodied and or with a long downward pointing shadow would be most welcome too.
If we get those, then given the broader price action and trends remain demand-side control oriented – there’s nothing to worry about – carry on bull market sort of stuff.
However, if we get the opposite... Well, that’s a whole other kettle of fish altogether 😱.
Conclusion: Alert, watching for confirmation of increasing supply-side control… scrutinising the need for new risk very tightly indeed, being vigilant in culling exposure that’s not up to standard, and potentially investigating some short cover… but ultimately, staying the course here: FRP.
S&P/ASX 200 (XJO)
%20chart_3%20Sep.png)
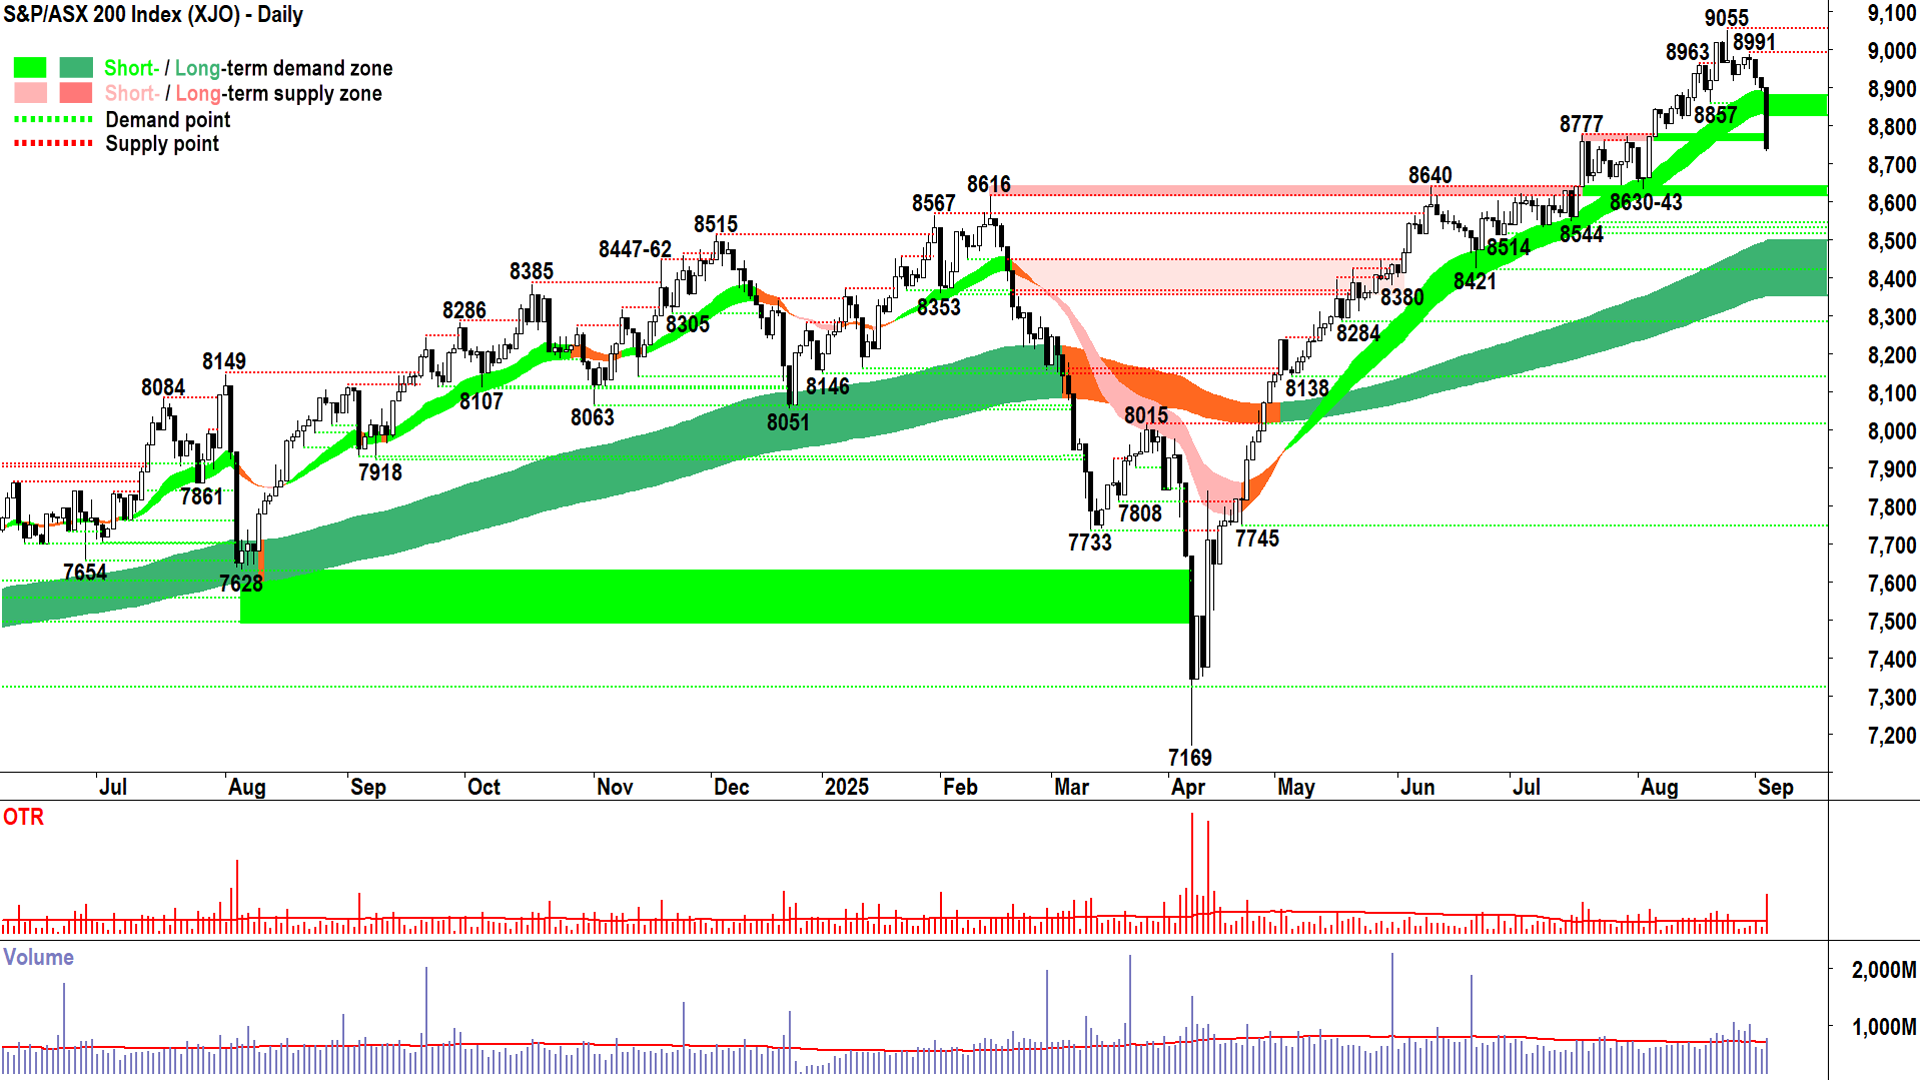
S&P/ASX 200 chart (click here for full size image)
"That shadow", i.e., the upward pointing shadow on the 25-Aug push-and-fail-at-new-all-time high – is now joined by "That candle".
Or rather, this candle. Or today's candle. You know what I mean.
The bloody great big long black thing dangling from above the short term uptrend ribbon to now below it ⚠️.
And as you know, that's a big no-no for me. Particularly when it comes on the back of already supply-side price action (falling peaks and falling troughs since 25-Aug).
So, as frustrating as this is... it's time for me to manage my overall risk settings. Hey, you can do whatever it is you want to do – that is a standing agreement here – but for me, as a pure precautionary measure, I will now move to a 2/3 risk position ("2/3RP") for my ASX exposure.
It won't happen immediately, it will take as long as it takes for me to roll off any dead wood trends that haven't been performing, and I'll likely put a pause on adding any new risk until I'm back under my limit. Fortunately, ChartWatch ASX Scans has been blessed with enough Feature Downtrends to make up for some of the dips in Feature Uptrends (e.g., XRO as mentioned earlier).
Markets go up and down. This means one must be able to go long and short.
What we want to see from here:
That's easy! A bloody great big white candle – preferably as soon as possible
Close back above short term uptrend ribbon – preferably as soon as possible
What we don't want to see from here:
More bloody great big supply candles! ⬛🕯️=🚫
A close below the next key demand zone at 8630-43
A rally back to the short term trend ribbon – which is then repelled (i.e., we DON'T want to see it transition to a zone of dynamic supply
Feeble demand-side candle(s) that barely pushe(s) back into today's candle's range, nor which falter at the short term trend ribbon, similarly, we don't want to see any nasty supply-side candles in the short term trend ribbon
A prolonged period of malaise... death by a thousand cuts without a quick bounce... we want to see the demand-side respond quickly and buy this dip! The longer it takes them to do so, the greater the likelihood... the cavalry ain't com'n! 😱
Economy
Today
AUS Gross Domestic Product (GDP) June Quarter
+0.6% q/q vs +0.5% q/q forecast and +0.3% q/q in March (revised up from +0.2% q/q)
Suggests the Australian economy is finally growing at a decent rate again, with annual growth the strongest since the September quarter of 2023.
GDP per capita (i.e. per person) rose for the first time in 8 quarters – the so-called productivity recession may be over (give your collective selves a pat on the back for pulling your finger out last quarter)!
The key driver was Household Consumption, which rose by a strong +0.9% q/q.

Australia quarterly GDP change. Source: Diana Mousina, Deputy Chief Economist, AMP
Later this week
Wednesday
18:00 AUS Speech by RBA Governor Michelle Bullock
Thursday
00:00 USA JOLTS Job Openings July (7.24 million forecast vs 7.44 million in June)
22:15 USA ADP Non-Farm Employment Change August (+71,000 forecast vs +104,000 in July)
Friday
00:00 USA ISM Services PMI August (50.5 forecast vs 50.1 in July)
22:30 USA Non Farm Payrolls August
Employment Change: +74,000 forecast vs +73,000 in July
Average Hourly Earnings: +0.3% m/m forecast vs +0.3% m/m in July
Unemployment Rate: 4.3% forecast vs 4.2% in July
Latest News
Interesting Movers
Trading higher
+50.0% 4DMEDICAL (4DX) - 4DMedical gains U.S. CMS reimbursement for CTVQ, rise is consistent with prevailing short term uptrend and long term trend is transitioning from down to up, a regular in ChartWatch ASX Scans Uptrends list 🔎📈
+16.3% Brazilian Rare Earths (BRE) - BRE Secures Final Operating Permit - Rare Earth Pilot Plant.
+16.2% 29METALS (29M) - No news 🤔.
+14.3% Gateway Mining (GML) - High Grade Gold Samples and Soil Anomalism at Great Western, general strength across the broader Precious Metals sector today, rise is consistent with prevailing short and long term uptrends, a regular in ChartWatch ASX Scans Uptrends list 🔎📈
+11.8% Meeka Metals (MEK) - No news, general strength across the broader Precious Metals sector today, rise is consistent with prevailing short and long term uptrends, a recent regular in ChartWatch ASX Scans Uptrends list 🔎📈
+11.3% Asara Resources (AS1) - No news, general strength across the broader Precious Metals sector today, rise is consistent with prevailing short and long term uptrends, a regular in ChartWatch ASX Scans Uptrends list 🔎📈
+9.2% Electro Optic Systems (EOS) - No news, general strength across the broader Defence sector today, rise is consistent with prevailing short and long term uptrends, a regular in ChartWatch ASX Scans Uptrends list 🔎📈
+7.2% Artrya (AYA) - No news, rise is consistent with prevailing short and long term uptrends, a regular in ChartWatch ASX Scans Uptrends list 🔎📈
+6.0% Aeris Resources (AIS) - No news, rise is consistent with prevailing short and long term uptrends, a recent regular in ChartWatch ASX Scans Uptrends list 🔎📈
+5.9% Broken Hill Mines (BHM) - No news, rise is consistent with prevailing short and long term uptrends, a regular in ChartWatch ASX Scans Uptrends list 🔎📈
+5.4% Lion Rock Minerals (LRM) - No news, rise is consistent with prevailing short and long term uptrends, a regular in ChartWatch ASX Scans Uptrends list 🔎📈
+5.1% Tasmea (TEA) - Response to Media Speculation on Exec Directors' Holdings, rise is consistent with prevailing short and long term uptrends, a regular in ChartWatch ASX Scans Uptrends list 🔎📈
+5.0% Energy One (EOL) - No news, rise is consistent with prevailing short and long term uptrends, a regular in ChartWatch ASX Scans Uptrends list 🔎📈
+4.7% Antipa Minerals (AZY) - No news, rise is consistent with prevailing short and long term uptrends, a regular in ChartWatch ASX Scans Uptrends list 🔎📈
Trading lower
-10.3% Falcon Metals (FAL) - No news, pulled back in the wake of recent sharp rally.
-9.6% Dateline Resources (DTR) - No news, pulled back in the wake of recent sharp rally.
-9.1% Nanoveu (NVU) - Exercise of Unlisted Options, pulled back in the wake of recent sharp rally.
-9.1% Invictus Energy (IVZ) - No news, pulled back in the wake of recent sharp rally.
-8.5% LTR Pharma (LTP) - No news, pulled back in the wake of recent sharp rally.
Broker Moves
4DMedical (4DX)
Retained at speculative buy at Bell Potter; Price Target: $1.05 from $0.70
ARN Media (A1N)
Retained at underweight at Morgan Stanley; Price Target: $0.40 from $0.50
AGL Energy (AGL)
Retained at equal-weight at Morgan Stanley; Price Target: $10.81
Auckland International Airport (AIA)
Retained at equal-weight at Morgan Stanley; Price Target: $8.08
Aeris Resources (AIS)
Retained at buy at Bell Potter; Price Target: $0.35
Atlas Arteria (ALX)
Retained at equal-weight at Morgan Stanley; Price Target: $5.40
Retained at sector perform at RBC Capital Markets; Price Target: $5.50
APA Group (APA)
Retained at equal-weight at Morgan Stanley; Price Target: $8.68
Aurizon Holdings (AZJ)
Retained at underweight at Morgan Stanley; Price Target: $3.08
Retained at sector perform at RBC Capital Markets; Price Target: $3.20
Canyon Resources (CAY)
Retained at speculative buy at Canaccord Genuity; Price Target: $0.40 from $0.35
Charter Hall Group (CHC)
Retained at overweight at Morgan Stanley; Price Target: $26.35
Collins Foods (CKF)
Retained at buy at Canaccord Genuity; Price Target: $10.85 from $9.65
Retained at overweight at Morgan Stanley; Price Target: $10.60
Retained at buy at Morgans; Price Target: $12.20 from $10.10
Upgraded to outperform from sector perform at RBC Capital Markets; Price Target: $11.70 from $8.50
Retained at buy at UBS; Price Target: $9.75
Retained at overweight at Wilsons; Price Target: $12.23 from $10.20
Capricorn Metals (CMM)
Retained at hold at Bell Potter; Price Target: $10.80 from $9.30
Cleanaway Waste Management (CWY)
Retained at overweight at Morgan Stanley; Price Target: $3.24
Dyno Nobel (DNL)
Retained at outperform at RBC Capital Markets; Price Target: $3.60
Doctor Care Anywhere Group PLC (DOC)
Downgraded to hold from buy at Bell Potter; Price Target: $0.17 from $0.12
DUG Technology (DUG)
Retained at buy at Ord Minnett; Price Target: $2.32 from $2.08
Retained at overweight at Wilsons; Price Target: $2.35 from $1.73
Dexus (DXS)
Retained at underweight at Morgan Stanley; Price Target: $7.95
Energy One (EOL)
Initiated at buy at Jefferies; Price Target: $20.00
Frontier Digital Ventures (FDV)
Retained at buy at Morgans; Price Target: $0.55 from $0.58
Graincorp (GNC)
Retained at buy at Bell Potter; Price Target: $9.10 from $8.45
Retained at buy at Ord Minnett; Price Target: $9.95 from $9.75
Retained at outperform at RBC Capital Markets; Price Target: $10.50 from $10.00
HMC Capital (HMC)
Retained at equal-weight at Morgan Stanley; Price Target: $3.85
Harvey Norman Holdings (HVN)
Retained at buy at Bell Potter; Price Target: $8.30 from $6.00
IperionX (IPX)
Retained at speculative buy at Bell Potter; Price Target: $9.25 from $7.90
Retained at speculative buy at Canaccord Genuity; Price Target: $8.90 from $6.65
Lotus Resources (LOT)
Retained at speculative buy at Bell Potter; Price Target: $0.35
Retained at buy at Bell Potter; Price Target: $0.35
Nufarm (NUF)
Retained at sector perform at RBC Capital Markets; Price Target: $2.75 from $3.50
NRW Holdings (NWH)
Retained at buy at Canaccord Genuity; Price Target: $3.99
Retained at buy at Citi; Price Target: $4.05
Upgraded to outperform from neutral at Macquarie; Price Target: $4.45 from $3.95
Downgraded to accumulate from buy at Morgans; Price Target: $4.50 from $4.20
Retained at buy at UBS; Price Target: $4.50 from $4.00
Qube Holdings (QUB)
Retained at equal-weight at Morgan Stanley; Price Target: $4.51
Retained at sector perform at RBC Capital Markets; Price Target: $4.30
Tabcorp Holdings (TAH)
Retained at overweight at Morgan Stanley; Price Target: $1.15 from $0.78
Transurban Group (TCL)
Retained at equal-weight at Morgan Stanley; Price Target: $14.28
Tetratherix (TTX)
Initiated at hold at Ord Minnett; Price Target: $4.30
Vicinity Centres (VCX)
Retained at underweight at Morgan Stanley; Price Target: $2.70
Viridis Mining and Minerals (VMM)
Retained at speculative buy at Ord Minnett; Price Target: $1.60
Westpac Banking Corporation (WBC)
Downgraded to neutral from buy at UBS; Price Target: $38.00 from $36.00
Worley (WOR)
Upgraded to outperform from sector perform at RBC Capital Markets; Price Target: $18.50 from $18.00
Wisetech Global (WTC)
Retained at buy at Citi; Price Target: $121.35 from $134.00
Xero (XRO)
Downgraded to sector perform from outperform at RBC Capital Markets; Price Target: $187.00 from $230.00
Scans
Top Gainers
Code | Company | Last | % Chg |
|---|---|---|---|
| ABX | ABX Group Ltd | $0.075 | +82.93% |
| KCCDA | Kincora Copper Ltd | $1.04 | +55.22% |
| 4DX | 4DMEDICAL Ltd | $1.155 | +50.00% |
| SNS | Sensen Networks Ltd | $0.065 | +41.30% |
| 8CO | 8COMMON Ltd | $0.04 | +33.33% |
Top Fallers
Code | Company | Last | % Chg |
|---|---|---|---|
| AGN | Argenica Therapeutics Ltd | $0.28 | -56.59% |
| SMM | Somerset Minerals Ltd | $0.012 | -25.00% |
| COD | Coda Minerals Ltd | $0.14 | -17.65% |
| VBS | Vectus Biosystems Ltd | $0.073 | -16.09% |
| EQR | EQ Resources Ltd | $0.035 | -14.63% |
52 Week Highs
Code | Company | Last | % Chg |
|---|---|---|---|
| ABX | ABX Group Ltd | $0.075 | +82.93% |
| KCCDA | Kincora Copper Ltd | $1.04 | +55.22% |
| 4DX | 4DMEDICAL Ltd | $1.155 | +50.00% |
| SNS | Sensen Networks Ltd | $0.065 | +41.30% |
| GIB | Gibb River Diamonds Ltd | $0.062 | +31.92% |
52 Week Lows
Code | Company | Last | % Chg |
|---|---|---|---|
| AGN | Argenica Therapeutics Ltd | $0.28 | -56.59% |
| GTN | GTN Ltd | $0.31 | -7.46% |
| MDR | Medadvisor Ltd | $0.045 | -6.25% |
| BRU | Buru Energy Ltd | $0.018 | -5.26% |
| NGS | Nutritional Growth Solutions Ltd | $0.018 | -5.26% |
Near Highs
Code | Company | Last | % Chg |
|---|---|---|---|
| SMLL | Betashares Australian Small Companies Select ETF | $4.21 | -1.41% |
| ECF | Elanor Commercial Property Fund | $0.715 | 0.00% |
| OZBD | Betashares Australian Composite Bond ETF | $44.88 | -0.49% |
| DFND | Vaneck Global Defence ETF | $35.99 | -0.42% |
| E25 | Element 25 Ltd | $0.34 | +9.68% |
Relative Strength Index (RSI) Oversold
Code | Company | Last | % Chg |
|---|---|---|---|
| PEN | Peninsula Energy Ltd | $0.315 | -4.55% |
| GMG | Goodman Group | $32.26 | -3.70% |
| NWL | Netwealth Group Ltd | $30.88 | -4.13% |
| REH | Reece Ltd | $10.36 | -1.15% |
| MAQ | Macquarie Technology Group Ltd | $58.00 | -3.04% |
