
The ASX 200 fell sharply, bringing the weekly tally to 490 points lost, as an overnight rout in AI stocks on Wall Street triggered selling across every sector. Tech, gold miners and critical minerals stocks were hit hardest, while defensive Utilities and Consumer Staples held up best.
Be sure to click/scroll through for the usual reporting of the major sector and stock-specific moves, the broker responses to them, as well as all the key economic data in tonight's Evening Wrap. Also, I have detailed technical analysis on the Nasdaq Composite and the S&P/ASX 200 in today's ChartWatch.
Let’s dive in!
Today in Review
Name | Value | % Chg |
|---|---|---|
Major Indices | ||
| ASX 200 | 8,592.6 | -1.58% |
| All Ords | 8,692.8 | -1.63% |
| Small Ords | 2,971.3 | -2.71% |
| All Tech | 2,880.3 | -3.63% |
| Emerging Companies | 2,580.5 | -3.11% |
Currency | ||
| AUD/USD | 0.6668 | +0.14% |
US Futures | ||
| S&P 500 | 7,157.75 | -0.55% |
| Dow Jones | 49,069.0 | -0.23% |
| Nasdaq | 26,314.0 | -1.08% |
Name | Value | % Chg |
|---|---|---|
Sector | ||
| Utilities | 10,822.7 | -0.53% |
| Consumer Staples | 13,479.5 | -0.84% |
| Consumer Discretionary | 3,666.4 | -0.92% |
| Energy | 9,866.4 | -1.30% |
| Health Care | 34,728.6 | -1.30% |
| Financials | 9,487.8 | -1.32% |
| Real Estate | 3,414.3 | -1.35% |
| Industrials | 8,344.6 | -1.79% |
| Communication Services | 1,629.1 | -1.80% |
| Materials | 20,089.5 | -2.15% |
| Information Technology | 1,725.8 | -4.71% |
ASX 200 Intraday Chart
Markets
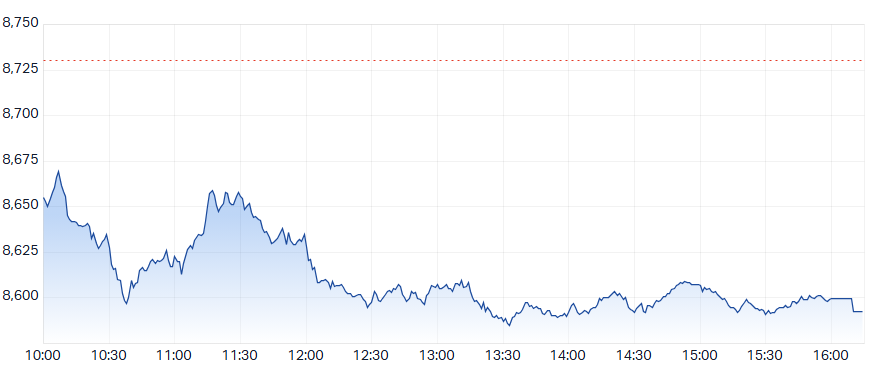
The S&P/ASX 200 (XJO) finished 137.8 points lower at 8,592.6, 1.7% from its session high and just 0.1% from its low. Reflecting the dismal performance at benchmark level, in the broader-based S&P/ASX 300 (XKO) advancers lagged decliners by 33 to 256. 💥
For the week, the XJO finished down 490 points or 5.4% lower, 5.4% from its intraweek high and just 0.1% from its intraweek low. 💥
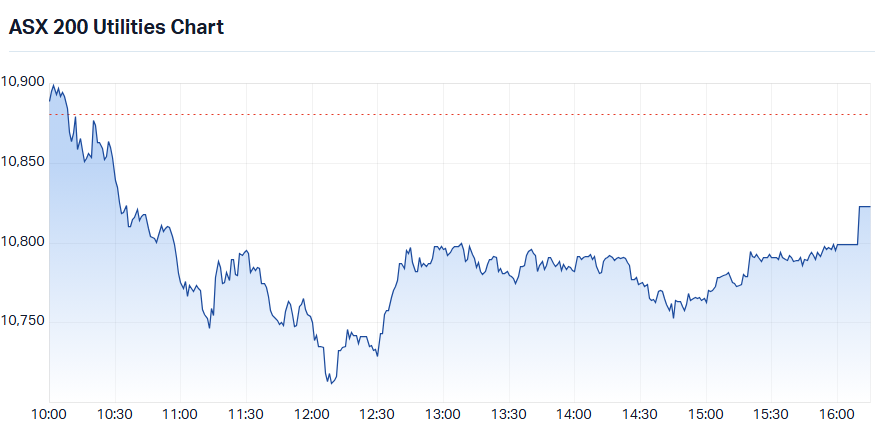
Best sectors!? Every one of the 11 major sector indices fell today, as did the Gold Sub-Index, with the best performer sporting “only” a 0.5% loss. That was Utilities (XUJ) (-0.5%) – the lights gotta stay on and our BYDs need to be charged! 🔋 Meridian Energy (MEZ) (+1.3%) bucked the sell-off, while Origin Energy (ORG) (-0.1%) was barely changed.
S&P-ASX 200 Utilities Sector Index (XUJ) intraday chart
Consumer Staples (XSJ) (-0.8%) was next best – the kids’ lunchboxes still gotta get filled come Monday morning! Inghams Group (ING) (+1.9%) and The A2 Milk Company (A2M) (+0.3%) managed gains. The supermarkets slipped, with Woolworths Group (WOW) (-0.6%) and Coles Group (COL) (-1.0%) both lower.
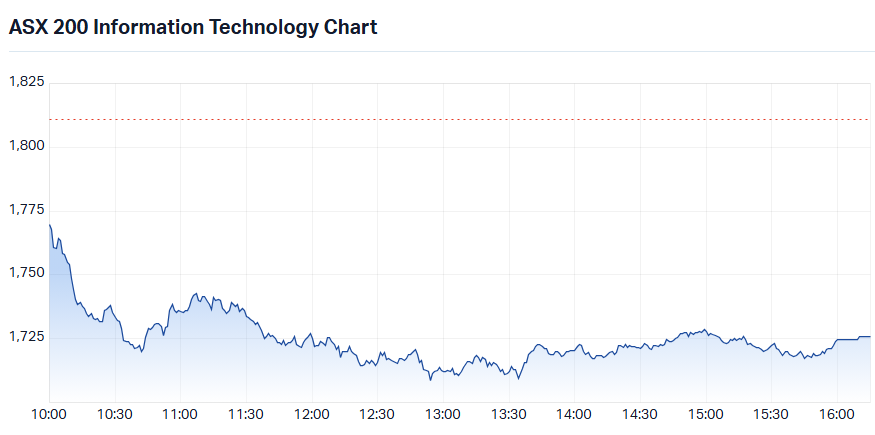
Information Technology (XIJ) (-4.7%) was the worst sector. It’s held up relatively well as the AI trade has unwound globally, but today it simply couldn’t withstand the wave of negative sentiment after last night’s total rout in the Nasdaq. Appen (APX) (-9.5%) and Life360 (360) (-7.2%) were among the hardest hit. Large-cap software names Xero (XRO) (-5.7%) and WiseTech Global (WTC) (-3.8%) also fell, alongside Codan (CDA) (-1.8%).
S&P/ASX 200 Information Technology Sector Index (XIJ) intraday chart
Megaport (MP1) (-12.9%) was the sector’s biggest decliner, falling on the day shareholders delivered a first strike against its pay report at the annual general meeting. NextDC (NXT) (-7.1%) upgraded its guidance but failed to impress investors.
The Gold Sub-Index (XGD) (-4.5%) was hammered as COMEX gold futures fell 3.7% to US$3,548.8/oz and COMEX silver futures slumped 5.7% to US$41.85/oz in Asian trade, adding to modest overnight losses. Precious metals continue to wilt under the weight of a stronger US dollar – even as US bond yields fell overnight on fears of a US and global slowdown. Lower yields normally help gold, which pays no interest, but in troubled times investors flock to the safety of the Greenback. Gold is supposed to be a safe haven too, but it appears the USD is safer!
Gold miners were dumped as fund managers stuck to the script they’ve been running throughout the AI trade unwind – sell resources, sell gold. Genesis Minerals (GMD) (-5.8%) and Black Cat Syndicate (BC8) (-5.4%) led the losses, with Alkane Resources (ALK) (-5.3%) and Capricorn Metals (CMM) (-5.1%) close behind.
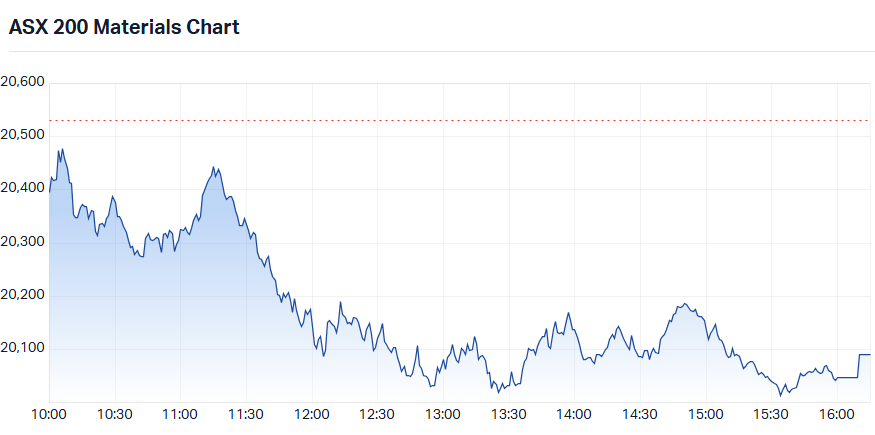
Materials (XMJ) (-2.1%) followed the same script. The critical minerals stocks seen as crucial to the AI revolution were hit hardest, with WA1 Resources (WA1) (-7.1%) and Develop Global (DVP) (-6.9%) leading the losses. IperionX (IPX) (-6.2%) was also sold hard.
S&P/ASX 200 Materials Sector Index (XMJ) intraday chart
Base metals weren’t far behind. COMEX copper futures fell 2.4% to US$5.50/lb in Asian trade amid growing doubt about the sustainability of AI spending and copper’s role in that rollout, with weak Chinese demand adding to the pressure. Aeris Resources (AIS) (-7.5%) and Firefly Metals (FFM) (-6.3%) were hardest hit. Sandfire Resources (SFR) (-3.6%) and BHP Group (BHP) (-1.8%) also fell. Nickel Industries (NIC) (-3.5%) was dragged lower too.
Iron ore stocks bucked the trend, tracking a positive lead from Singapore, where SGX iron ore futures rose 0.6% to US$88.90/t. Fortescue (FMG) (+2.1%) and Champion Iron (CIA) (+0.9%) both gained.
Not so lucky – uranium stocks got smashed again – and again losses were outsized compared to their Sprott Uranium Miners ETF (NYSE: URNM) benchmark (-3.1% overnight). And that’s despite COMEX uranium futures rising 0.3% to US$90.25/lb on Thursday.
Silex Systems (SLX) (-7.9%) and Deep Yellow (DYL) (-7.4%) led the losses. Boss Energy (BOE) (-6.4%) and Paladin Energy (PDN) (-5.5%) were also sold hard. Bannerman Energy (BMN) (-4.4%) and NexGen Energy (NXG) (-4.3%) weren’t spared either.
Financials (XFJ) (-1.3%) did not anchor today’s trade, only just beating the benchmark. Zip Co (ZIP) (-9.4%) was belted in a risk-off, sell-first-ask-questions-later session. Fund managers copped it too, with AMP (AMP) (-5.0%) and Navigator Global Investments (NGI) (-4.8%) sharply lower.
The big four banks all closed lower, led by Westpac Banking Corporation (WBC) (-2.2%) and Macquarie Group (MQG) (-2.2%).
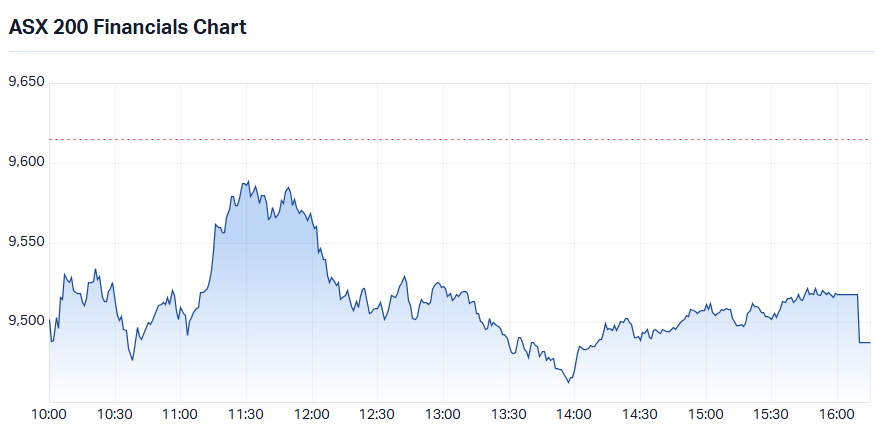
S&P/ASX 200 Financials Sector Index (XFJ) intraday chart
Today's best ASX Top 300 gainers
Company | Last Price | Change $ | Change % | 1mo % | 1yr % |
|---|---|---|---|---|---|
| Vulcan Steel (VSL) | $5.87 | +$0.53 | +9.9% | +8.7% | -15.4% |
| PLS Group (PLS) | $2.62 | +$0.06 | +2.3% | -9.7% | -37.5% |
| Fortescue (FMG) | $13.44 | +$0.28 | +2.1% | -11.9% | -36.7% |
| Chrysos Corporation (C79) | $6.83 | +$0.13 | +1.9% | -3.1% | -24.1% |
| Inghams Group (ING) | $2.11 | +$0.04 | +1.9% | 0.0% | -13.5% |
| Sonic Healthcare (SHL) | $21.65 | +$0.32 | +1.5% | +16.8% | -5.2% |
| Virgin Australia Holdings (VGN) | $2.72 | +$0.04 | +1.5% | +8.4% | -11.1% |
| Meridian Energy (MEZ) | $4.77 | +$0.06 | +1.3% | +8.4% | -3.8% |
| Ingenia Communities Group (INA) | $5.15 | +$0.06 | +1.2% | +21.5% | 0.0% |
| Tuas (TUA) | $1.39 | +$0.015 | +1.1% | -19.4% | -78.6% |
| PYC Therapeutics (PYC) | $1.645 | +$0.015 | +0.9% | -9.1% | +22.5% |
| PEXA Group (PXA) | $6.76 | +$0.06 | +0.9% | +3.0% | -52.6% |
| Pepper Money (PPM) | $1.72 | +$0.015 | +0.9% | +1.8% | -27.4% |
| Champion Iron (CIA) | $1.735 | +$0.015 | +0.9% | -26.2% | -68.1% |
| Scentre Group (SCG) | $3.57 | +$0.03 | +0.8% | +3.8% | -12.7% |
| Kingsgate Consolidated (KCN) | $3.60 | +$0.03 | +0.8% | -22.2% | -14.7% |
| Ridley Corporation (RIC) | $2.47 | +$0.02 | +0.8% | -7.1% | -6.4% |
| Sims (SGM) | $19.40 | +$0.15 | +0.8% | -6.6% | +29.5% |
| Plato Income Maximiser (PL8) | $1.38 | +$0.01 | +0.7% | -0.7% | -2.5% |
| Arena REIT (ARF) | $2.79 | +$0.02 | +0.7% | +12.0% | -24.6% |
Today's worst ASX Top 300 losers
Company | Last Price | Change $ | Change % | 1mo % | 1yr % |
|---|---|---|---|---|---|
| Megaport (MP1) | $14.94 | -$2.21 | -12.9% | -6.2% | +17.1% |
| Perenti (PRN) | $1.66 | -$0.21 | -11.2% | -18.6% | -38.1% |
| Tasmea (TEA) | $7.61 | -$0.81 | -9.6% | -18.3% | +65.4% |
| Zip Co (ZIP) | $1.685 | -$0.175 | -9.4% | -22.3% | -43.5% |
| EQ Resources (EQR) | $0.235 | -$0.02 | -7.8% | -13.0% | +370.0% |
| Sunrise Energy Metals (SRL) | $8.86 | -$0.72 | -7.5% | -42.9% | +103.7% |
| GR Engineering Services (GNG) | $6.20 | -$0.49 | -7.3% | -13.9% | +52.7% |
| Life360 Inc (360) | $20.60 | -$1.60 | -7.2% | +4.4% | -43.5% |
| NEXTDC (NXT) | $9.01 | -$0.69 | -7.1% | -1.9% | -33.7% |
| Minerals 260 (MI6) | $0.665 | -$0.05 | -7.0% | -14.2% | +114.5% |
| Block, Inc. (XYZ) | $110.75 | -$8.32 | -7.0% | -1.7% | +12.8% |
| Develop Global (DVP) | $2.70 | -$0.20 | -6.9% | -32.5% | -22.2% |
| Southern Cross Gold Consolidated (SX2) | $6.89 | -$0.50 | -6.8% | -33.2% | -5.5% |
| Macmahon Holdings (MAH) | $0.76 | -$0.055 | -6.7% | -29.6% | +33.3% |
| MAAS Group Holdings (MGH) | $3.27 | -$0.23 | -6.6% | -13.5% | -22.9% |
| FireFly Metals (FFM) | $1.12 | -$0.075 | -6.3% | -18.5% | -35.7% |
| Nufarm (NUF) | $2.87 | -$0.19 | -6.2% | -6.2% | +12.1% |
| WebBeds Group (WEB) | $3.64 | -$0.24 | -6.2% | +4.0% | -5.7% |
| PDI Gold (PDI) | $3.73 | -$0.24 | -6.0% | -13.3% | +30.9% |
| Westgold Resources (WGX) | $4.86 | -$0.30 | -5.8% | -3.0% | -16.9% |
Chartwatch
Nasdaq Composite Index
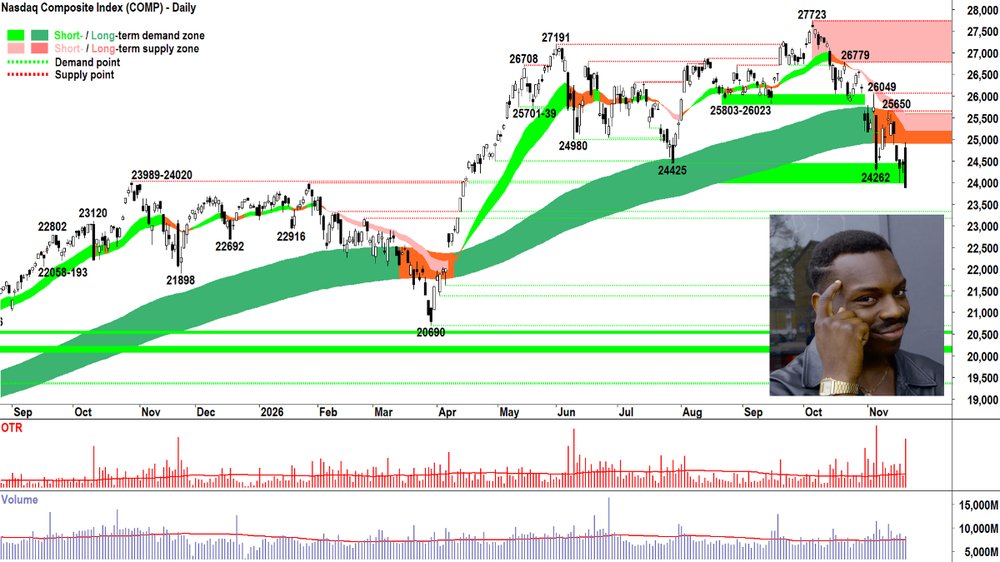
Nasdaq Composite Index chart
Analysis
What did I say yesterday? 🤔
Something about a hunch it was going up? 🤦
Hey, to be fair — the Comp opened over 300 points higher.
Which makes my hunch kinda right…
But also, what happened next kinda makes the rest of my analysis yesterday even more accurate and prophetic!
Because I said that my “up-candle is inbound” hunch is irrelevant compared to the “train wreck” that was the rest of the Comp’s chart.
Thursday’s candle — an absolute monster of a definitive supply side showing — simply demonstrates the importance of MOTN in trend following.
So, hunch up — yet RP = No change at 1/3 invested (contains as much as 40% shorts) vs 2/3 cash.
In a post on X this morning I said: Isn’t it nice when stuff just makes sense.
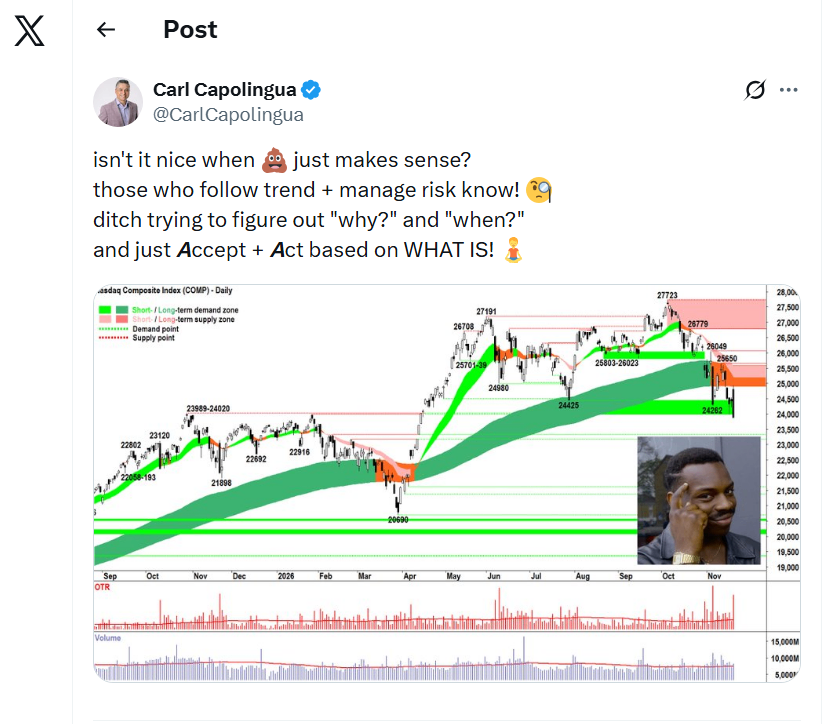
X post this morning: @carlcapolingua click follow and you might be my 10,000th follower! 🥳
Picture this. You wake up. Roll over. Reach for your phone. Click on MarketWatch (as I do) or TradingView… etc. See that big, black monster… and go: Yep, expected as much.
Hit snooze… wake up in another 10 minutes… 😴
That’s where we’re at on the US stock market: Cool. Calm. Calculating.
Most importantly, with risks managed = A whack of cash… a few shorts… and prepared for anything to come. 🧘
Compare this with the average investor in US stocks right now! 😱+🤯
You hang out with me now. It’s easy in our little ChartWatch bubble to become desensitised to the total utter chaos and fear among regular investors out there in the real world...
Spare a thought for those poor souls. If you happen to know one, send them a text or an email and invite them to join our little bubble — I just made a fresh batch of Trend Followers’ Koolaid! 😉
View
Analyse remains: ⚠️⚠️⚠️⚠️⚠️⚠️
Accept remains: S > D = P⬇️
Act remains: I'm at 1/3RP on US stocks (RP = Risk Position – it reflects my personal allowable capital allocation limit for my investments in US stocks. So, 1/3RP is 33%, 1/2RP is 50%, 2/3RP is 67% and FRP is 100%).
Key Levels
The long term trend ribbon is the closest (dynamic) zone of supply (presently 24900-25568). Maybe 23170-23321 could act as a zone of potential latent demand? If it goes... 20690?
S&P/ASX 200 (XJO)
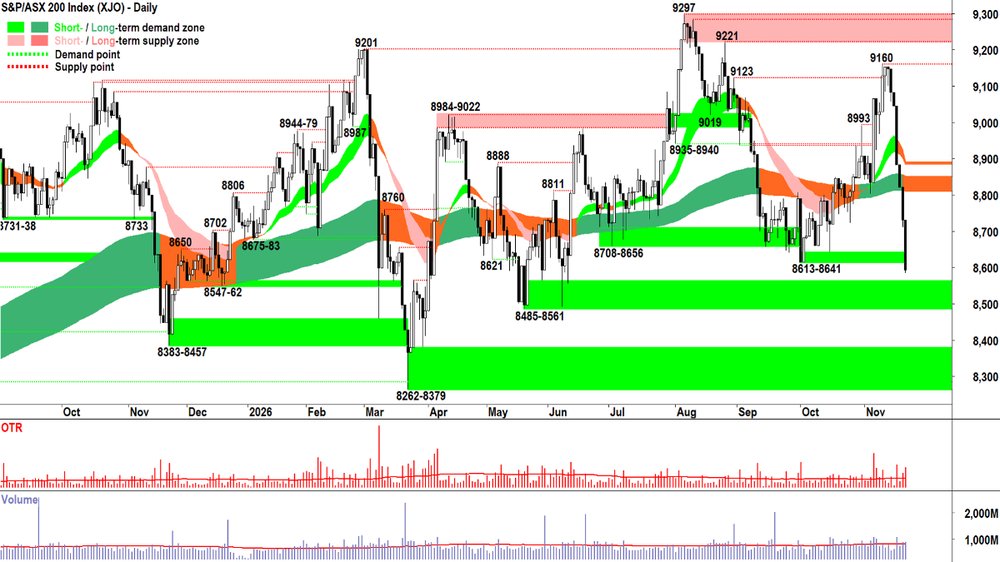
S&P/ASX 200 (XJO) chart
Analysis
Looks like our herd of Zebras just went over a cliff!!!
🦓
🦓
🦓
💥
Let’s call it the fourth time in the chart above that the OTP has snatched defeat from the jaws of victory — a truly Fremantle Dockersesque reversal of fortune… (too soon!? 😉)
The result is the result. No point whinging about it or arguing the point. The market doesn’t argue back, it just does what it does.
The most important thing is: Did we execute our trading plan? Did we Analyse, Accept and Act at every step of the way? 🧐
That’s the bit we CAN control. MOTN doesn’t mean ALWAYS. Sometimes the market chooses to tread down the “1 – MOTN%” path. Which means we lose money.
If we have confidence in our model, we pick ourselves up and get on with the task of… well… what it always is: Analyse, Accept and Act!
(Remember what I said about "Taking losses is like eating breakfast: You just do it and get on with your day!" 💪)
The move to 1/2RP a couple candles ago would have saved a couple-hundred points on the OTP. And we were at least 33% cash before that… Consider that the average fund manager who gets paid the big bucks to manage your money usually has a mandate of 5-10% max cash (and they rarely go past 5).
Also consider, that if you'd been following the model, you would have sold BHP, RIO, FMG and Co. weeks ago!
So, all things considered, I suggest the model did pretty well here. It’s a trend following model, but it’s built to be responsive when it needs to be.
The big question we must answer on a Friday afternoon (when we’re all probably cooked for the week) is: Does 1/2RP become 1/3RP? 🤔
The rule is: Long term trend ribbon is acting as a zone of dynamic supply = ✅
I can’t see that yet.
And so, I’m going to stick with 1/2RP for now. There’s plenty of balance there, and as we noted in Wednesday’s webinar (click to the end = must see stuff!) — it’s not like there’s much long-side RP around anyway… 🤷
Have a fantastic weekend everyone. I trust my ramblings here were of at least some use to you through this recent tricky period… and if you did take a bit of a beating, as we always say in ChartWatch:
Don’t get bitter, get better! 💪
View
I remain at 1/2RP on Australian shares (i.e., 50% invested vs 50% cash, with some of the invested portion allocated to shorts).
Key Levels
The long term trend ribbon (presently 8810-8853) will now likely act as a dynamic zone of excess supply. 8485-8561 is the next critical zone of demand.
(Glossary of acronyms! Old Tin Pot (OTP): S&P/ASX 200 | MOTN: More Often Than Not | FOMO: Fear Of Missing Out | HOFU: Holding On For Upside | BTD: Buy The Dip | NUTE: No Urgency To Enter | FOHO: Fear Of Holding On | STR: Sell The Rally | RP: Risk Position | FFS: Fund Flow Shenanigans!)
***CHARTWATCH LIVE — NEW VIDEO DROPPED!!! 📺***
ChartWatch LIVE Webinars – WEEKLY Wednesday's @ 12pm AEDT
Learn more about technical analysis and trend following through real case studies on ASX stocks. Australia's premier technical analyst, Carl Capolingua, shares his unique insights on stocks as requested by viewers. Ask about a company in your portfolio or anything related to trading and investing and get Carl's expert opinion.
Places are limited so >REGISTER NOW!<
Economy
TODAY
People's Bank of China ("PBOC") Loan Prime Rate ("LPR")
1-year LPR: Unchanged at 3.00% p.a. as forecast
5-year LPR: Unchanged at 3.50% p.a. as forecast
FRIDAY/SATURDAY
That's it for the week!
Interesting Movers
Trading higher
- Echo IQ (EIQ) $0.33+18.2%
No news today. Bounced after yesterday's 42% fall. +20% sounds good, but keep in mind its +20% of the 58% that was left over...
- The Koala Company (KOA) $5.96+12.9%
Issued a trading update at its AGM held today. Management said sales and momentum have continued to remain strong. In the first 17 weeks to 31 October written sales grew 35.0% in constant currency (26.0% reported). All markets reported to be in growth with continued momentum.
- Duratec (DUR) $2.11+7.4%
Announced that it has secured three new contracts with a combined value of over $200m. On of the contracts was a four-year integrated maintenance services contract with Santos.
- Sonic Healthcare (SHL) $21.65+1.5%
No news, continued positive response to yesterday's trading update and AGM commentary.
Trading Lower
- Monash IVF Group (MVF) $0.58-23.8%
Issued a trading update. For 1 July to 20 November the Australian stimulated-cycle market contracted by 3.2% in Q1 FY27. Trading momentum in October and November delivered improved earnings versus Q1 FY27, but management said there remains uncertainty about the market outlook for the rest of the year.
- Megaport (MP1) $14.94-12.9%
Issued a trading update at its AGM held today. Management said new agreements and deployment progress supported the FY27 guidance upgrade announced in September. Separately, the remuneration report failed to pass the AGM after 57.96% of shareholder votes were cast against it.
- Perenti (PRN) $1.66-11.2%
Announced that CFO Michael Ellis will leave to pursue a role with a non-competitor. He will be succeeded by Simon Franich.
- Zip Co (ZIP) $1.69-9.4%
Substantial share holder notice stating that JPMorgan Chase & Co. now owns 5.1% of the company. The substantial holding appears largely attributable to securities-lending activity – potentially including the facilitation of short selling – rather than a conventional investment stake.
- NEXTDC (NXT) $9.01-7.1%
Issued a trading update. Management upgraded net revenue guidance to $485–$500 million (from $475–$500 million) and underlying EBITDA guidance to $260–$275 million (from $245–$265 million). Upgrades were due to strong sales and revenue growth outside affected M3 contracts, greater confidence in customer delivery and improved cost savings. Management also reaffirmed capex guidance of $4.5–$5 billion.
Broker Moves
Company | Broker | Action | Rating | Price Target |
|---|---|---|---|---|
360Life360 Inc | Bell Potter | Retained | Buy | $30.60(from $30.00) |
A2MThe a2 Milk Company | Bell Potter | Retained | Hold | $6.80(from $7.00) |
| Citi | Downgraded | Neutral(from Buy) | $7.20 | |
| Macquarie | Retained | Outperform | $7.80(from $8.10) | |
| Morgan Stanley | Retained | Overweight | $8.50 | |
| Ord Minnett | Downgraded | Accumulate(from Buy) | $6.90(from $7.50) | |
AACAustralian Agricultural Company | Bell Potter | Retained | Buy | $1.95(from $1.85) |
ACWActinogen Medical | Canaccord Genuity | Retained | Speculative Buy | $0.04(from $0.08) |
ALQALS | UBS | Retained | Buy | $27.00 |
AMPAMP | Citi | Retained | Buy | $2.60 |
APAAPA Group | Citi | Retained | Buy | $11.10 |
AR1Austral Resources Australia | Bell Potter | Retained | Speculative Buy | $0.12(from $0.17) |
BRGBreville Group | Citi | Retained | Buy | $40.80 |
C79Chrysos Corporation | Bell Potter | Retained | Buy | $8.70 |
| Shaw and Partners | Retained | Buy | $9.00 | |
CUPCount | Canaccord Genuity | Retained | Buy | $2.30 |
EHLEmeco Holdings | Canaccord Genuity | Retained | Buy | $1.40(from $1.43) |
EIQEcho IQ | Morgans | Retained | Speculative Buy | $0.65(from $1.10) |
| Ord Minnett | Retained | Speculative Buy | $0.95(from $1.55) | |
ELVElevra Lithium | UBS | Retained | Buy | $8.90 |
GOZGrowthpoint Properties Australia | Citi | Retained | Buy | $2.60 |
IFTInfratil | Morgans | Upgraded | Buy(from Accumulate) | $13.80 |
IGOIGO | Citi | Retained | Neutral | $5.75 |
| UBS | Retained | Buy | $8.65 | |
IPHIPH | Morgans | Retained | Buy | $4.35(from $4.65) |
LICLifestyle Communities | Canaccord Genuity | Retained | Buy | $5.85 |
LTRLiontown | Citi | Retained | Neutral | $0.75 |
| UBS | Retained | Buy | $1.20 | |
NUFNufarm | Bell Potter | Retained | Buy | $3.90 |
| Citi | Retained | Neutral | $3.40(from $3.30) | |
| Macquarie | Retained | Neutral | $3.25(from $2.90) | |
| Morgans | Retained | Buy | $4.14(from $4.24) | |
NXTNEXTDC | Citi | Retained | Buy | $12.75 |
OMAOmega Oil & Gas | Bell Potter | Retained | Speculative Buy | $1.60(from $1.40) |
PLSPLS Group | Citi | Retained | Buy | $4.10 |
| UBS | Retained | Buy | $4.90 | |
PMTPMET Resources Inc | UBS | Retained | Buy | $0.90 |
PXAPEXA Group | Macquarie | Retained | Outperform | $10.40(from $12.35) |
RDYReadyTech Holdings | Morgans | Retained | Speculative Buy | $2.20(from $2.25) |
RICRidley Corporation | Morgans | Upgraded | Buy(from Accumulate) | $2.90(from $3.12) |
SGPStockland | Morgan Stanley | Retained | Equal Weight | $4.75 |
SHLSonic Healthcare | Macquarie | Retained | Neutral | $21.80(from $22.40) |
| Ord Minnett | Retained | Hold | $19.90 | |
SK1Skinkandy | Morgans | Retained | Buy | $3.20(from $3.10) |
SSGShaver Shop Group | Ord Minnett | Retained | Hold | $1.30(from $1.40) |
SVRSolvar | Canaccord Genuity | Retained | Buy | $1.80(from $2.00) |
TCLTransurban Group | Citi | Downgraded | Sell(from Neutral) | $13.90(from $14.70) |
WA1WA1 Resources | Bell Potter | Retained | Speculative Buy | $19.60(from $27.20) |
WC8Wildcat Resources | UBS | Retained | Buy | $0.50 |
WEBWebBeds Group | Citi | Retained | Buy | $4.60(from $0.90) |
XROXero | Citi | Retained | Buy | $95.40 |
Scans
Top Gainers
Code | Company | Last | % Chg |
|---|---|---|---|
| LIO | Lion Energy Ltd | $0.02 | +25.00% |
| MNB | Minbos Resources Ltd | $0.015 | +25.00% |
| LMS | Litchfield Minerals Ltd | $0.14 | +21.74% |
| BEL | Bentley Capital Ltd | $0.012 | +20.00% |
| FLN | Freelancer Ltd | $0.12 | +20.00% |
Top Fallers
Code | Company | Last | % Chg |
|---|---|---|---|
| AGN | Argenica Therapeutics Ltd | $0.07 | -30.00% |
| BKT | Black Rock Mining Ltd | $0.011 | -26.67% |
| MVF | Monash Ivf Group Ltd | $0.575 | -23.84% |
| SCN | Scorpion Minerals Ltd | $0.014 | -22.22% |
| LAM | Laramide Resources Ltd | $0.37 | -21.28% |
52 Week Highs
Code | Company | Last | % Chg |
|---|---|---|---|
| KOA | The Koala Company Ltd | $5.96 | +12.88% |
| CLG | Close the Loop Ltd | $0.055 | +7.84% |
| EMB | Embelton Ltd | $14.00 | +3.70% |
| FRM | Farm Pride Foods Ltd | $0.30 | +1.70% |
| PRB | Parbo Resources Ltd | $0.34 | +1.49% |
52 Week Lows
Code | Company | Last | % Chg |
|---|---|---|---|
| AGN | Argenica Therapeutics Ltd | $0.07 | -30.00% |
| MVF | Monash Ivf Group Ltd | $0.575 | -23.84% |
| SCN | Scorpion Minerals Ltd | $0.014 | -22.22% |
| LAM | Laramide Resources Ltd | $0.37 | -21.28% |
| LRM | Lion Rock Minerals Ltd | $0.012 | -20.00% |
Near Highs
Code | Company | Last | % Chg |
|---|---|---|---|
| NDIA | Global X India Nifty 50 ETF | $68.49 | +2.48% |
| BEAR | Betashares Australian Equities Bear Complex ETF | $7.66 | +1.59% |
| RHC | Ramsay Health Care Ltd | $53.90 | -0.94% |
| OZBD | Betashares Australian Composite Bond ETF | $43.66 | +0.14% |
| AN3PI | Australia and New Zealand Banking Group Ltd | $103.188 | +0.28% |
Relative Strength Index (RSI) Oversold
Code | Company | Last | % Chg |
|---|---|---|---|
| ETPMPM | Global X Metal Securities Australia Ltd | $307.55 | -6.15% |
| OZR | State Street SPDR S&P/ASX 200 Resources ETF | $14.96 | -2.67% |
| CSC | Capstone Copper Corp | $8.84 | -2.96% |
| GLN | Galan Lithium Ltd | $0.175 | -5.41% |
| GLDN | iShares Physical Gold ETF | $42.00 | -5.17% |