News | Market Wraps
Evening Wrap: ASX 200 closes week on firmer footing as Unknowns turn into Knowns
The S&P/ASX 200 closed 39.5 points higher, up 0.48%.

Mentioned
The S&P/ASX 200 closed 39.5 points higher, up 0.48%.
A solid end to the week, it’s always reassuring when the ASX 200 closes higher on a Friday – a day when there’s two days of “President Trump could literally say or do anything this weekend to crash the markets” to contend with.
Few might miss the fact we were down for the week, however. The ASX 200 lost just shy of 7 points, which is nothing to worry about given how far we’ve come from the lows of this correction – nearly 15% better off!
Today’s gains were concentrated in banking and insurance names, with Macquarie Group (MQG) (+3.8%) and QBE Insurance Group (QBE) (3.5%) shooting higher, and Westpac Banking Corporation (WBC) (+2.3%) recouping a big chuck of it’s ex-dividend move yesterday.
Big tech also featured heavily in the winners list with Nuix (NXL) (+10.2%), Megaport (MP1) (+3.9%), and Xero (XRO) (+2.7%) notable winners in that sector.
Really, only the Gold Sub-Index (XGD) (-0.68%) suffered, as the price of gold pared back further overnight. The sector has been flying in 2025, yet with so many other stocks seemingly back in the good books – perhaps we’re seeing some profit taking here. Majors Northern Star Resources (NST) (-0.60%) and Newmont Corporation (NEM) (-0.45%) nursed modest losses.
To make sense of all the above, I have detailed technical analysis on the Nasdaq Composite, S&P/ASX 200, and Gold in today's ChartWatch.
Be sure to click/scroll through for the usual reporting of the major sector and stock-specific moves, the broker responses to them, as well as all the key upcoming economic data in tonight's Evening Wrap.
Let's dive in!
Today in Review
Fri 09 May 25, 5:06pm (AEST)
Name | Value | % Chg |
|---|---|---|
Major Indices | ||
| ASX 200 | 8,231.2 | +0.48% |
| All Ords | 8,462.6 | +0.49% |
| Small Ords | 3,193.5 | +0.59% |
| All Tech | 3,677.1 | +1.32% |
| Emerging Companies | 2,289.9 | -0.04% |
Currency | ||
| AUD/USD | 0.6464 | 0.00% |
Sector | ||
| Information Technology | 2,574.4 | +1.82% |
| Financials | 8,811.0 | +1.10% |
| Consumer Staples | 12,860.8 | +1.03% |
Name | Value | % Chg |
|---|---|---|
Sector | ||
| Energy | 7,431.1 | +0.79% |
| Utilities | 9,607.0 | +0.64% |
| Communication Services | 1,771.1 | +0.51% |
| Health Care | 41,021.8 | +0.37% |
| Consumer Discretionary | 4,067.3 | +0.10% |
| Industrials | 8,134.7 | +0.04% |
| Real Estate | 3,833.9 | -0.01% |
| Materials | 16,183.0 | -0.46% |
Markets
%20intraday%20chart%209%20May%202025.png)
ASX 200 Session Chart
The S&P/ASX 200 (XJO) finished 39.5 points higher at 8,231.2, 0.59% from its session low and just 0.14% from its low. In the broader-based S&P/ASX 300 (XKO), advancers beat decliners by a solid margin for the fourth day in a row, this time by 175 to 97. For the week, the XJO finished down 6.8 points or 0.08% lower, 1.14% from its intraweek low and just 0.14% from its intraweek high.
Relief.
That was the overriding theme of today’s trade on the ASX – another brisk day after a week of mostly contemplation. With each day, it seems investors are moving one jar from the “Unknown” shelf and placing it on the “Known” shelf.

Knowns vs unknowns…Hmmm...Which shelf does this one go on?
Cast your minds back to the beginning of President Trump’s trade war, and just how many jars we had on the “Unknown” shelf. Don’t get me wrong – there’s still plenty there – including a big jar of “US Economy in the toilet” and “China Economy in the toilet”, but we’ve made some progress in terms of understanding how bad things might get on several fronts.
More importantly, markets have grown more confident that President Trump’s minders won’t allow him to completely screw things up. We owe the bond market big time for that one!
The UK-US trade deal is one example of a jar being moved onto the “Known” shelf, so we got a boost today, but the market is also rising because it's anticipating more of these transfers between the two shelves to occur.
As long as the transfers keep happening, and no jars of Unknowns suddenly explode, showering us in a plume of “in the toilet”, we should be fine.
ChartWatch
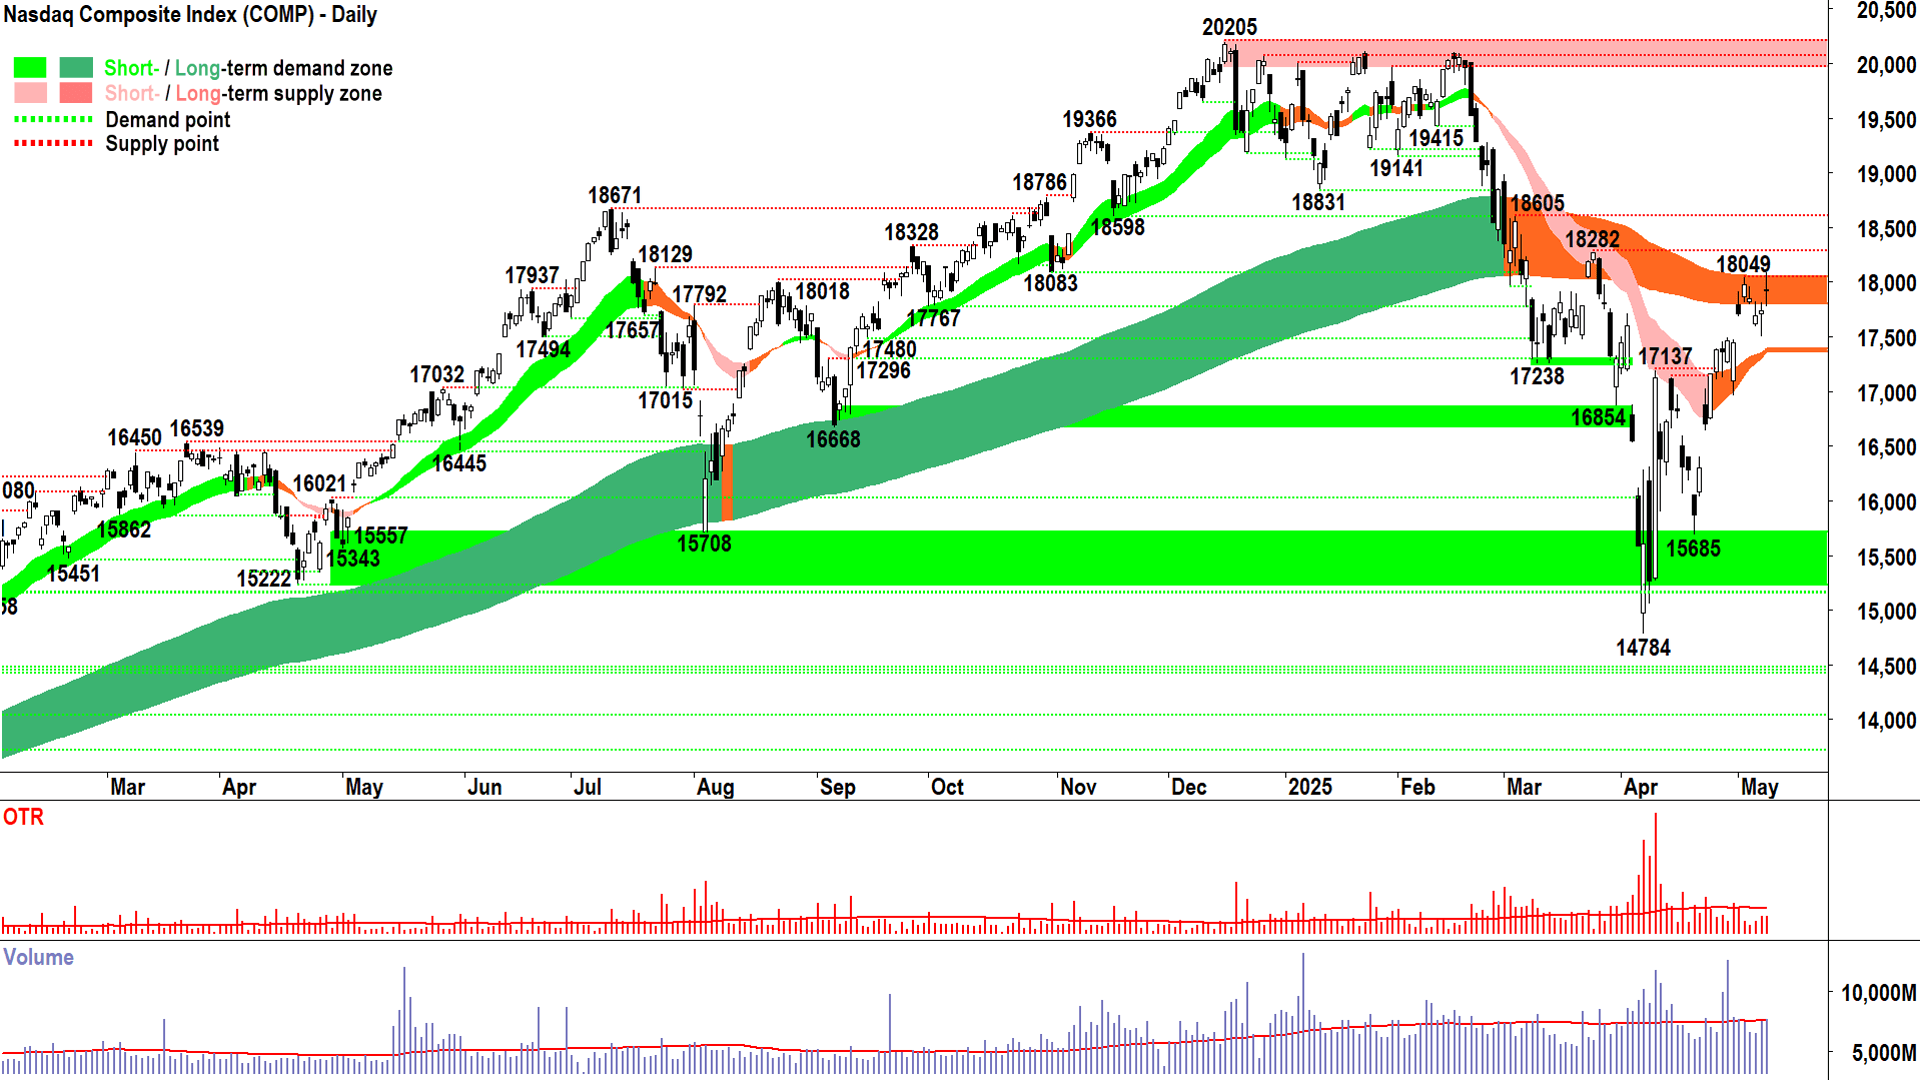
NASDAQ Composite Index

D, S, P, it's all you need to think about 🧠 (click here for full size image)
I know I keep saying this, but another interesting candle on the Comp last night!
It’s interesting because it started out as we would have expected, with excess demand following through from Wednesday’s reversal / downward pointing shadow.
But, it looks like the supply-side had to scratch an itch and take some risk off the table by the close (hence the upward pointing shadow).
Overall, however, the near perfect balance between upward and downward pointing shadows smacks of a corresponding balance between demand and supply. But that’s exactly the kind of thing we’d associate with a strong short term uptrend hitting the long term trend ribbon from beneath.
Think about it for a second.
We hit the long term uptrend ribbon from a state of excess demand: D > S = P⬆️
The long term uptrend ribbon represents a zone of supply – but in reality it’s just an imaginary bunch of orange pixels on our computer screens.
We only know if it actually is a zone of supply by the price action that occurs there…so black-bodies and or upward pointing shadows.
If we see some of those, then we know that the S in the above equation as risen at least a bit (S⬆️). There’s really only 3 options from here (which we will guess based on the nature / severity of the supply-side candles observed in the long term trend ribbon):
If there’s a wall of supply in excess of prevailing demand, then the market state will shift to S > D = P⬇️
If there’s just enough supply to meet the prevailing demand, then the market state shift to D = S = P➡️
If there’s insufficient supply to meet the prevailing demand, then we might slow down a little around the ribbon, but ultimately the prevailing short term uptrend will continue. As we clear the long term trend ribbon, more market participants believe in the rally and therefore withhold their supply for even higher prices, and more feel a growing sense of FOMO and add their cash to the demand-side. The market state will shift further towards D > S = P⬆️
Now, I could have shown you a dozen indicators like the RSI, Stochastics, MACD, Bollinger Bands, Fibonacci and Elliott Wave – but none of them would have explained one iota what was going on in the demand-supply environment (which is why all of those are completely useless to me 👎!).
Conclusions from this week’s price action so far? 🤔
The demand-side remains in control of the short term price action, as we’re still rising peaks/rising troughs and predominantly demand-side candles.
The long term trend ribbon is indeed behaving as a zone of supply, but so far, the evidence suggests the supply side has only minimal motivation and or the demand-side continues to have their measure.
Some indecision remains, and we’d still love an emphatic close above 18049 to reaffirm total demand-side control and likely kick off the next stage of the rally towards 18282-18605.
Thursday’s candle logs Wednesday’s low as a new, higher trough / point of demand at 17503 – it coincides with the top of a major demand zone between 16959-17500 that is critical to the maintenance of the recovery. Our view that the path of least resistance is likely up is intact while the Comp closes above this zone.
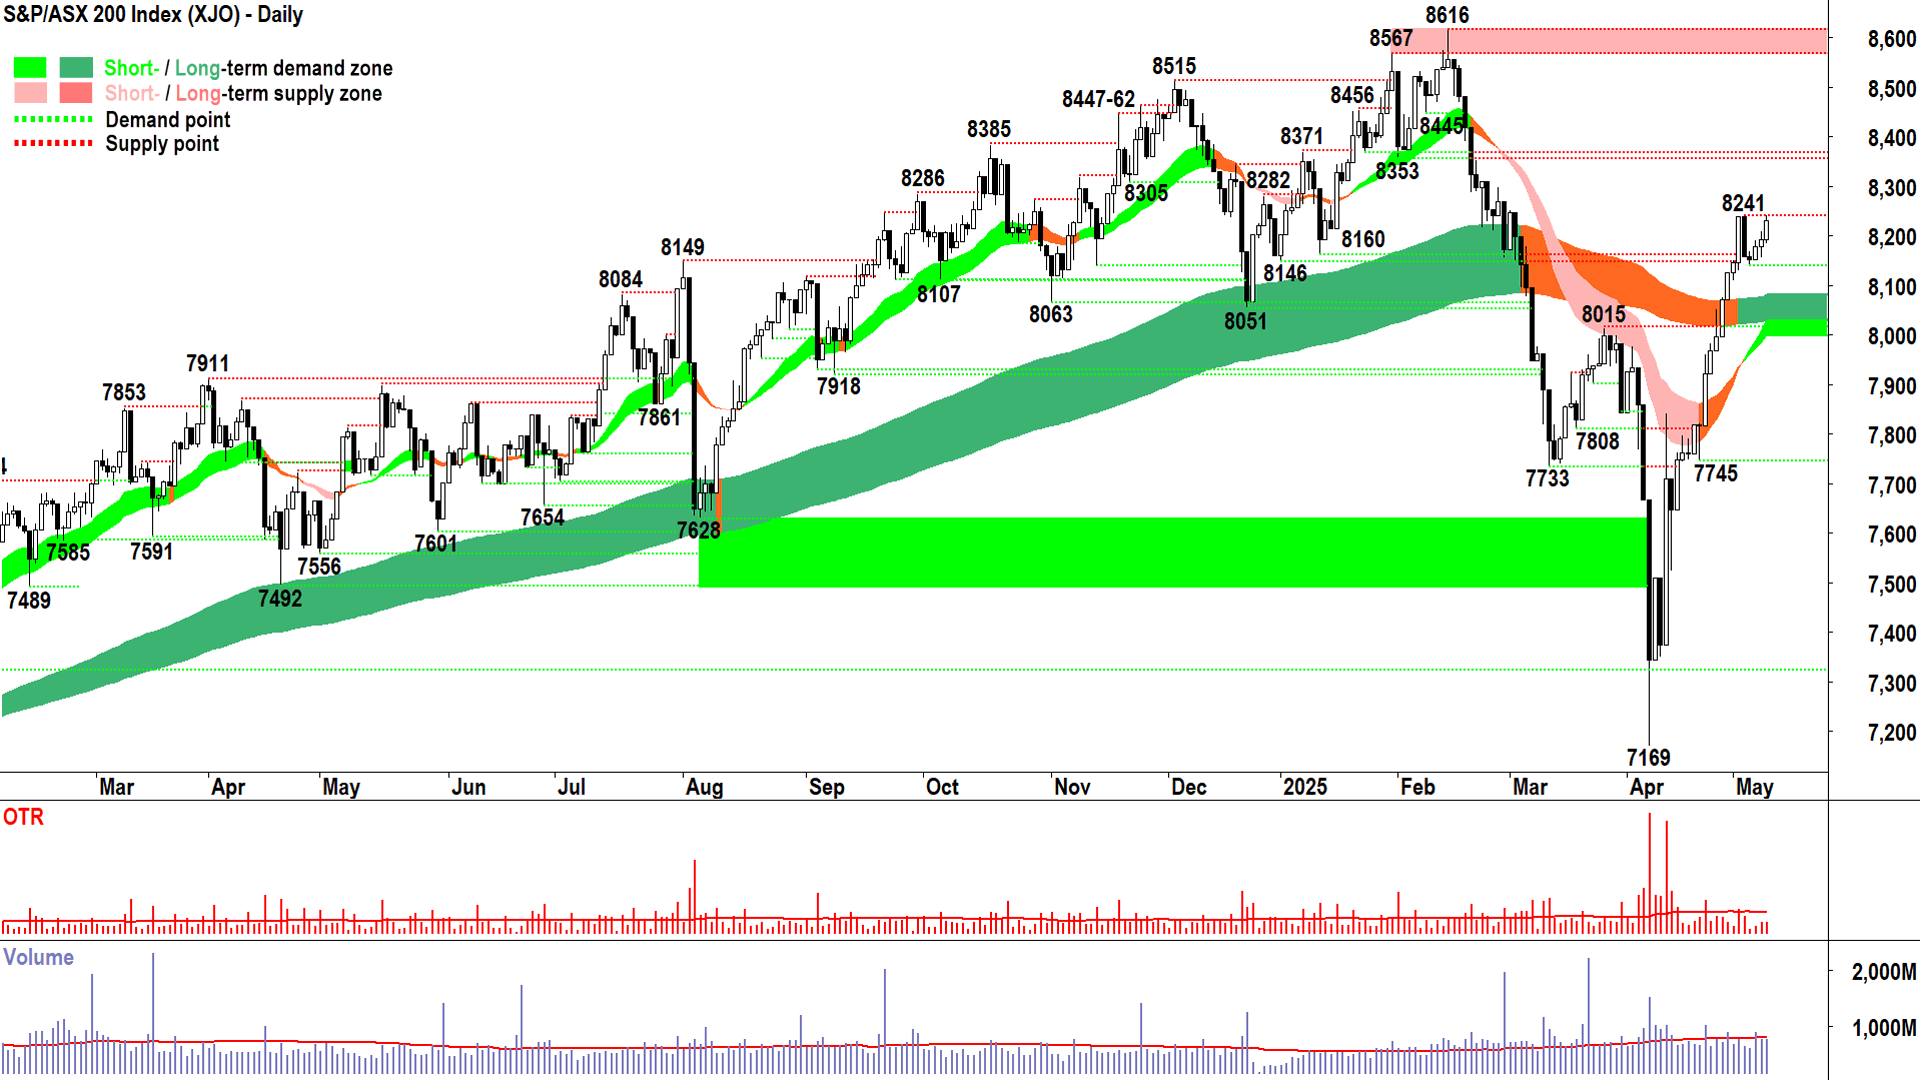
S&P/ASX 200 (XJO)
%20chart%209%20May%202025.png)
An interesting chart (click here for full size image)
Given it’s Friday, and given I think I’ve called this one pretty well this week, permit me the brevity of just one comment here this evening:
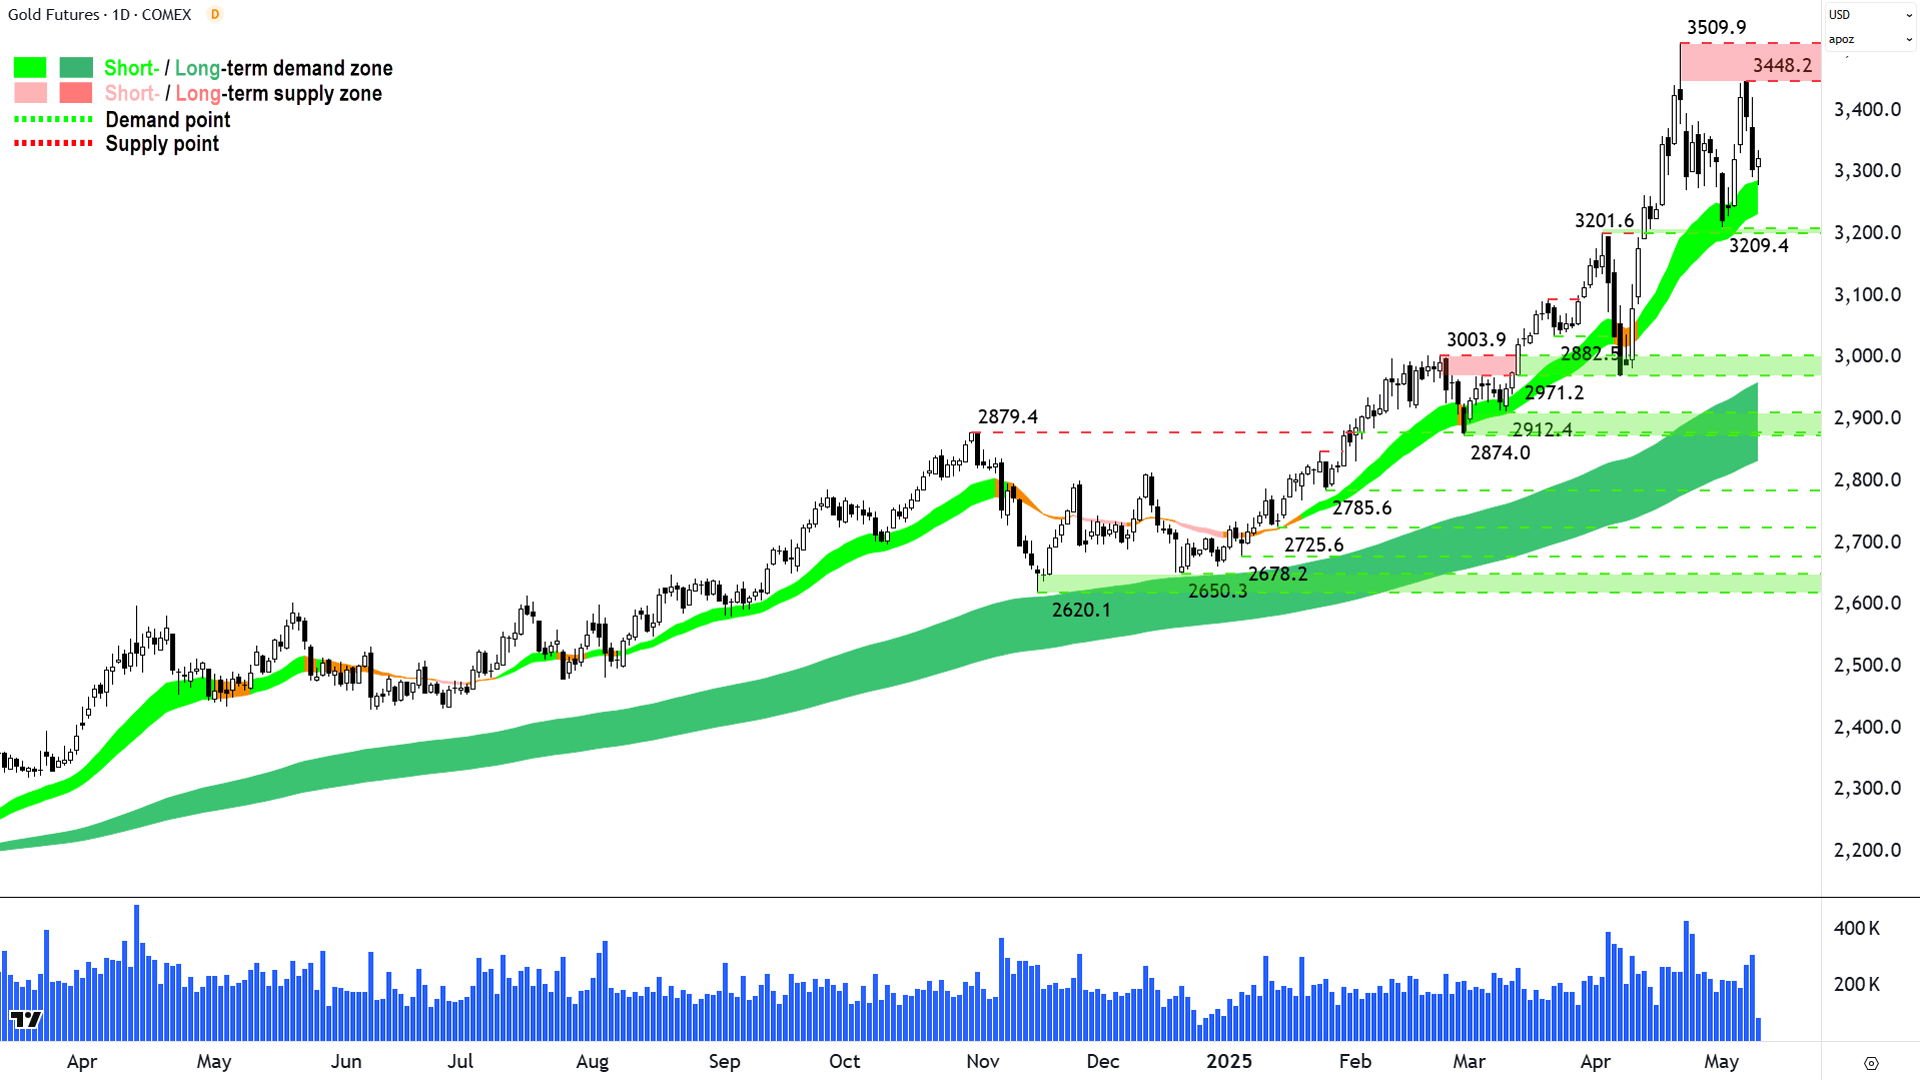
Gold Futures (Front month, back-adjusted) COMEX
%20COMEX%20chart%209%20May%202025.png)
An interesting chart (click here for full size image)
The last time we covered gold was in ChartWatch in the Evening Wrap on 6 May.
In that update, gold had rebounded strongly from the short term uptrend ribbon and was making its way back towards the 3509.9 all-time high.
There was little reason at the time to doubt the demand-side’s control of gold’s long term price action prior, and with a return to short term uptrend – all a trend follower can do is go with the flow.
But, nagging at the back of my mind was what I called a “credible supply-side showing” from that 3509.9 peak two updates ago in the Evening Wrap on 23-Apr.
I am growing more of the view that it constitutes a first shot across the bow by the supply-side, and that it’s now being reinforced in recent price action. With Thursday’s convincing supply-side candle, we now have an important lower peak (3448.2).
I propose that short term supply in the gold market is building. That first shot of the bow was less effectual than it might have been in other, mortal markets, because broader gold demand is so entrenched that what may have been classified as a serious supply-side attack on 22-23-May was shrugged off by traders who cannot contemplate any other market state but rising prices.
I suspect the demand-side needs to be on alert here – there is a credible threat to their dominance at play.
Note that I also mentioned in that 23-Apr update the idea of reducing risk exposure to gold but not going too far due to the then-intact nature of the long term uptrend.
The long term uptrend is still intact, nobody can dispute that, but I believe there’s even more reason now to take an increasingly conservative stance here. My analysis suggests the demand-supply environment is increasingly moving towards equilibrium at best.
At worst, and this would be confirmed by a close below the now-critical 3201.6-3209.4 demand zone, it’s transitioning to supply-side control ⚠️.
Economy
Today
CHN Trade Balance April: +CNY 690 billion vs +CNY 701 billion forecast and +CNY 737 billion in March (i.e., sharply lower and smaller surplus than expected, inline with narrative of slowing trade due to US tariffs)
Later this week
Saturday
11:30 CHN Consumer Price Index (CPI) & Producer Price Index (PPI) Inflation April y/y
CPI: -0.2% p.a. forecast vs -0.1% p.a. in March
PPI: -2.6% p.a. forecast vs -2.5% p.a. in March
Latest News
Interesting Movers
Trading higher
+17.9% Chrysos Corporation (C79) - Chrysos Enters MSA With Newmont Corporation.
+17.6% Liontown Resources (LTR) - No news since 07-May Lithium Industry Support Program, some chatter on social media today about it being a potential takeover target, I suspect short covering in the mix exacerbating the move.
+15.2% Regal Partners (RPL) - No news since 06-May Macquarie Australia Conference Presentation.
+13.3% White Cliff Minerals (WCN) - No news06-May 175m @ 2.5% Copper Hole Ends in 4.46% Copper, rise is consistent with prevailing short and long term uptrends 🔎📈
+11.9% Webjet (WJL) - Response to ASX Query (undisclosed buyer seeking to acquire up to 5.0% of the company).
+10.2% Nuix (NXL) - Change in substantial holding from AEF (AEF increase).
+9.3% Droneshield (DRO) - No news, rise is consistent with prevailing short and long term uptrends, a regular in ChartWatch ASX Scans Uptrends list 🔎📈
+7.6% Koonenberry Gold (KNB) - No news, rise is consistent with prevailing short and long term uptrends, a regular in ChartWatch ASX Scans Uptrends list 🔎📈
Trading lower
-16.4% Avita Medical (AVH) - Financial Results for Quarter Ending 31 March 2025, fall is consistent with prevailing long term downtrend 🔎📉
-10.0% Dateline Resources (DTR) - No news, general weakness across the broader Gold sector today, pulled back in the wake of recent sharp rally.
-8.7% Rox Resources (RXL) - No news, general weakness across the broader Gold sector today.
-7.7% Dimerix (DXB) - No news since 06-May Dimerix receives initial upfront payment from Amicus, pulled back in the wake of recent sharp rally.
-6.1% Smartgroup Corporation (SIQ) - No news 🤔.
-5.8% Silex Systems (SLX) - No news, today's move is consistent with recent volatility.
-5.6% Ora Banda Mining (OBM) - No news, general weakness across the broader Gold sector today.
-5.1% Light & Wonder (LNW) - Continued negative response to 07-May LNW Q1 2025 Earnings release.
Broker Moves
Broker moves are taking a break today due to a technical issue with our information supplier.
Scans
Top Gainers
Code | Company | Last | % Chg |
|---|---|---|---|
| CMD | Cassius Mining Ltd | $0.022 | +37.50% |
| JAL | Jameson Resources Ltd | $0.04 | +33.33% |
| TASDA | Tasman Resources Ltd | $0.02 | +33.33% |
| PCL | Pancontinental Energy NL | $0.013 | +30.00% |
| VRX | VRX Silica Ltd | $0.057 | +26.67% |
Top Fallers
Code | Company | Last | % Chg |
|---|---|---|---|
| SRH | Saferoads Holdings Ltd | $0.175 | -35.19% |
| FNR | Far Northern Resources Ltd | $0.12 | -29.41% |
| MDR | Medadvisor Ltd | $0.096 | -26.15% |
| HLS | Healius Ltd | $1.155 | -25.00% |
| PHO | Phosco Ltd | $0.054 | -22.86% |
52 Week Highs
Code | Company | Last | % Chg |
|---|---|---|---|
| CMD | Cassius Mining Ltd | $0.022 | +37.50% |
| TASDA | Tasman Resources Ltd | $0.02 | +33.33% |
| DES | Desoto Resources Ltd | $0.165 | +13.79% |
| WCN | White Cliff Minerals Ltd | $0.034 | +13.33% |
| HRN | Horizon Gold Ltd | $0.55 | +12.25% |
52 Week Lows
Code | Company | Last | % Chg |
|---|---|---|---|
| HLS | Healius Ltd | $1.155 | -25.00% |
| KOB | Koba Resources Ltd | $0.039 | -11.36% |
| CBY | Canterbury Resources Ltd | $0.018 | -10.00% |
| SVY | Stavely Minerals Ltd | $0.011 | -8.33% |
| XAM | Xanadu Mines Ltd | $0.047 | -7.84% |
Near Highs
Code | Company | Last | % Chg |
|---|---|---|---|
| OZBD | Betashares Australian Composite Bond ETF | $44.82 | -0.38% |
| WVOL | Ishares MSCI World Ex Aust Minimum Volatility ETF | $43.91 | -0.36% |
| AII | Almonty Industries Inc | $2.77 | +6.54% |
| STK | Strickland Metals Ltd | $0.105 | +7.14% |
| IAGPF | Insurance Australia Group Ltd | $104.10 | +0.10% |
Relative Strength Index (RSI) Oversold
Code | Company | Last | % Chg |
|---|---|---|---|
| JDO | Judo Capital Holdings Ltd | $1.395 | -0.36% |
| NWSLV | News Corporation | $41.40 | +0.24% |
| CRN | Coronado Global Resources Inc | $0.165 | -2.94% |
| AOF | Australian Unity Office Fund | $0.485 | 0.00% |
| SKC | Skycity Entertainment Group Ltd | $0.965 | -0.52% |
