News | Market Wraps
Evening Wrap: ASX 200 enjoys another Trump relief rally, but it could be game over for gold and gold stocks
The S&P/ASX 200 closed 103.8 points higher, up 1.33%.

Mentioned
The S&P/ASX 200 closed 103.8 points higher, up 1.33%.
Ecstasy to agony. Gold stocks have surged for months, culminating in yesterday's melt-up – but were absolutely smashed today – down around 10% on average as the gold price reversed on yet another about-face from the Trump administration.
But it could also be argued there was also plenty of agony to ecstasy going on today, too. Uranium, lithium and battery minerals stocks, as well as Technology stocks soared – reversing their respective recent dismal performances.
Uranium stocks were particularly interesting, as a combination of better than expected quarterly results and a spate of substantial shareholder notices showing Sprott Inc. has been buying the dip in the beaten down sector, ignited rockets under Paladin Energy (PDN) (+24.6%), Boss Energy (BOE) (+9.7%), Deep Yellow (DYL) (+12.0%) and Bannerman Energy (BMN) (+11.1%).
To make sense of all the above, I have detailed technical analysis on the Nasdaq Composite, S&P/ASX 200, Gold, and the S&P/ASX All Ordinaries Gold Sub Index in today's ChartWatch.
Be sure to click/scroll through for the usual reporting of the major sector and stock-specific moves, the broker responses to them, as well as all the key upcoming economic data in tonight's Evening Wrap.
Let's dive in!
Today in Review
Wed 23 Apr 25, 5:06pm (AEST)
Name | Value | % Chg |
|---|---|---|
Major Indices | ||
| ASX 200 | 7,920.5 | +1.33% |
| All Ords | 8,125.2 | +1.39% |
| Small Ords | 2,965.3 | +0.01% |
| All Tech | 3,380.3 | +3.53% |
| Emerging Companies | 2,162.1 | +0.38% |
Currency | ||
| AUD/USD | 0.6424 | +0.92% |
US Futures | ||
| S&P 500 | 5,402.5 | +1.65% |
| Dow Jones | 39,842.0 | +1.23% |
| Nasdaq | 18,740.75 | +1.94% |
Name | Value | % Chg |
|---|---|---|
Sector | ||
| Energy | 7,125.5 | +4.47% |
| Information Technology | 2,286.4 | +3.88% |
| Industrials | 7,804.9 | +2.45% |
| Consumer Discretionary | 3,859.9 | +2.34% |
| Health Care | 39,744.3 | +2.22% |
| Real Estate | 3,552.0 | +2.08% |
| Utilities | 9,057.3 | +1.37% |
| Communication Services | 1,698.7 | +1.23% |
| Financials | 8,559.4 | +0.81% |
| Consumer Staples | 12,295.2 | +0.45% |
| Materials | 15,839.9 | +0.02% |
Markets
%20intraday%20chart%2023%20April%202025.png)
ASX 200 Session Chart
The S&P/ASX 200 (XJO) finished 103.8 points higher at 7,920.5, 1.33% from its session low, but a far from ideal 0.52% from its high. In the broader-based S&P/ASX 300 (XKO), advancers beat decliners by a healthy 243 to 41.
Markets have rallied for two major reasons:
Trump administration dialling down of tough China trade rhetoric, including media reports of a closed-door meeting hosted by JPMorgan* during which Treasury Secretary Bessent is purported to have made comments that the standoff with China is "not sustainable" and that he expects "de-escalation"; President Trump also said his administration would be "very nice" to China.
President Trump himself did his own dialling down of his position regarding Federal Reserve Chairman Jerome Powell. “Never did”, the President said, “I have no intention of firing him”. This is of course at odds with his comments at an Oval Office press conference on Friday which I brought to your attention in yesterday’s Wrap – the quote of which I took directly from here:
So, unless PBS is in the business of using AI to alter the President’s words, I suggest his new comments aren’t quite consistent with the theme of his previous comments (was that delicately enough put? 🤔).
Arguably, President Trump had a word or two whispered into his ear (again!) about what those earlier comments were doing to the bond market – increasingly his real nemesis in this spiralling saga and not the Chinese. So, that’s twice in a couple of weeks we’ve seen markets swing wildly on flip-flopping comments of the leader of the free world and or his cronies.
Ratchet up the rhetoric and policy attacks on a topic…then back away from them when they turn out to have unintended, unforeseen, and adverse impacts...
It’s a little frustrating for traders of my persuasion – i.e., the ones who like to follow trends. No doubt, however, my swing trading cousins are having a ball in this market! Good luck to them (as shuffles his position on top of his hands)!
*"If you're not in the inside, you're on the outside", Gordon Gekko, 1987.
ChartWatch
NASDAQ Composite Index

Flip a coin! 🪙 (click here for full size image)
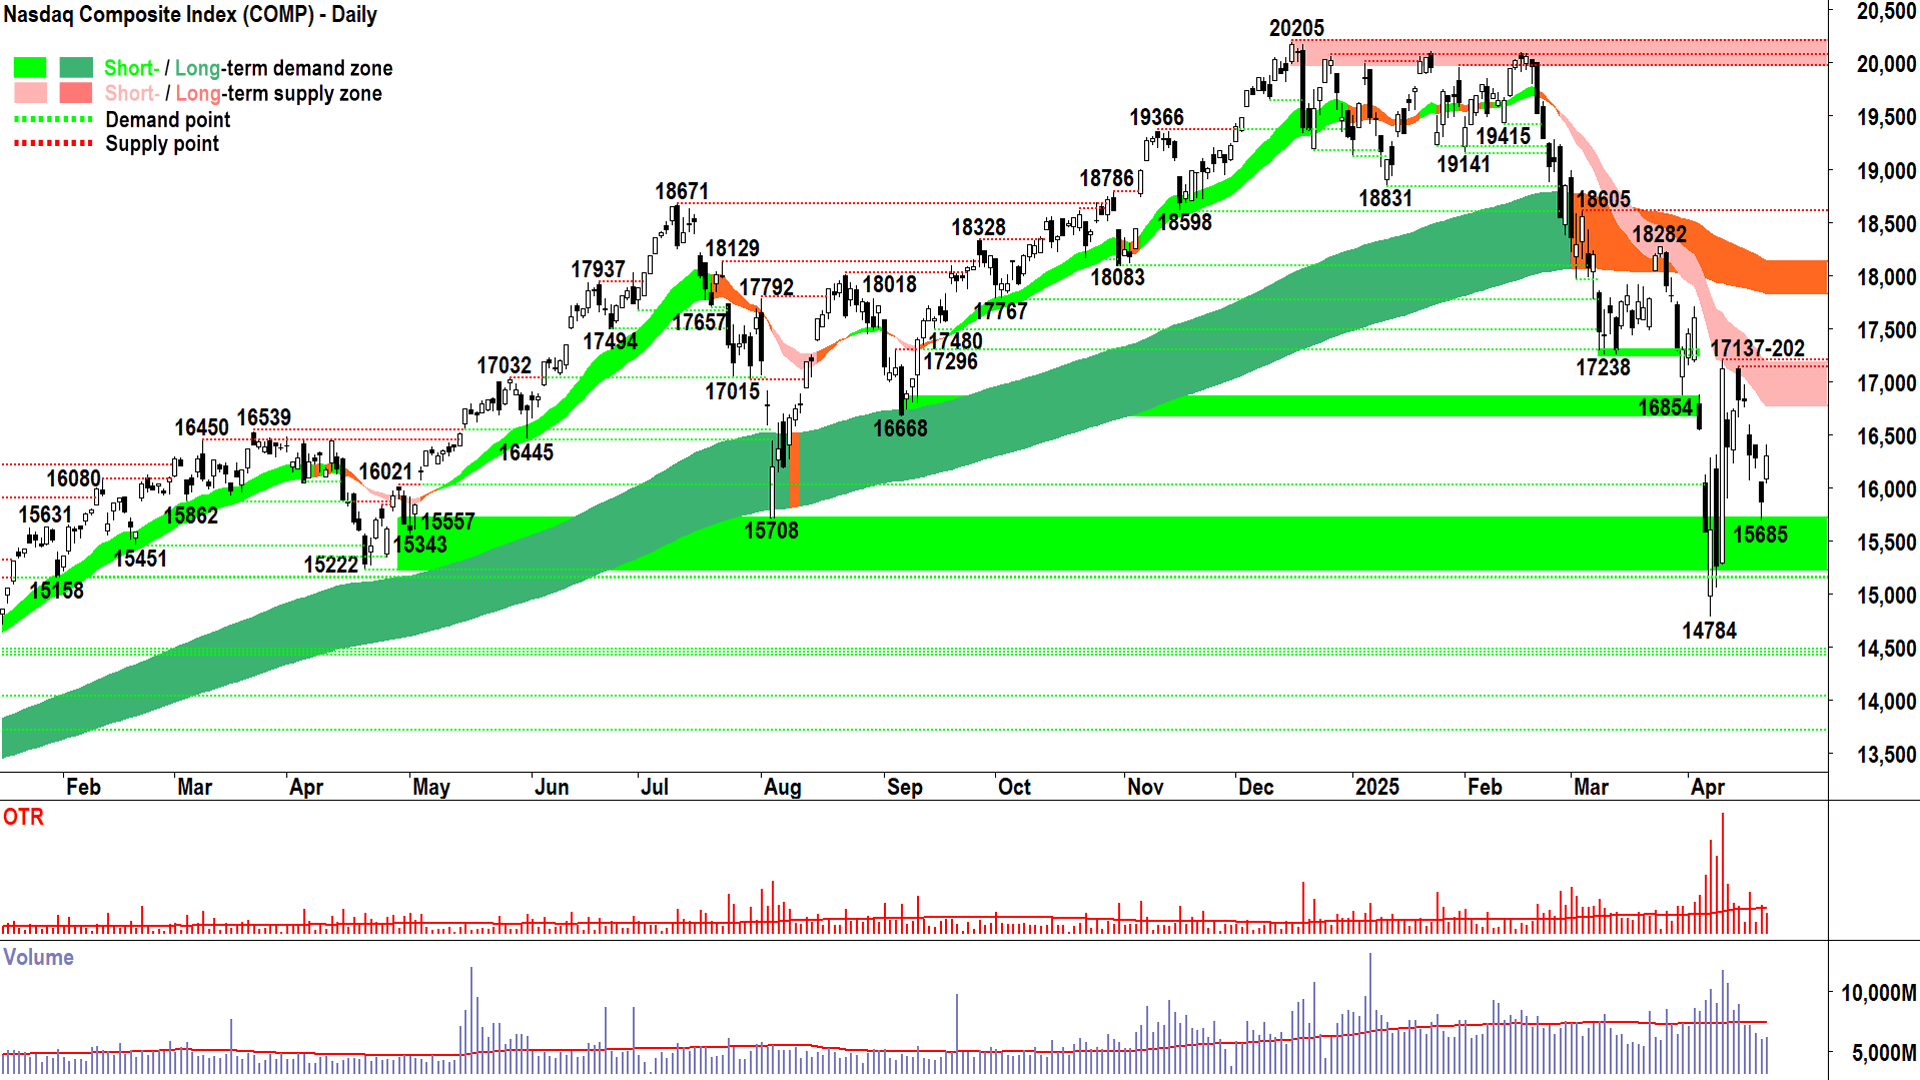
The Comp’s 3-day fighting retreat turned into a tentative advance on Tuesday, if only resulting in it regaining Monday’s sharp decline.
Still, Tuesday’s price action does two things:
It confirms my suspicion that we’re in more of a short term equilibrium phase rather than an all-out supply-side control phase as is suggested by the dominant short term downtrend ribbon (I note the long white body / volatility and volume of the 9-April “Trump about-face” candle – a monster that simply cannot be ignored!)
It sets an important higher trough to 14784 – demonstrating potentially rising demand levels
Even so (that last point), nothing much has really changed for the Comp:
The short term downtrend ribbon remains the dominant short term zone of supply (dynamic), kicking in around 16765-17175. Neutral / equilibrium is the go until the Comp closes above this zone.
15685 is a new and interesting point of demand. A close below it deals a major blow to the demand-side and will embolden the supply-side.
Compression within the 15685-17175 area would not be surprising.
A follow-through higher open tonight wouldn’t surprise me at all, but as always…opens are irrelevant and closes are everything! A close near the session high likely sets the Comp up for a test of the short term downtrend ribbon versus a close near the session low likely sets it up for a test of 15685.
Honestly – I have no idea which of those two scenarios is going to play out. It's that kind of market. Flip a coin! 🪙
S&P/ASX 200 (XJO)
%20chart%2023%20April%202025.png)
Things are looking up for the XJO! (click here for full size image)
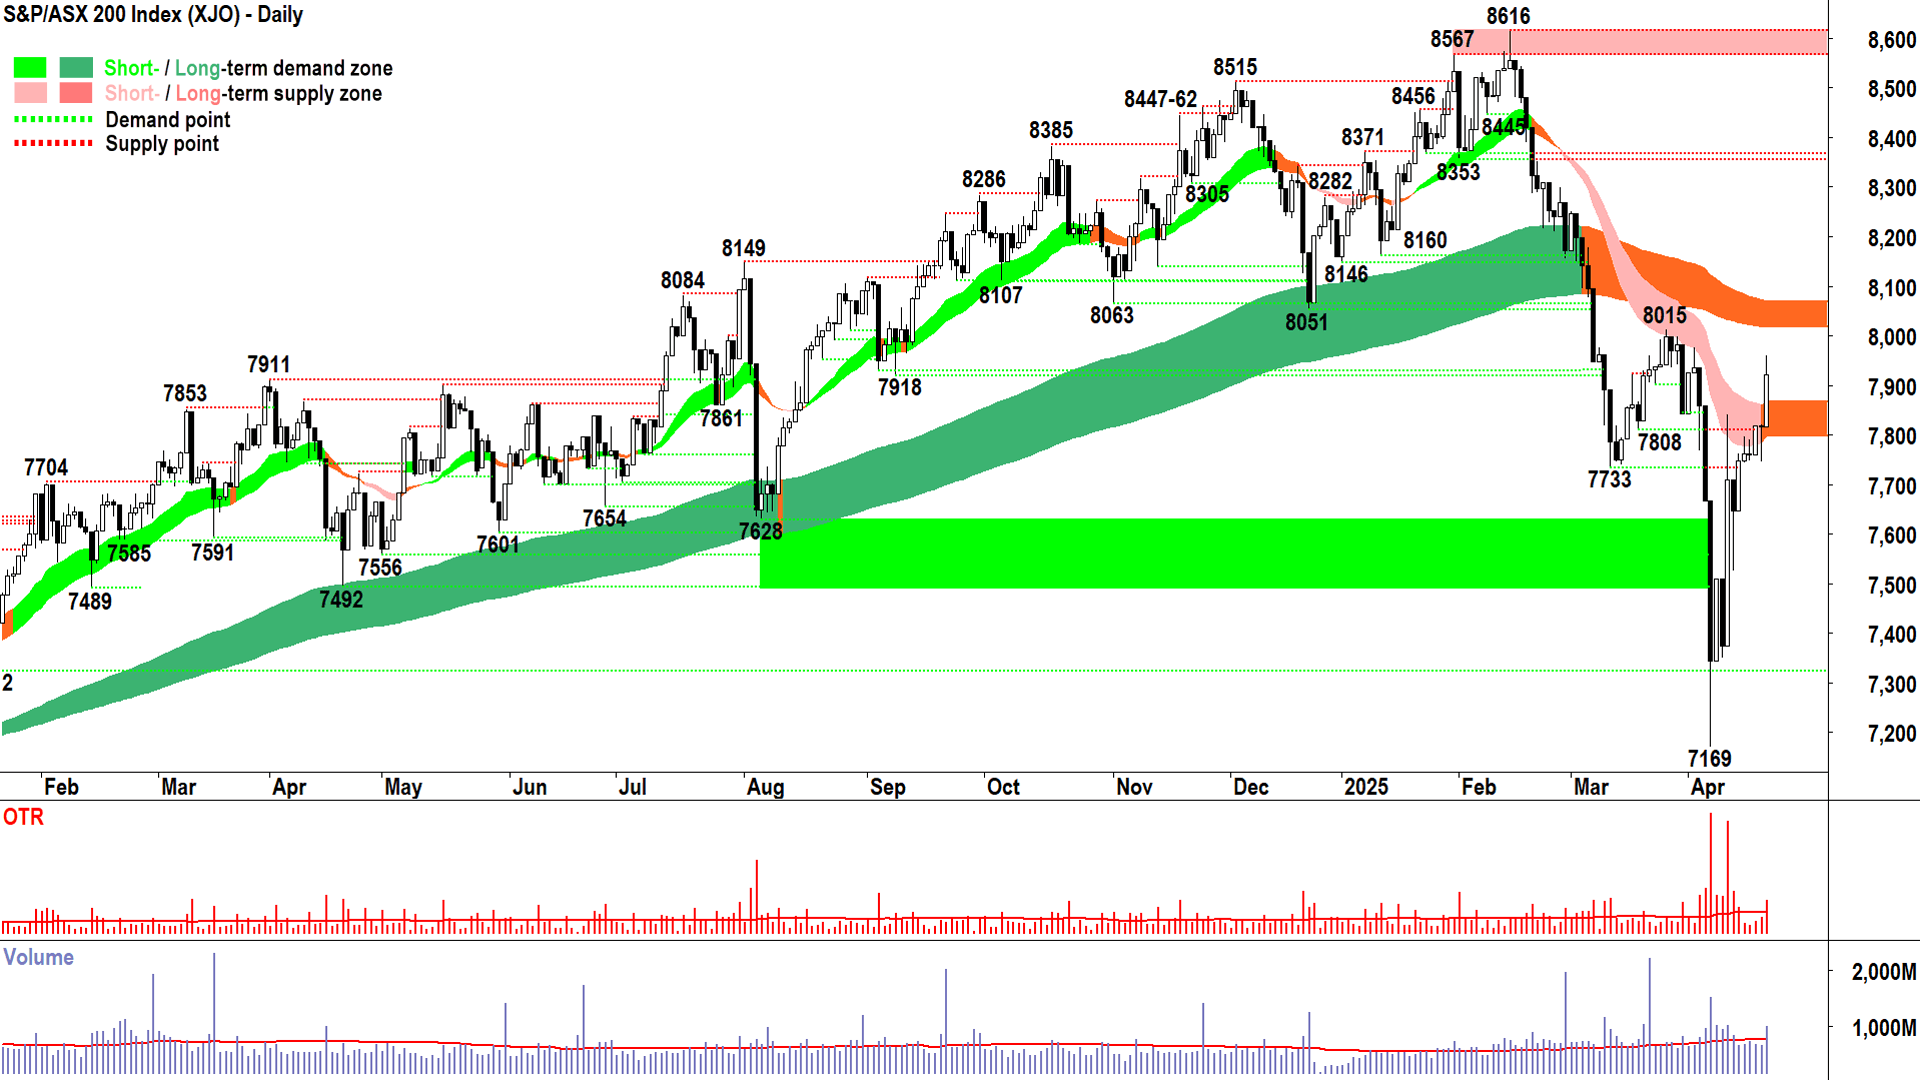
The XJO’s technicals are far clearer – but we had more than just an inkling that today’s gain was brewing over the last few trading sessions – as it grew increasingly apparent that we were breaking our link to US markets.
How convincing was today’s performance, though? 🤔
The headlines show a 1.3% gain, yet I can’t help but focus on that 0.52% upward pointing shadow which suggests not everyone was totally on board with today’s gains.
But then I consider, there was a great deal of buying in the face of adversity over the last two sessions – and no doubt those smarty pants took some well-earned profits into the liquidity provided by the Jonnies-come-lately today.
I know I would have. Just a bit. And then patted myself on the back for being so clever! 😁
No, I’m going to make myself focus on the positives of today’s price action, and (looking down the chart to those blue vertical bars at the bottom) on it’s more than decent volume.
Don’t forget that just as much of that volume is supply as it is demand – there has to be a buyer and seller for each share. But we can say that for the most part, the demand-side was more motivated than the supply-side today, and that is borne out in the white-bodied candle.
…Which closed above the short term downtrend ribbon, mind you – no mean feat...Plus, add in the fact that the short term trend ribbon has neutralised – we are officially now in an equilibrium market – totally balanced.
Given that last point, perhaps so that we can be sure of today’s demand-side signal, we’d better wait for another candle to confirm today’s – a proper-close-smack-bang-on-the-high affair (should the market gods consider us worth of such certainty! 🙏)
Let us all agree on at least this until then: Things are looking up for the XJO!
Gold Futures (Front month, back-adjusted) COMEX
%20COMEX%20chart%2023%20April%202025.png)
What Trump giveth, Trump taketh away (when he's forced to back-flip!) (click here for full size image)
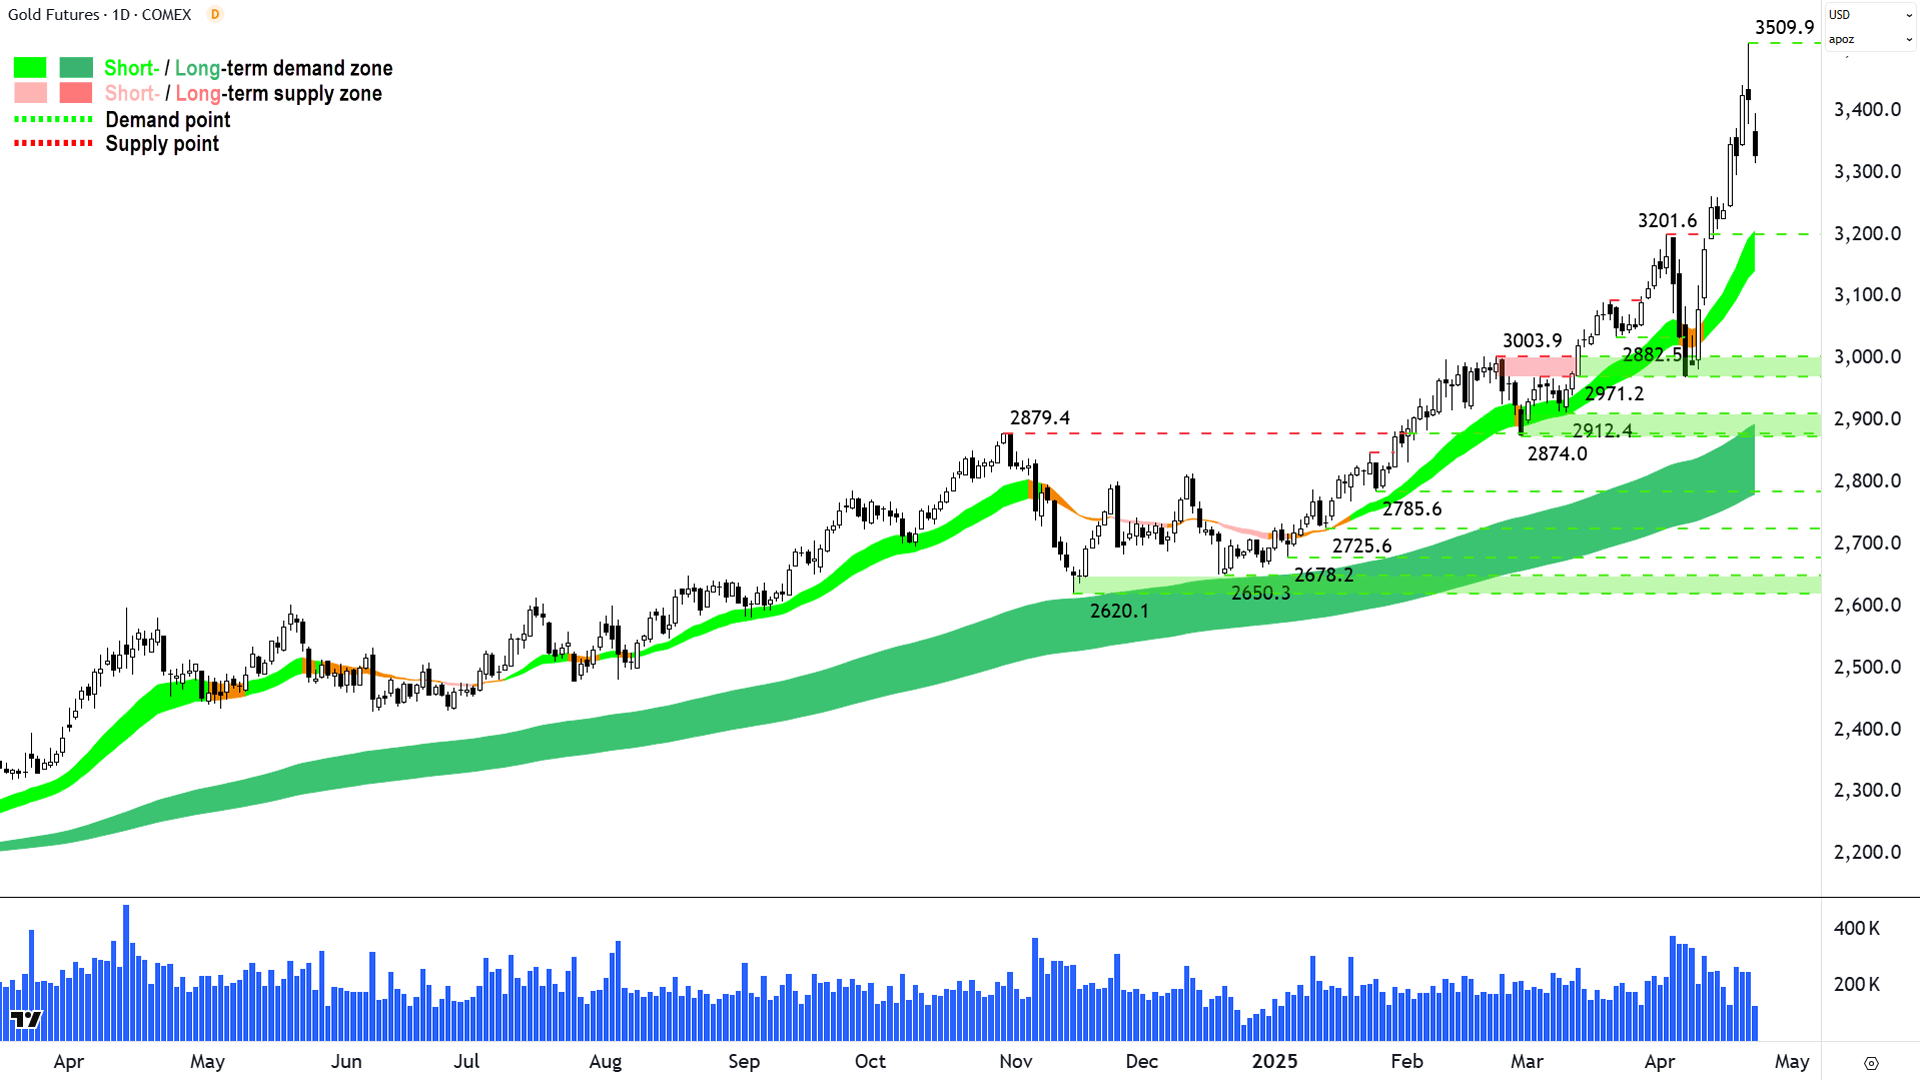
Ecstasy to agony. Welcome to the new reality traders. Gold stocks got smashed today.
There was an acute disparity in the flow of capital heading into gold compared to those wishing to sell it about 24 hours ago – and the opposite today.
Blame whoever you like – it won’t make a lick of difference. The price is all that matters.
It does, however, highlight the importance of limiting overall exposure in the present market environment.
US risk-free bonds rallied overnight and are continuing to rally today – and that spells a bit of a “game over” moment for the short term uptrend in gold.
Note that the above chart shows today’s live candle, so Tuesday’s long upper shadow is the second last from right.
If today’s candle closes here or worse, together with Tuesday’s candle it will constitute a credible supply-side showing and warrant a reduction in risk exposure to gold’s prevailing short and long term uptrends.
Bigger picture, those trends remain very much intact, however, and we’ll check the price action at the short term uptrend ribbon for confirmation the demand-side stands ready to buy the dip.
For now, it seems both uptrends / downtrend and topping / bottoming processes are playing out faster than usual – because the fundamental news events that are driving them are playing out faster than usual.

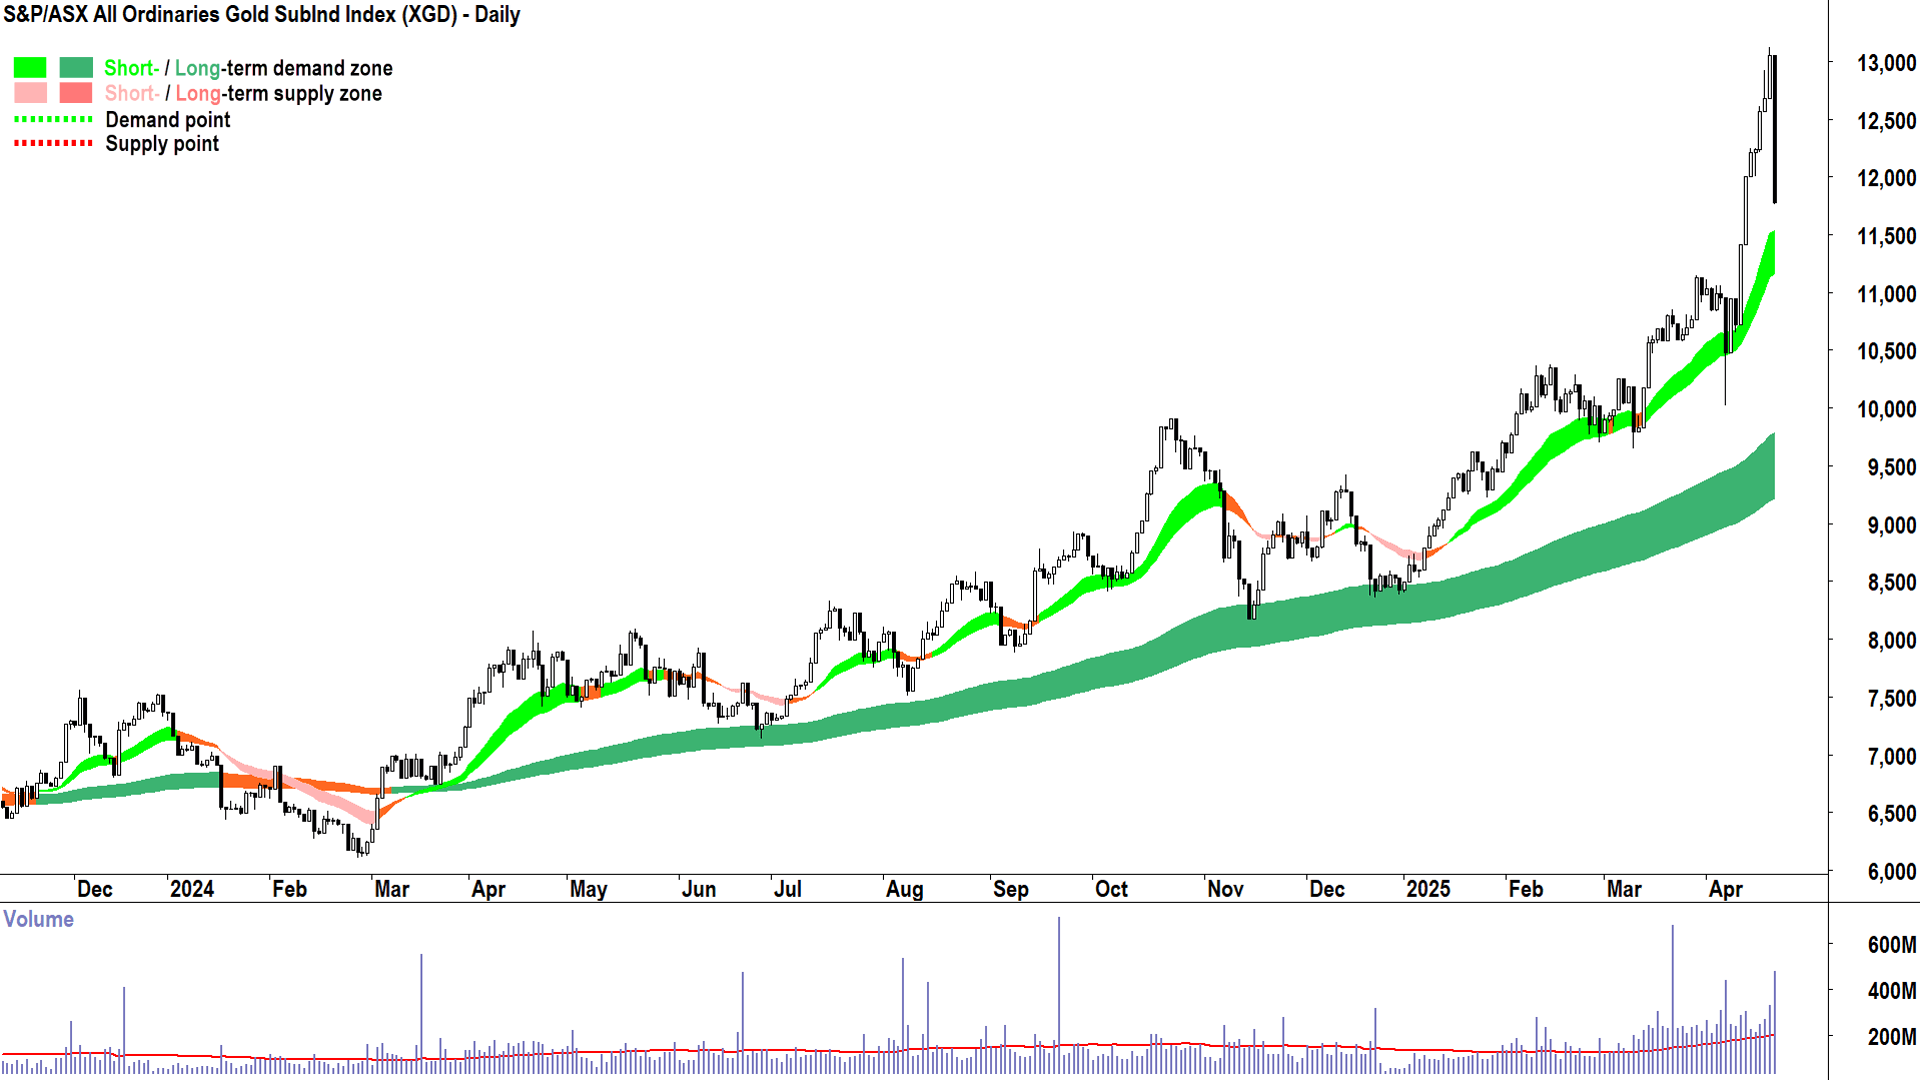
S&P/ASX All Ordinaries Gold SubInd Index (click here for full size image)
As for ASX gold stocks, the signal is far clearer. I call the candle logged today a “species ending event”. Long. Black. Close at low. Dinosaurs and meteor kind of stuff. 🦕🌠
Based on my experience, a great deal of latent supply just got created in the market for ASX gold stocks – latent supply that will take a great deal of time and demand to shift.
Economy
Today
AUS Flash Purchasing Managers Index (PMI) April
Manufacturing PMI: 51.7 vs 52.1 in March (revised down from 52.6)
Services PMI: 51.4 vs 51.6 in March (revised up from 51.2)
PMI readings above 50 indicate growth in the sector, so Aussie manufacturing and services sectors both grew in April, but at a slower rate than they did in March. March manufacturing activity also revised lower, but services revised up by about the same amount. Readings are consistent with moderate growth in the Australian economy.
Later this week
Wednesday
21:45 USA Flash Purchasing Managers Index (PMI) April
Manufacturing PMI: 49.0 forecast vs 50.2 previous
Services PMI: 52.8 forecast vs 54.4 previous
22:00 USA New Home Sales March (682,000 forecast vs 676,000 in February)
Thursday
20:30 USA Core Durable Goods Orders March (+0.3% m/m forecast vs +0.7% m/m in February)
22:00 USA Existing Home Sales March (4.14 million forecast vs 4.26 million in February)
Friday
All day AUS ANZAC Day Public Holiday
Latest News
Interesting Movers
Trading higher
+24.6% Paladin Energy (PDN) – March 2025 Quarter Presentation, general strength across the broader Uranium sector today (apart from the quarterly results, the whole ASX uranium sector was buoyed by series of substantial shareholder notices showing substantial Sprott Inc. buying 🚀).
+15.2% Clarity Pharmaceuticals (CU6) – No news.
+12.5% Telix Pharmaceuticals (TLX) – Telix Reports US$186M Q1 Revenue, Up 62% YOY, rise is consistent with prevailing long term uptrend 🔎📈
+12.0% Deep Yellow (DYL) – Change in substantial holding (Sprott Inc. increase), general strength across the broader Uranium sector today.
+11.2% BetaShares Crypto Innovators ETF (CRYP) – No news, big rally in major cryptos overnight.
+11.1% Bannerman Energy (BMN) – Change in substantial holding (Sprott Inc. increase), general strength across the broader Uranium sector today.
+9.8% Liontown Resources (LTR) – No news 🤔, general strength across the broader Lithium sector today (nothing specific for lithium that I could find - but potentially partly due to easing trade tensions - however, more likely vigorous short covering sparked by uranium cousins' rally!).
+9.7% Appen (APX) – No news, general strength across the broader Information Technology sector today.
+9.7% Boss Energy (BOE) – Continued Wellfield Expansion at Alta Mesa Uranium Project and Change in substantial holding (Sprott Inc. increase), general strength across the broader Uranium sector today.
+9.6% Global X Ultra Long Nasdaq-100 Hedge Fund ETF (LNAS) – No news, long Nasdaq ETF.
+9.6% BetaShares Geared US Equity Fund Currency Hedged ETF (GGUS) – No news, long US stocks ETF.
+8.9% Novonix (NVX) – No news, general strength across the broader Battery Materials sector today, (likely ditto LTR & co.)
Trading lower
-24.4% Cettire (CTT) – Q3 FY25 Trading & Market Update, fall is consistent with prevailing short and long term downtrends, one of the most Featured (highest conviction) stocks in ChartWatch ASX Scans Downtrends list 🔎📉
-15.5% Ora Banda Mining (OBM) – No news, general weakness across the broader Gold sector today.
-14.6% Ramelius Resources (RMS) – No news, general weakness across the broader Gold sector today.
-13.3% Koonenberry Gold (KNB) – Multiple zones of visible gold in fifth drill hole at Enmore, general weakness across the broader Gold sector today.
-11.9% Emerald Resources (EMR) – No news, general weakness across the broader Gold sector today.
-11.7% Genesis Minerals (GMD) – No news, general weakness across the broader Gold sector today.
-11.4% Capricorn Metals (CMM) – No news, general weakness across the broader Gold sector today.
-11.3% St Barbara (SBM) – No news, general weakness across the broader Gold sector today.
-11.1% Vault Minerals (VAU) – No news, general weakness across the broader Gold sector today.
-10.9% Evolution Mining (EVN) – Change in substantial holding (FIL reduction), general weakness across the broader Gold sector today.
-10.9% Alkane Resources (ALK) – No news, general weakness across the broader Gold sector today.
-10.9% West African Resources (WAF) – No news, general weakness across the broader Gold sector today.
-10.0% Regis Resources (RRL) – No news, general weakness across the broader Gold sector today.
-9.9% De Grey Mining (DEG) – Scheme becomes Effective, general weakness across the broader Gold sector today.
-9.8% Black Cat Syndicate (BC8) – No news, general weakness across the broader Gold sector today.
-9.6% Northern Star Resources (NST) – Scheme becomes Effective, general weakness across the broader Gold sector today.
-8.9% Resolute Mining (RSG) – No news, general weakness across the broader Gold sector today.
Broker Moves
Alcidion Group (ALC)
Retained at buy at Bell Potter; Price Target: $0.110
Amcor (AMC)
Retained at hold at Ord Minnett; Price Target: $15.25
Challenger (CGF)
Retained at outperform at Macquarie; Price Target: $7.00 from $6.60
Droneshield (DRO)
Retained at buy at Shaw and Partners; Price Target: $1.200
Deep Yellow (DYL)
Retained at buy at Canaccord Genuity; Price Target: $1.610
Ikegps Group (IKE)
Retained at buy at Bell Potter; Price Target: $0.930
Retained at buy at Shaw and Partners; Price Target: $1.100
Imdex (IMD)
Retained at negative at Citi; Price Target: $2.85
Monadelphous Group (MND)
Retained at negative at Citi; Price Target: $16.65
Macquarie Group (MQG)
Retained at sell at Citi; Price Target: $177.00
Retained at underweight at Jarden; Price Target: $200.00
Retained at equal-weight at Morgan Stanley; Price Target: $191.00
Retained at accumulate at Ord Minnett; Price Target: $210.00
Northern Star Resources (NST)
Retained at outperform at Macquarie; Price Target: $27.00 from $20.00
NRW (NWH)
Retained at buy at Citi; Price Target: $3.85
Nextdc (NXT)
Retained at buy at Ord Minnett; Price Target: $18.00 from $20.00
Predictive Discovery (PDI)
Retained at buy at Canaccord Genuity; Price Target: $0.560
Perpetual (PPT)
Retained at negative at Macquarie; Price Target: $15.44 from $19.74
Perenti (PRN)
Retained at outperform at Macquarie; Price Target: $1.520 from $1.500
Rio Tinto (RIO)
Retained at equal-weight at Morgan Stanley; Price Target: $115.50
South32 (S32)
Retained at add at Morgans; Price Target: $4.30
Transurban Group (TCL)
Retained at equal-weight at Morgan Stanley; Price Target: $13.33
Tower (TWR)
Retained at outperform at Macquarie; Price Target: NZ$1.58 from NZ$1.55
Woodside Energy Group (WDS)
Retained at negative at Citi; Price Target: $21.50
Scans
Top Gainers
Code | Company | Last | % Chg |
|---|---|---|---|
| PPY | Papyrus Australia Ltd | $0.011 | +37.50% |
| RMY | Rma Global Ltd | $0.034 | +30.77% |
| CUS | Copper Search Ltd | $0.022 | +29.41% |
| PDN | Paladin Energy Ltd | $4.96 | +24.62% |
| GCM | Green Critical Minerals Ltd | $0.011 | +22.22% |
Top Fallers
Code | Company | Last | % Chg |
|---|---|---|---|
| CTT | Cettire Ltd | $0.495 | -24.43% |
| REE | RAREX Ltd | $0.03 | -21.05% |
| SPD | Southern Palladium Ltd | $0.23 | -19.30% |
| QEM | QEM Ltd | $0.045 | -18.18% |
| AGD | Austral Gold Ltd | $0.058 | -17.14% |
52 Week Highs
Code | Company | Last | % Chg |
|---|---|---|---|
| MPW | Metal Powder Works Ltd | $0.49 | +8.89% |
| COG | COG Financial Services Ltd | $1.39 | +7.75% |
| CAF | Centrepoint Alliance Ltd | $0.35 | +6.06% |
| HCT | Holista Colltech Ltd | $0.044 | +4.76% |
| ASX | ASX Ltd | $69.89 | +3.43% |
52 Week Lows
Code | Company | Last | % Chg |
|---|---|---|---|
| CTT | Cettire Ltd | $0.495 | -24.43% |
| SPD | Southern Palladium Ltd | $0.23 | -19.30% |
| RIM | Rimfire Pacific Mining Ltd | $0.02 | -13.04% |
| NGX | NGX Ltd | $0.11 | -12.00% |
| ASQ | Australian Silica Quartz Group Ltd | $0.015 | -11.77% |
Near Highs
Code | Company | Last | % Chg |
|---|---|---|---|
| BILL | Ishares Core Cash ETF | $100.68 | +0.04% |
| GLDN | Ishares Physical Gold ETF | $41.18 | -4.87% |
| GXLD | Global X Gold Bullion ETF | $51.59 | -4.89% |
| AYUPA | Australian Unity Ltd | $82.00 | -0.30% |
| RGN | Region Group | $2.25 | +0.45% |
Relative Strength Index (RSI) Oversold
Code | Company | Last | % Chg |
|---|---|---|---|
| NXL | NUIX Ltd | $2.35 | +3.52% |
| WAA | Wam Active Ltd | $0.775 | -2.52% |
| CRN | Coronado Global Resources Inc | $0.235 | +6.82% |
| HMC | HMC Capital Ltd | $4.60 | +4.31% |
| TNC | True North Copper Ltd | $0.195 | -2.50% |
