News | Market Wraps
Evening Wrap: ASX 200 golden run continues as investors pile back into gold stocks big and small
The S&P/ASX 200 closed 6.4 points lower, down 0.08%.

Mentioned
The S&P/ASX 200 closed 6.4 points lower, down 0.08%.
Aussie investors' love affair with gold stocks continued today, well more than continued, it ramped up to a completely other level! The gain was 4.3%, but on an individual stock basis, some favourites saw double digit improvements (e.g. Pantoro (PNR) (+11.8%), Resolute Mining (RSG) (+10.9%), and Larvotto Resources (LRV) (+10.2%).
The modest blip lower in the benchmark ASX 200 hid what was a largely positive day, with 7 out of the 11 major sectors up on the day. Real Estate (XPJ) (+0.81), Energy (XEJ) (+0.81%), and Resources (XJR) (+0.69) enjoyed the best gains.
Lagging the pack, was the Healthcare sector (XHJ) (-1.9%) which saw substantial falls among its major constituents. Sigma Healthcare (SIG) was worst off, dumping 13.5% after it delivered its first trading update post its Chemist Warehouse merger. Elsewhere, Telix Pharmaceuticals (TLX) (3.8%), CSL (CSL) (-2.5%) and serial underperformer Ramsay Health Care (RHC) (-2.4%) also saw heavy falls.
Not helping on the index points side of things, all four the big banks were also lower today, with yesterday's disappointing half hear result from Westpac Banking Corp. (WBC) (-2.0%) still weighing on the sector.
To make sense of all the above, I have detailed technical analysis on the Nasdaq Composite, S&P/ASX 200, and Gold in today's ChartWatch.
Be sure to click/scroll through for the usual reporting of the major sector and stock-specific moves, the broker responses to them, as well as all the key upcoming economic data in tonight's Evening Wrap.
Let's dive in!
Today in Review
Tue 06 May 25, 5:01pm (AEST)
Name | Value | % Chg |
|---|---|---|
Major Indices | ||
| ASX 200 | 8,151.4 | -0.08% |
| All Ords | 8,369.3 | -0.06% |
| Small Ords | 3,090.9 | +1.06% |
| All Tech | 3,578.8 | +0.83% |
| Emerging Companies | 2,260.4 | +1.39% |
Currency | ||
| AUD/USD | 0.6464 | 0.00% |
Sector | ||
| Energy | 7,217.0 | +0.81% |
| Real Estate | 3,773.7 | +0.78% |
| Materials | 16,105.8 | +0.62% |
Name | Value | % Chg |
|---|---|---|
Sector | ||
| Utilities | 9,364.4 | +0.58% |
| Communication Services | 1,740.8 | +0.57% |
| Consumer Discretionary | 4,042.2 | +0.57% |
| Information Technology | 2,498.3 | +0.30% |
| Industrials | 7,993.0 | -0.20% |
| Financials | 8,728.3 | -0.42% |
| Consumer Staples | 12,546.0 | -0.47% |
| Health Care | 41,534.0 | -1.86% |
Markets
%20intraday%20chart%206%20May%202025.png)
ASX 200 Session Chart
The S&P/ASX 200 (XJO) finished 6.4 points lower at 8,151.4, roughly mid-range, 0.16% from its session low and 0.21% from its high. Despite the subdued result in the benchmark, in the broader-based S&P/ASX 300 (XKO) advancers beat decliners by a healthy 169 to 103.
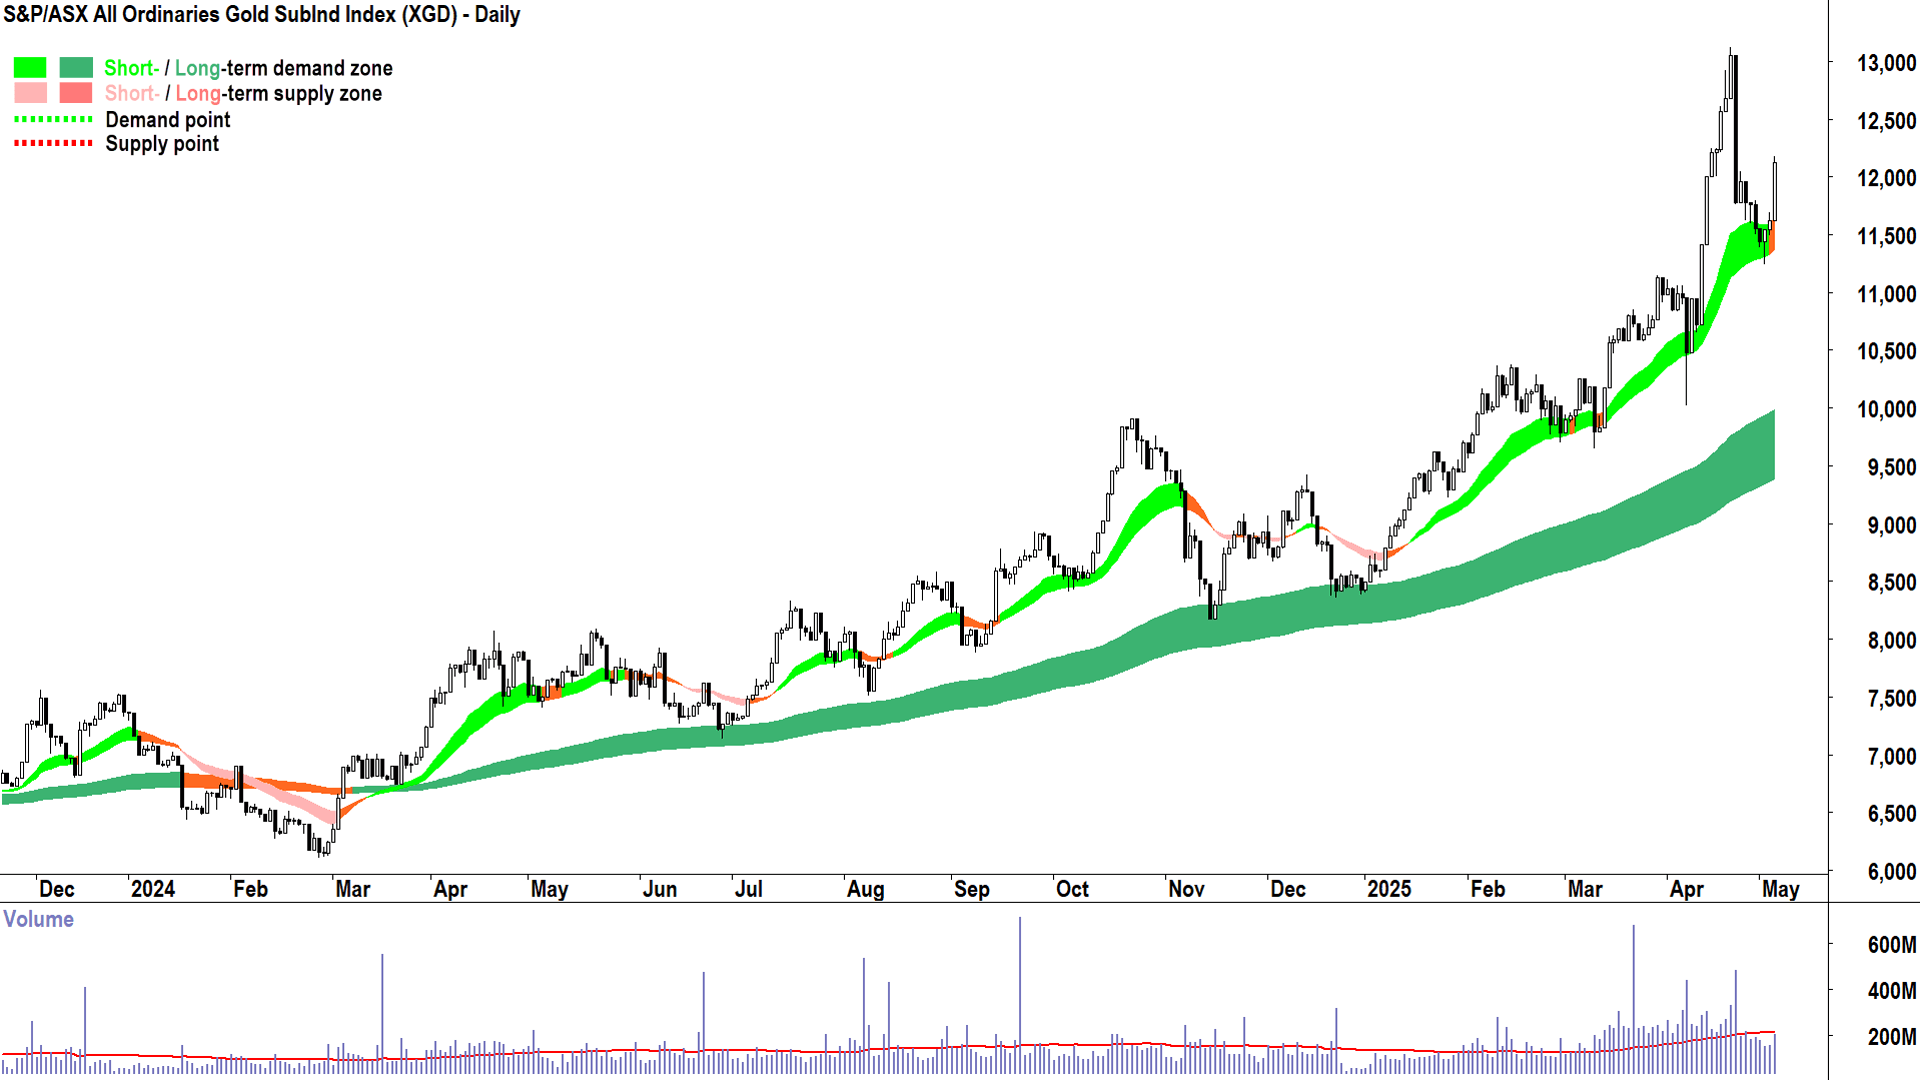
Gold is back in a big way. Some might argue it never went away, or more astutely, that nothing goes up in a straight line 📈.
The "breather", if you will, in the Gold Sub-Index (XGD) (+4.3%) arguably lasted 7 trading sessions post what remains (for me at least) a baffling massive supply-side event on 22 April.

S&P/ASX All Ordinaries Gold Sub-Index (XGD) (click here for full size image)
I've got the corresponding chart of Gold for you in tonight's ChartWatch, below, and whilst it does show a modest reversal on the 22 April candle – I propose the huge slump in Aussie gold stocks was substantially disproportionate.
This perhaps highlights the risks of dealing in high beta gold stocks. "High beta" simply means likely to deliver a bigger response up or down to a particular benchmark.
If you want steady and commensurate, go to gold directly or perhaps to gold ETFs. But it you want seat of your pants, with the possibility of outsized gains (while also tolerating outsized risk), then the ASX has no shortage of prospective gold stocks – big, small, and everything in between!
This section isn't ChartWatch, but might I say that the XGD chart doesn't look half-bad again. There's going to be a decent whack of supply as we approach those highs, however, so if you're in the ASX gold stocks game, you'll need to watch the candles from here closely 🔬.
ChartWatch
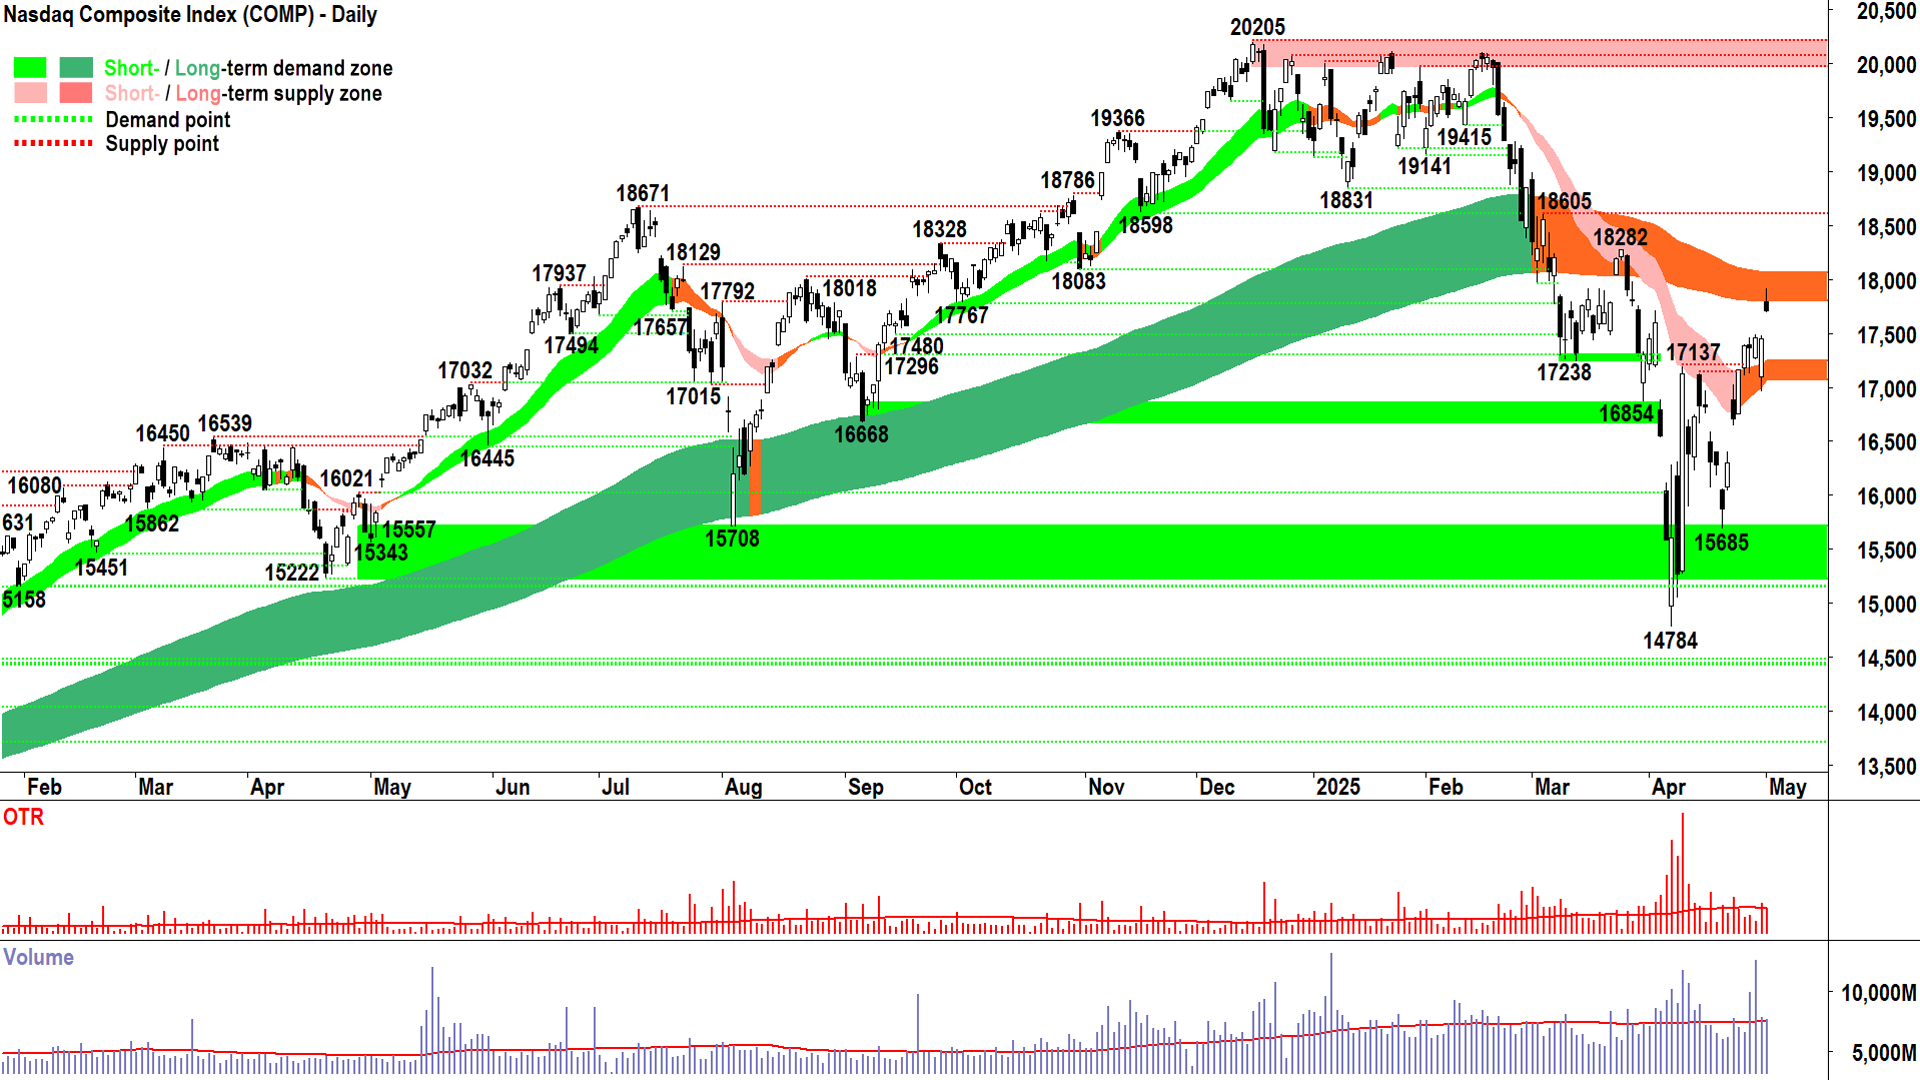
NASDAQ Composite Index

More candles please! 🧐 (click here for full size image)
Last night’s candle was all pretty consistent with what we were expecting – a potential signal of a growing equilibrium within the long term trend ribbon – a zone that is known for its excess demand-exerting properties!
The showing was mild, however, we still escaped with a white body, for example. Equilibrium doesn’t mean down, it means sideways. Sideways and then…
Could be up or down. It is a transition phase.
The candles will tell us which phase we’re about to transition to – and I honestly cannot rule out either possibility here – as in, I suspect they’re about 50-50.
50% we take out the newly formed 18049 point of supply and then take a look at 18605.
50% 18049 is reinforced with a credible supply-side showing and we retrace to test the demand I’d expect to kick in around 17500.
More candles please! 🧐
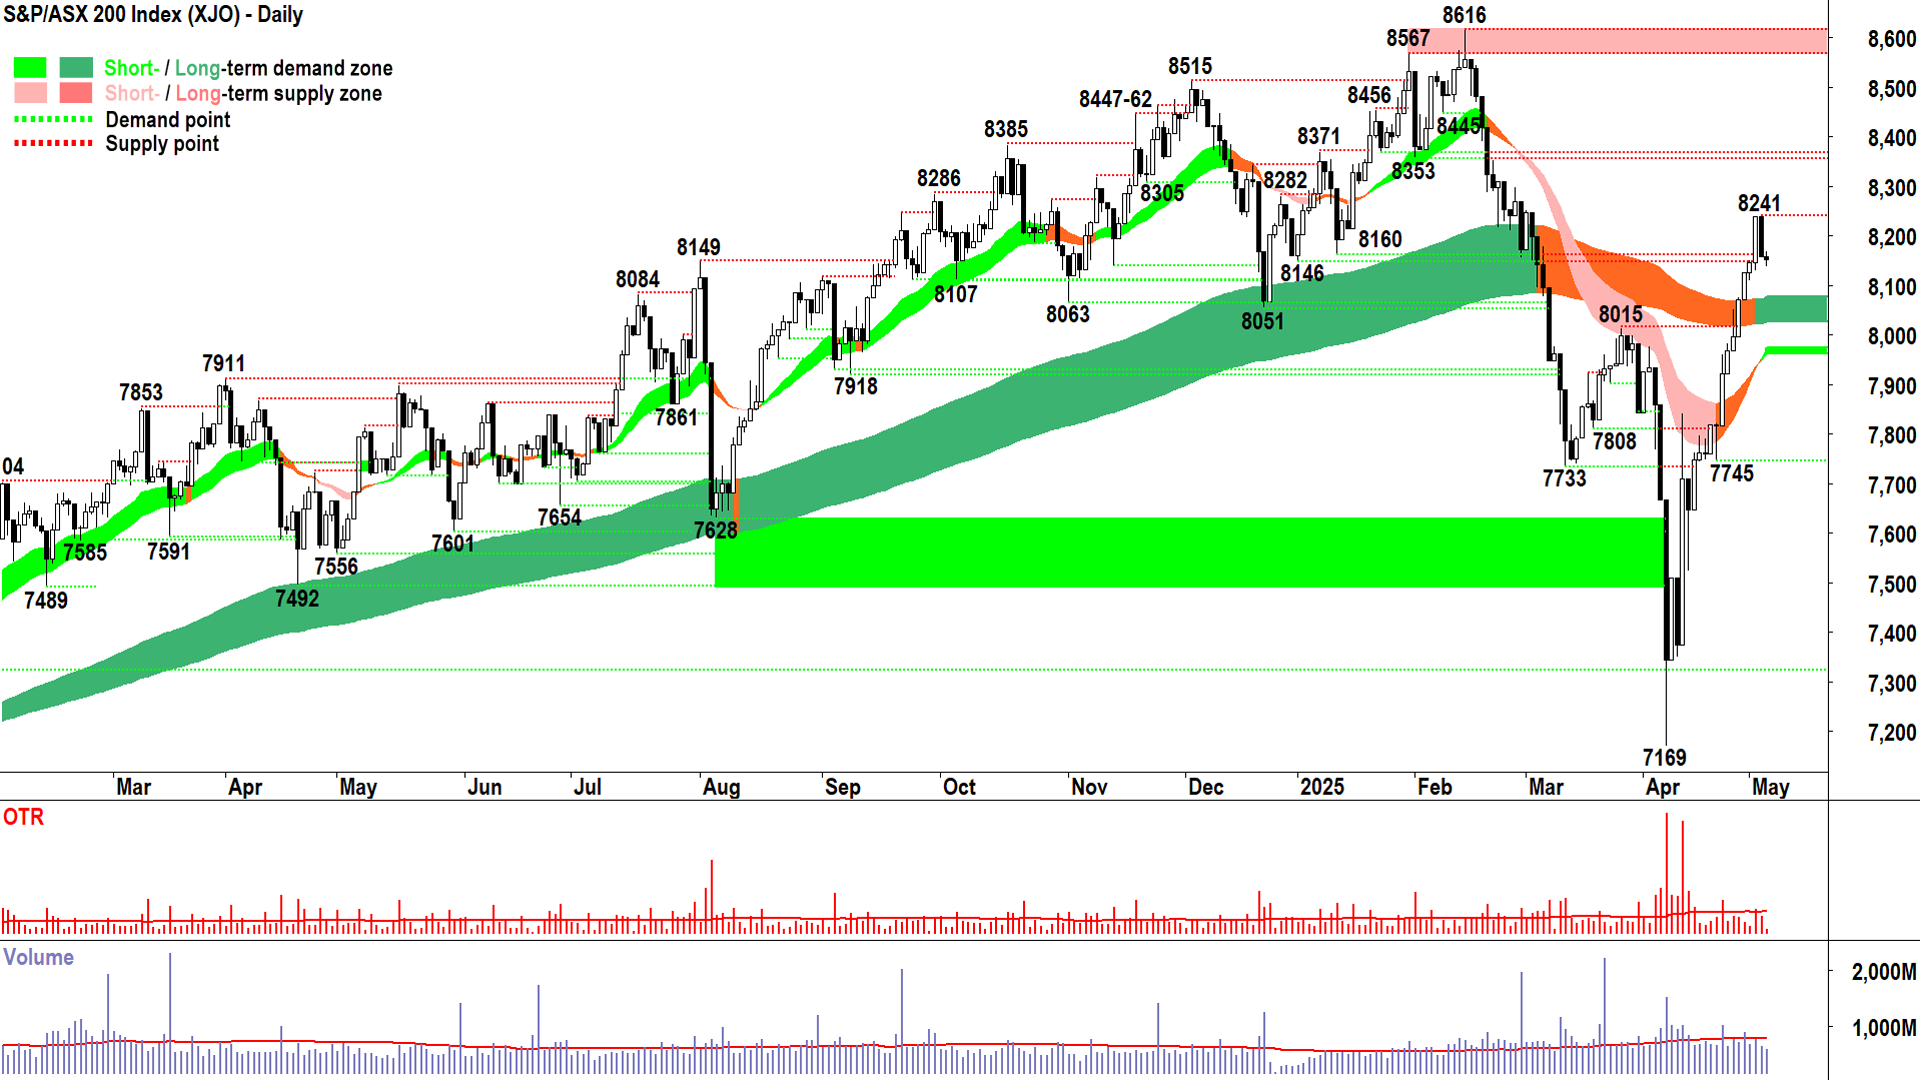
S&P/ASX 200 (XJO)
%20chart%206%20May%202025.png)
Trade what you see and not what you think 🧠 (click here for full size image)
Double green 🟩🟩
A term I haven’t been able to use to describe the short and long term trends on the XJO since 19 Feb. Considering the top of the bull market was 14 Feb, the fact that as soon as 20 Feb my trend following model had flagged something wasn’t quite right with the market is quite exceptional.
It goes to show that sometimes it’s better to simply trade what you see and not what you think – because at the time, I suspect few of us would have predicted what was about to follow that 19 Feb candle!
If you’ve been suffering through this part of the Evening Wrap for the last couple of weeks, you’d know that the appearance of some green on the short term trend ribbon doesn’t really change anything. This is because we had as soon as the 7745 candle on 22 Apr concluded that the demand-side had grappled control of the short term price action.
We made that assessment on price action (V-shaped rally) and candles (predominance of demand-side candles). This is because price action will always lead the lagging indicators that are my trend ribbons. But that doesn’t mean the trend ribbons are useless, on the contrary, sometimes it’s good to have a little lag built into our model so we don’t jump to conclusions too quickly!
To be fair, I trust you agree, the trend ribbons do more than just tell us the direction of the short and long term trends. Arguably their most important function is their tendency to behave as dynamic zones of excess demand and excess supply.
Mainstream technical analysts might refer to “excess demand" as “support” and “excess supply” as “resistance” – but I’ve never liked those terms (they make me cringe every time I hear them!).
This is because the terms support and resistance are too subjective, (consider “support” for someone who is long is “resistance” for someone who is short and vice versa), and the words themselves don’t tell us what’s actually happening in the demand-supply environment. Which is all that matters.
Think of it this way: Did the price hit a level and bounce because there was “support” there, or was it because that level was a point of excess demand? 🤔
Ok, I better get off my soap box or we’ll never get to the good bit! I’ve had several requests on how to apply my trend ribbons to your charts. You can see how I construct my trend ribbons in the Technical analysis for beginners: ChartWatch Primer. What I don’t share there, because I prefer to keep a few things under my hat, is the methodology for making the ribbons change colour.
For those who have a TradingView account, I have created my trend ribbons in an indicator that I can share with you. All you need to do is send your TradingView username to me via our Contact Us page (select "General Enquiry" and type "Carl's TV trend ribbons please!").
Your TradingView username can be found in your Profile, usually at the top left of your TradingView window (for example mine is “CarlCapolingua”). I will then give you to access to the indicator and you’ll be able to apply my trend ribbons directly to your charts 💪💪💪.
(If you don’t have a TradingView account, you can get a free subscription with very basic functionality but enough to be able to run my trend ribbons. If you do decide to take out a subscription, you may wish to use this referral code and we’ll both get a small bonus: Carl’s TradingView Referral Code)
Anyways, today’s candle – miniscule as it is – suggests the supply-side lacks motivation even after the huge increase in price over the past few weeks. It shows limited follow-through to yesterday’s credible supply-side showing.
As long as that concept continues – i.e., "little follow-through" – the greater likelihood it sinks in among market participants that prices aren’t going to retrace. The demand-side will grow more nervous they’re not going to get any further discounts, and this will force them to move back in to soak up current prices as best they can and get ahead of likely higher prices down the track.
The supply-side will grow more confident there’s no need to panic, that they can afford to hang on and see what more they might be able to extract from the demand-side.
The trend ribbons remain the key zones of dynamic demand here – now between 7960-8075. As long as the XJO continues to close above this zone, I can’t see any reason not to back the prevailing state of double-green.
From a portfolio management perspective, my model is now more comfortable moving back to a balanced capital allocation, which for me is 50-50 invested versus cash.
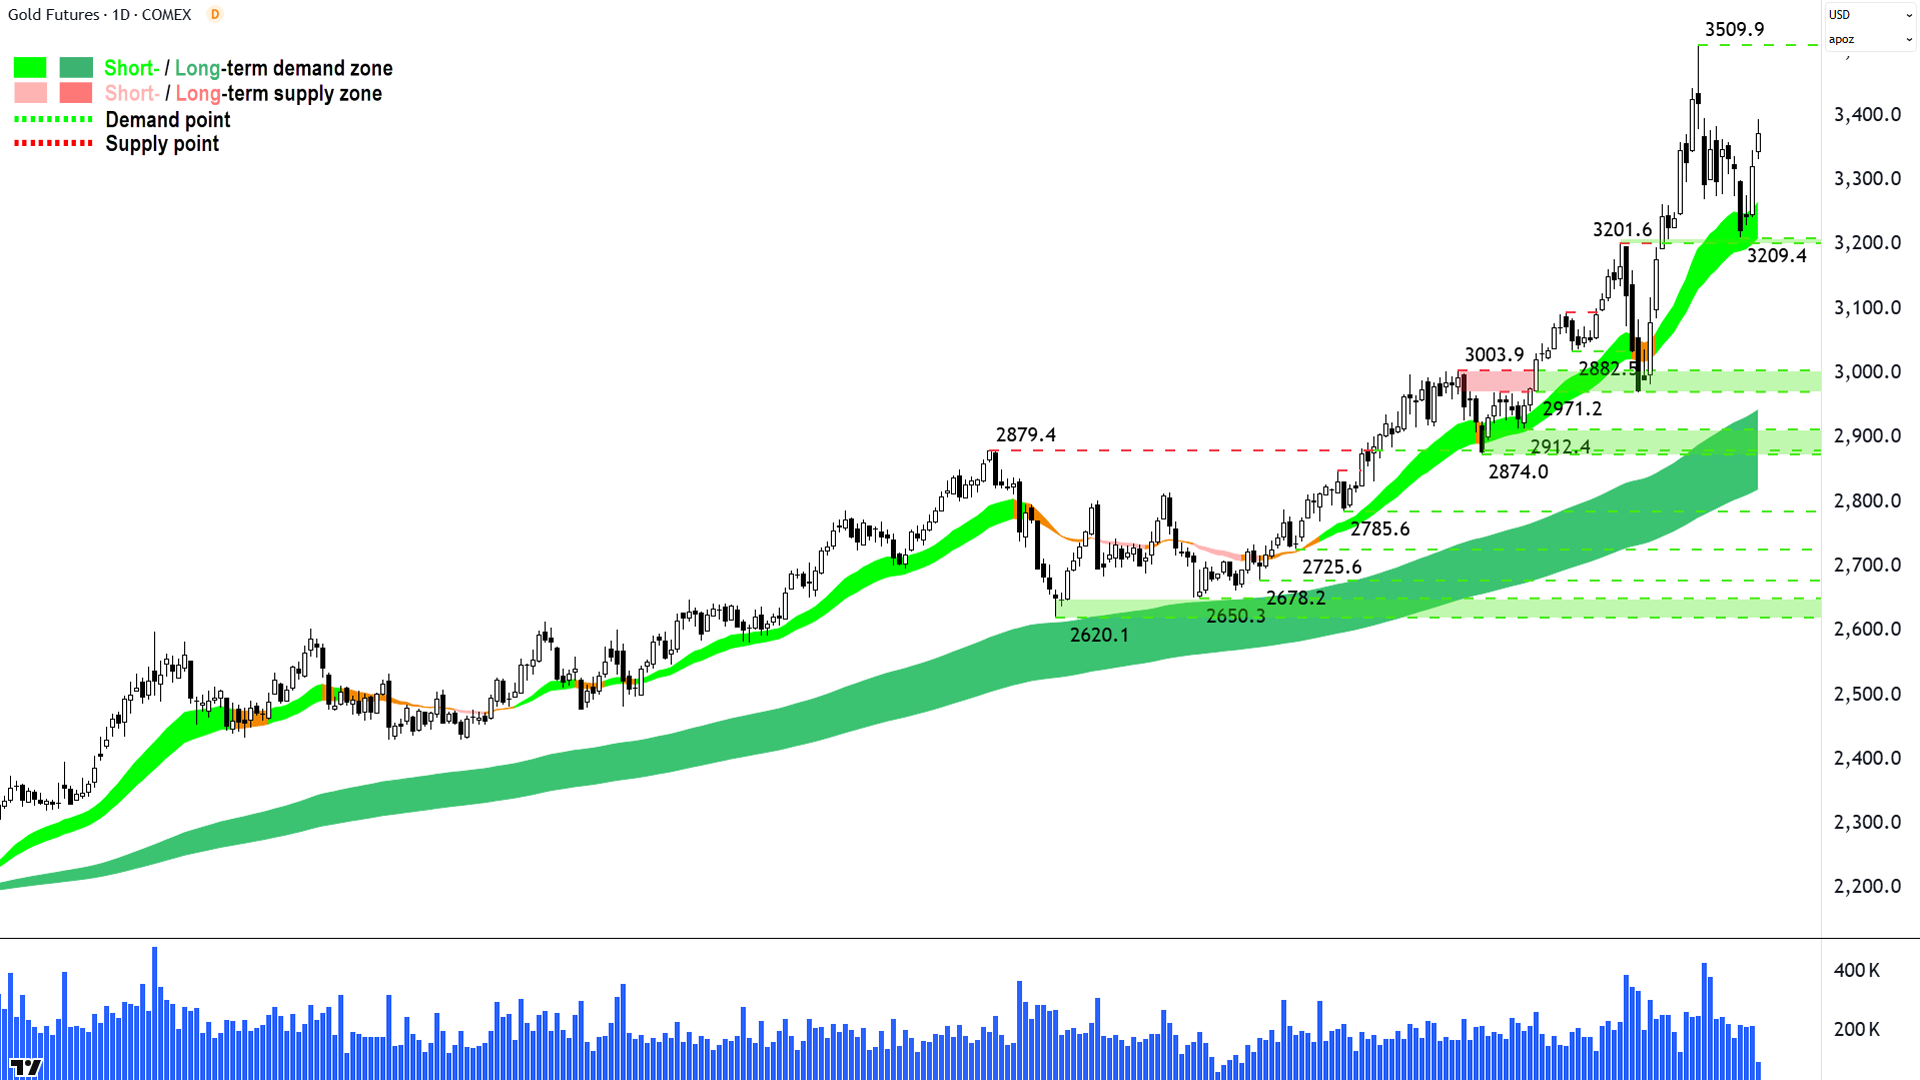
Gold Futures (Front month, back-adjusted) COMEX
%20COMEX%20chart%206%20May%202025.png)
Resumption of demand-side control (click here for full size image)
The last time we covered gold was in ChartWatch in the Evening Wrap on 23-Apr.
In that update, we had just observed the key reversal candle of 22-Apr and were (live at the time) beginning to confirm it with another credible supply-side showing.
My commentary was along the lines of: Short term risk reduction now required vs respecting the long term uptrend remained well and truly intact.
Fast forward a couple of weeks, and I think I kinda nailed it ✅.
The pullback terminated at the dynamic demand of the short term uptrend ribbon, and it looks like the demand-side has stepped back in with some force as per the 5-May white-bodied candle (it’s the second last on the chart if you’re wondering – because the last candle is today’s live candle).
Today’s candle is looking reasonably solid also, but we must discount it because it’s still live! Remember, only the close matters!
If we get a high-session close, it will confirm beyond doubt the resumption of the short term uptrend, and therefore likely set us up for a retest of the 3509.9 high.
Alternatively, if we end with a low close, back at session lows and therefore creating a telling long upward pointing shadow – it would suggest that the big money is selling this rally and not buying it.
In this scenario, we’ll likely confirm building supply in the system via a subsequent lower peak to 3509.9. If that occurs, I would be very inclined to call the beginning of a new equilibrium phase for gold.
For now, though, it’s still short term demand-side + long term demand-side control.
Economy
Today
AUS Building Approvals March m/m: -8.8% vs -1.7% m/m forecast and -0.3% in February (big miss, but a notoriously volatile data point!)
CHN Caixin Services PMI April: 50.7 vs 51.7 forecast and 51.9 in March (still growing, but at a slower rate)
Later this week
Wednesday
03:00 USA 10-y Bond Auction
Thursday
04:00 USA FOMC Meeting, Federal Funds Rate & Statement: no change at 4.5% forecast
04:30 USA FOMC Press Conference
21:00 Bank of England Official Cash Rate: -0.25% to 4.25% forecast
Friday
TBA CHN Trade Balance: +CNY 695 billion vs +CNY 737 billion previous
Saturday
11:30 CHN Consumer Price Index (CPI) & Producer Price Index (PPI) Inflation April y/y
CPI: -0.2% p.a. forecast vs -0.1% p.a. in March
PPI: -2.6% p.a. forecast vs -2.5% p.a. in March
Latest News
Interesting Movers
Trading higher
+68.2% Dateline Resources (DTR) – Rare Earths Drilling at Colloseum, rise is consistent with prevailing short term uptrend and long term trend is transitioning from down to up 🔎📈
+27.7% Waratah Minerals (WTM) – RIU Resources Roundup Investor Presentation and continued positive response to Porphyry Copper-Gold intersected at Breccia West rise is consistent with prevailing short term uptrend and long term trend is transitioning from down to up 🔎📈
+21.7% White Cliff Minerals (WCN) – 175m @ 2.5% Copper Hole Ends in 4.46% Copper, rise is consistent with prevailing short and long term uptrends 🔎📈
+11.8% Pantoro (PNR) – No news, general strength across the broader Gold sector today, rise is consistent with prevailing short and long term uptrends, a regular in ChartWatch ASX Scans Uptrends list 🔎📈
+11.5% Immutep (IMM) – Continued positive response to News Date Excellent Overall Survival in Head & Neck Cancer Patients, several positive broker reviews today (see Broker Moves section for more details).
+10.9% Resolute Mining (RSG) – No news, general strength across the broader Gold sector today, rise is consistent with prevailing short term uptrend and long term trend is transitioning from down to up 🔎📈
+10.2% Autosports Group (ASG) – No news 🤔
+10.2% Larvotto Resources (LRV) – Hillgrove Antimony-Gold Project Delivers Compelling DFS, general strength across the broader Gold sector today, rise is consistent with prevailing long term uptrend 🔎📈
+10.0% Titomic (TTT) – No news, general strength across the broader Gold sector today, rise is consistent with prevailing short and long term uptrends, a regular in ChartWatch ASX Scans Uptrends list 🔎📈
+9.7% Brightstar Resources (BTR) – RIU Conference Presentation and Brightstar executes A$18M working capital facility, general strength across the broader Gold sector today.
+9.6% Tabcorp (TAH) – Presentation to Macquarie Australia Conference, general strength across the broader Gold sector today.
+8.3% Nextdc (NXT) – Contract Utilisation and Forward Order Book Update, general strength across the broader Gold sector today.
+7.3% Ramelius Resources (RMS) – Becoming a substantial holder (Dimensional Entities 🛸), general strength across the broader Gold sector today, rise is consistent with prevailing short and long term uptrends, a regular in ChartWatch ASX Scans Uptrends list 🔎📈
+7.1% Black Cat Syndicate (BC8) – Results of General Meeting, general strength across the broader Gold sector today, rise is consistent with prevailing short and long term uptrends, a regular in ChartWatch ASX Scans Uptrends list 🔎📈
+6.8% Chalice Mining (CHN) – Further process flowsheet improvements at Gonneville and Presentation - Macquarie Australia Conference, general strength across the broader Gold sector today.
+6.6% West African Resources (WAF) – No news, general strength across the broader Gold sector today, rise is consistent with prevailing short and long term uptrends, a regular in ChartWatch ASX Scans Uptrends list 🔎📈
+6.5% Ora Banda Mining (OBM) – No news, general strength across the broader Gold sector today.
+6.2% Antipa Minerals (AZY) – No news, general strength across the broader Gold sector today, rise is consistent with prevailing short and long term uptrends, a regular in ChartWatch ASX Scans Uptrends list 🔎📈
+5.7% Helia Group (HLI) – No news, rise is consistent with prevailing short and long term uptrends, a regular in ChartWatch ASX Scans Uptrends list 🔎📈
+5.3% Perseus Mining (PRU) – No news, general strength across the broader Gold sector today, rise is consistent with prevailing short and long term uptrends, a regular in ChartWatch ASX Scans Uptrends list 🔎📈
+5.3% Spartan Resources (SPR) – Becoming a substantial holder (UBS), general strength across the broader Gold sector today, rise is consistent with prevailing short and long term uptrends, a regular in ChartWatch ASX Scans Uptrends list 🔎📈
+5.3% Develop Global (DVP) – No news, rise is consistent with prevailing short and long term uptrends 🔎📈
+5.3% Firefly Metals (FFM) – No news, general strength across the broader Copper-Gold sector today.
+5.0% Evolution Mining (EVN) – No news, general strength across the broader Gold sector today, rise is consistent with prevailing short and long term uptrends, a regular in ChartWatch ASX Scans Uptrends list 🔎📈
+5.0% Regis Resources (RRL) – Change in substantial holding (likely a reduction in short sell exposure here), general strength across the broader Gold sector today, rise is consistent with prevailing short and long term uptrends, a regular in ChartWatch ASX Scans Uptrends list 🔎📈
+4.9% Bellevue Gold (BGL) – No news, general strength across the broader Gold sector today.
+4.8% Emerald Resources (EMR) – No news, general strength across the broader Gold sector today, rise is consistent with prevailing short and long term uptrends, a regular in ChartWatch ASX Scans Uptrends list 🔎📈
+4.7% Kingsgate Consolidated (KCN) – No news, general strength across the broader Gold sector today, rise is consistent with prevailing short and long term uptrends, a regular in ChartWatch ASX Scans Uptrends list 🔎📈
Trading lower
-13.5% Silex Systems (SLX) – Uranium Enrichment Project Update, fall is consistent with prevailing short and long term downtrends, a regular in ChartWatch ASX Scans Downtrends list 🔎📉
-8.7% Warriedar Resources (WA8) – Investor Webinar, pulled back in the wake of recent sharp rally.
-6.7% Platinum Asset Management (PTM) – Funds Under Management - 30 April 2025, repelled perfectly from long term downtrend ribbon! 🔎📉
-6.7% Sigma Healthcare (SIG) – Trading Update and Macquarie Sydney Conference Presentation.
-6.5% Koonenberry Gold (KNB) – Change in substantial holding (DATT Capital, but it's unlikely this is the reason for the sell down today), pulled back in the wake of recent sharp rally.
-5.8% HMC Capital (HMC) – Macquarie Conference Presentation, fall is consistent with prevailing short and long term downtrends, a regular in ChartWatch ASX Scans Downtrends list 🔎📉
-4.8% Appen (APX) – No news, fall is consistent with prevailing short and long term downtrends, a regular in ChartWatch ASX Scans Downtrends list 🔎📉
-4.3% Endeavour Group (EDV) – No news since 05-May F25 Third Quarter Trading Update, two rating downgrades and several price target cuts by the brokers, (perhaps they should have noted:) fall is consistent with prevailing short and long term downtrends, a regular in ChartWatch ASX Scans Downtrends list 🔎📉
Broker Moves
Life360 (360)
Retained at buy at Bell Potter; Price Target: $28.15 from $28.00
Retained at buy at Goldman Sachs; Price Target: $27.00
The A2 Milk Company (A2M)
Retained at buy at UBS; Price Target: NZ$9.95 from NZ$8.68
Aristocrat Leisure (ALL)
Retained at outperform at Macquarie; Price Target: $75.00
Amotiv (AOV)
Retained at outperform at Macquarie; Price Target: $10.90
Retained at buy at UBS; Price Target: $10.90
Eagers Automotive (APE)
Retained at outperform at Macquarie; Price Target: $16.39
Retained at neutral at UBS; Price Target: $14.80
ARB Corporation (ARB)
Retained at neutral at Citi; Price Target: $39.54
Retained at outperform at Macquarie; Price Target: $45.40
Retained at sell at UBS; Price Target: $34.00
Aroa Biosurgery (ARX)
Downgraded to speculative buy from add at Morgans; Price Target: $0.930
Autosports Group (ASG)
Retained at outperform at Macquarie; Price Target: $2.00
Retained at neutral at UBS; Price Target: $1.800
Aurizon (AZJ)
Retained at neutral at Macquarie; Price Target: $3.32 from $3.41
Bapcor (BAP)
Retained at outperform at Macquarie; Price Target: $5.85
Chrysos Corporation (C79)
Retained at hold at Bell Potter; Price Target: $4.40 from $4.70
Coles Group (COL)
Retained at buy at Citi; Price Target: $21.00
COR (Error Ticker Not Found)
Retained at hold at Bell Potter; Price Target: $3.05 from $3.25
DUG Technology (DUG)
Retained at buy at Shaw and Partners; Price Target: $3.00
Endeavour Group (EDV)
Retained at neutral at Citi; Price Target: $4.59 from $4.50
Retained at neutral at Goldman Sachs; Price Target: $4.50
Downgraded to hold from buy at Jefferies; Price Target: $4.50 from $5.50
Retained at neutral at JP Morgan; Price Target: $4.60 from $4.80
Retained at hold at Morgans; Price Target: $4.35
Downgraded to neutral from buy at UBS; Price Target: $4.25 from $4.50
Flight Centre Travel Group (FLT)
Retained at buy at UBS; Price Target: $15.00 from $20.00
Fleetpartners Group (FPR)
Retained at outperform at Macquarie; Price Target: $3.65
Gold Road Resources (GOR)
Downgraded to hold from buy at Canaccord Genuity; Price Target: $3.40 from $3.45
Downgraded to neutral from outperform at Macquarie; Price Target: $3.40 from $2.10
Helia Group (HLI)
Retained at neutral at Goldman Sachs; Price Target: $3.93 from $3.70
Harvey Norman (HVN)
Retained at buy at Citi; Price Target: $5.80
Insurance Australia Group (IAG)
Retained at equal-weight at Morgan Stanley; Price Target: $7.85 from $8.05
Iluka Resources (ILU)
Retained at buy at Goldman Sachs; Price Target: $6.20 from $6.50
Retained at outperform at Macquarie; Price Target: $6.50
Immutep (IMM)
Retained at buy at Canaccord Genuity; Price Target: $0.980 from $0.950
Retained at outperform at CLSA; Price Target: $0.950
Retained at buy at Jefferies; Price Target: $2.10
Retained at overweight at Wilsons; Price Target: $1.050
Inghams Group (ING)
Retained at sector perform at RBC Capital Markets; Price Target: $3.30
Impedimed (IPD)
Retained at buy at Morgans; Price Target: $0.150 from $0.160
JB HI-FI (JBH)
Retained at buy at Citi; Price Target: $110.00
Light & Wonder (LNW)
Retained at outperform at Macquarie; Price Target: $198.00
Mach7 Technologies (M7T)
Retained at add at Morgans; Price Target: $1.370
Metro Mining (MMI)
Retained at buy at Shaw and Partners; Price Target: $0.170
McMillan Shakespeare (MMS)
Retained at outperform at Macquarie; Price Target: $18.24
Metcash (MTS)
Retained at buy at Citi; Price Target: $3.70
Micro-X (MX1)
Retained at buy at Morgans; Price Target: $0.170
Nextdc (NXT)
Retained at positive at E&P; Price Target: $27.76
Retained at add at Morgans; Price Target: $18.80
Paladin Energy (PDN)
Retained at buy at Shaw and Partners; Price Target: $10.10
Qualitas (QAL)
Retained at positive at E&P; Price Target: $4.00
QBE Insurance Group (QBE)
Retained at buy at Citi; Price Target: $23.30
Retained at outperform at Macquarie; Price Target: $23.00
Retained at overweight at Morgan Stanley; Price Target: $24.60 from $25.05
Retained at buy at UBS; Price Target: $24.50 from $24.60
Reliance Worldwide Corporation (RWC)
Retained at buy at Citi; Price Target: $5.25 from $5.90
Retained at buy at Goldman Sachs; Price Target: $5.20 from $6.00
Retained at outperform at Macquarie; Price Target: $5.55 from $5.60
Retained at equal-weight at Morgan Stanley; Price Target: $4.60 from $5.10
Retained at hold at Morgans; Price Target: $4.00 from $4.15
Retained at neutral at UBS; Price Target: $4.50 from $5.60
Siteminder (SDR)
Retained at buy at Citi; Price Target: $6.60 from $7.20
Retained at positive at E&P; Price Target: $6.94
Smartgroup Corporation (SIQ)
Retained at outperform at Macquarie; Price Target: $9.06
Silex Systems (SLX)
Retained at buy at Canaccord Genuity; Price Target: $6.46
Smartpay (SMP)
Retained at buy at Bell Potter; Price Target: $1.330
Super Retail Group (SUL)
Retained at buy at Citi; Price Target: $18.00
Suncorp Group (SUN)
Retained at overweight at Morgan Stanley; Price Target: $22.75
Turaco Gold (TCG)
Retained at buy at Canaccord Genuity; Price Target: $1.000 from $0.800
Retained at buy at Morgans; Price Target: $1.290 from $1.100
Telix Pharmaceuticals (TLX)
Retained at buy at UBS; Price Target: $36.00
Universal Store (UNI)
Retained at buy at Citi; Price Target: $10.53
Westpac Banking Corporation (WBC)
Retained at sell at Citi; Price Target: $27.75
Retained at hold at Jefferies; Price Target: $27.74 from $28.35
Retained at underweight at JP Morgan; Price Target: $27.80 from $28.00
Retained at underperform at Macquarie; Price Target: $27.50 from $28.00
Retained at underweight at Morgan Stanley; Price Target: $27.30
Retained at hold at Morgans; Price Target: $28.35 from $29.02
Retained at buy at UBS; Price Target: $36.00 from $38.00
Westgold Resources (WGX)
Retained at buy at Canaccord Genuity; Price Target: $4.40 from $4.85
Wisetech Global (WTC)
Retained at buy at Citi; Price Target: $115.00
Scans
Top Gainers
Code | Company | Last | % Chg |
|---|---|---|---|
| DTR | Dateline Resources Ltd | $0.037 | +68.18% |
| CAY | Canyon Resources Ltd | $0.265 | +29.27% |
| WTM | Waratah Minerals Ltd | $0.30 | +27.66% |
| BGE | Bridge Saas Ltd | $0.019 | +26.67% |
| GCM | Green Critical Minerals Ltd | $0.015 | +25.00% |
Top Fallers
Code | Company | Last | % Chg |
|---|---|---|---|
| DYM | Dynamic Metals Ltd | $0.21 | -36.36% |
| HCF | H&G High Conviction Ltd | $0.03 | -16.67% |
| PNT | Panther Metals Ltd | $0.015 | -16.67% |
| TG1 | Techgen Metals Ltd | $0.02 | -16.67% |
| 8CO | 8COMMON Ltd | $0.016 | -15.79% |
52 Week Highs
Code | Company | Last | % Chg |
|---|---|---|---|
| DTR | Dateline Resources Ltd | $0.037 | +68.18% |
| WCN | White Cliff Minerals Ltd | $0.028 | +21.74% |
| IXC | INVEX Therapeutics Ltd | $0.09 | +12.50% |
| PNR | Pantoro Gold Ltd | $3.12 | +11.83% |
| PCK | Painchek Ltd | $0.041 | +7.90% |
52 Week Lows
Code | Company | Last | % Chg |
|---|---|---|---|
| HCF | H&G High Conviction Ltd | $0.03 | -16.67% |
| WNX | Wellnex Life Ltd | $0.25 | -13.79% |
| SRJ | SRJ Technologies Group Plc | $0.015 | -11.77% |
| GT1 | Green Technology Metals Ltd | $0.025 | -10.71% |
| DWG | Dataworks Group Ltd | $0.14 | -9.68% |
Near Highs
Code | Company | Last | % Chg |
|---|---|---|---|
| GCI | Gryphon Capital Income Trust | $2.04 | +0.49% |
| IHD | Ishares S&P/ASX DIV Opportunities Esg Screened ETF | $14.44 | -0.48% |
| OBL | Omni Bridgeway Ltd | $1.615 | +5.90% |
| HVN | Harvey Norman Holdings Ltd | $5.29 | +1.34% |
| GLDN | Ishares Physical Gold ETF | $41.46 | +3.52% |
Relative Strength Index (RSI) Oversold
Code | Company | Last | % Chg |
|---|---|---|---|
| PLY | Playside Studios Ltd | $0.135 | 0.00% |
| NWSLV | News Corporation | $41.30 | 0.00% |
| CRN | Coronado Global Resources Inc | $0.17 | +3.03% |
| AOF | Australian Unity Office Fund | $0.48 | 0.00% |
| THL | Tourism Holdings Rentals Ltd | $1.235 | -3.52% |
