ChartWatch: One broke Easter bunny! Soaring cocoa and other ‘make or break inflation’ commodities
Cocoa prices have exploded due to the El Niño weather phenomenon adversely impacting production.

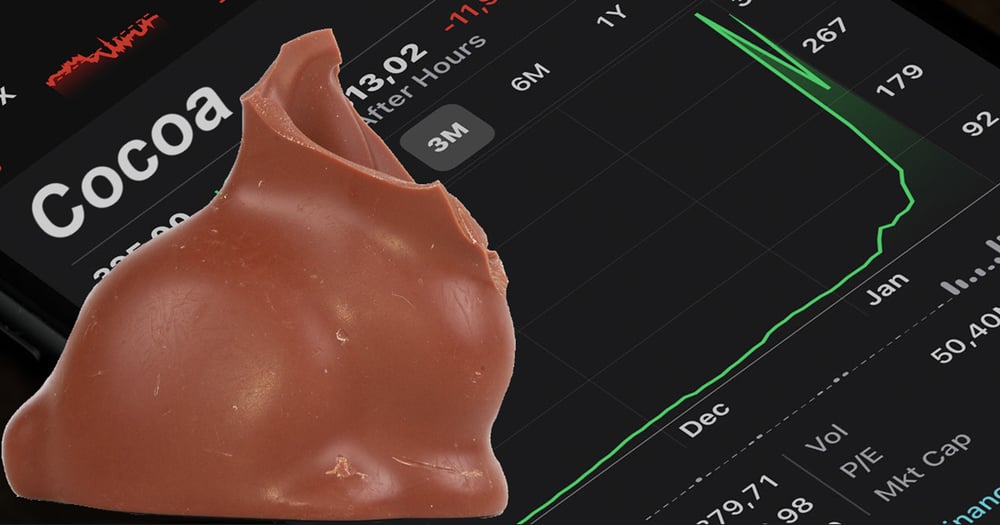
Source: Shutterstock
KEY POINTS
- Cocoa prices have exploded recently due to the impacts of the El Niño weather phenomenon on production
- Media reports suggest this is going to trigger a dramatic increase in the price of chocolate this Easter
- Agricultural commodities can have a significant impact on the inflationary outlook, we investigate the charts of several key food commodities
There’s bean plenty of talk about soaring cocoa prices and the impact this is going to have on Easter eggs spending this year. I’ve read plenty of articles about the topic, but none of them showed an actual chart of cocoa, let alone did some technical analysis on it!
In this ChartWatch, I want to do exactly that, but also broaden the discussion to a few other key ‘make or break inflation’ commodities, as well as discuss how you can trade them.
About to be one broke bunny!
Cocoa prices have risen steadily since the middle of last year. The main reason is the impact the El Niño weather phenomenon has had on production in key cocoa producers Ghana and Ivory Coast. Hotter and drier weather usually associated with El Niño in these countries, which account for nearly 70% of global cocoa production, has followed unseasonably wetter weather in recent years which also crimped output.
The combination of subsequent years of adverse weather events has caused a growing cocoa shortage, which is a key ingredient for the chocolate industry. The unfortunate upshot is good old Smarties filled Humpty Dumpty is going to cost a few more bucks this year!
.

It’s been one hell of a ride for cocoa futures since the middle of last year
ST/LT Trends: ⬆️/⬆️
Price action: 📈
Candles: ⬜
Key Support / Resistance: 18 Mar peak high @ 8493 / Nil
Commentary: From a technical perspective, the chart of cocoa is the exemplification of the manifestation of excess demand:
Almost exclusively white candles – Demonstrates day to day accumulation
Rising peaks and rising troughs – Demonstrate a buy the dip mentality
Well-established, and accelerating short and long term uptrends – Demonstrates strong bullish momentum
I do note however, Tuesday candle is a supply-side one with its black body, upward pointing shadow, and close near the low of the session. Whilst it is modest compared to the magnitude of its demand-side predecessors, it has occurred at the important round number of US$10,000/t.
Round numbers of this significance should be treated cautiously by the technical analyst. Should further supply-side candles appear to confirm Tuesday’s, along with a reversion to falling peaks and falling troughs, the short term uptrend will be neutralised. A close below the short term trend ribbon will end it.
Until then, and while demand-side candles and rising peaks and rising troughs prevail, there’s no reason to doubt the continuity of the current trend.
Other make or break agricultural commodities
Wheat

In theory, falling wheat prices should be contributing to global deflation
ST/LT Trends: ⬇️/⬇️
Price action: 📉
Candles: ⬛
Key Support / Resistance: 11 Mar trough low @ 523 / 25 Mar peak high @ 567
Commentary: We probably couldn’t look at two more diametrically opposed charts than Cocoa and Wheat. This is a great example of how excess supply of an asset manifests itself in that asset’s price:
Almost exclusively black candles – Demonstrates day to day distribution
Falling peaks and falling troughs – Demonstrate a sell the rally mentality
Well-established, and accelerating short and long term downtrends – Demonstrates strong bearish momentum
I suggest the short term trend remains intact until the bullish opposite of points one and two above appear, or the price of wheat closes at least above historical supply at 567, but preferably, above the dynamic resistance of the long term downtrend ribbon.
A close below historical demand at 523 would likely continue the short and long term downtrends.
I will leave you with this thought bubble: Sure we’re going to pay more for our Easter eggs this time around, but looking at the chart above…Why aren’t we paying less for a loaf of bread!? 🤔
Corn

Falling corn prices should also be contributing to lower bills at the checkouts
ST/LT Trends: ⬇️/⬇️
Price action: 📉
Candles: ⬛
Key Support / Resistance: 26 Feb trough low @ 409 / 21 Mar peak high @ 446
Commentary: One could easily argue that falling corn prices should also be contributing to lower bills at the checkouts (I can sense your anger but not bewilderment rising…someone’s getting fat off these commodity price moves!).
A big case if ditto here from wheat – very well established short and long term downtrends. Price action has just swung back to falling peaks and falling troughs after a modest rally from 409, and candles are again skewed to the supply-side.
I suggest the short term downtrend is intact while the corn price continues to close below 446, and the long term downtrend until the corn price closes above the long term downtrend ribbon.
409 is a point of major historical support. It may well hold and help stamp out a low on corn, but if it goes, further declines are possible.
Coffee

Coffee prices could go the way of cocoa if key historical supply points are breached
ST/LT Trends: ➡️/⬆️
Price action: ⬅️➡️
Candles: ⬜⬛
Key Support / Resistance: 18 Jan trough low @ 175 / 18 Apr 2023 peak high @ 205
Commentary: There are two major coffee varieties traded on global futures markets, Arabica (chart above) and Robusta (chart below). The global trade split is about 70-30 so Arabica is likely to contribute to the lion’s share of your morning double espresso.
Looking at the above chart, your morning caffeine hit could be about to become more expensive if the Arabica coffee price can breach the major historical supply zone at 204-205.
Largely though, short term trends and price action are sideways, and candles are mixed. This tells me there’s a great deal of indecision in the Arabica coffee market at the moment.
The long term trend is up, and this possibly hints at the direction of the next move from the narrowing consolidation band which has been in place since December. The chart of Robusta coffee, shown below, may also hint at the future direction in Arabica coffee.
A break of historical demand at 175 would likely be decisive to the downside.

The rising Robusta coffee price could be hinting at the next major directional move in Arabica coffee
Rice

Rice futures have taken a dive since the major peak in Feburary
ST/LT Trends: ⬇️/➡️
Price action: 📉
Candles: ⬛
Commentary: Rice is one of the world’s most important food staples, and it makes sense then fluctuations in its price can have significant implications for global inflation. Good news, since the major peak in February, the price of rice has broken sharply to the downside. This is mainly due to reports of a strong main winter-spring crop crop in parts of Asia.
The short term trend is down, and the long term trend is back to neutral. Falling peaks and falling troughs, and some extremely powerful supply side candles indicate the long term trend is at risk of turning down. This would be confirmed if the price of rise fails to close back above the long term trend ribbon on the next rally, and instead sets a peak in or below it.
How to go short the Easter Bunny (or the next best thing)
I hope you enjoyed our technical tour de food commodities. Apart from the obvious impact on your finances when you get to the check out, or when you buy your morning coffee and block of dark chocolate, you may want to consider taking a more proactive approach to food commodities.
It is possible to trade these commodities using options and futures contracts or by using contracts for difference (CFDs). A full discussion of the ins and outs of commodities trading is beyond the scope of today’s article, but I hope I have alerted you to the substantial possibilities here.
Quite simply, when commodities move…they can really move. Like cocoa.
There’s no concept of too expensive versus an earnings outlook like there is with stocks. There’s just pure, unadulterated supply versus demand. If there simply isn’t enough of something which people really want to consume around, the price of that something must go up. So pay attention, there might just be a trade there!
Carl’s Technical Analysis Methodology Key
Trends (ST Trend ribbon: 21 & 34 EMAs || LT Trend ribbon: 144 & 233 EMAs)
⬆️ = Uptrend, the ribbon is rising indicating a higher probability the market is in a general state of excess demand
⬇️= Downtrend, the ribbon is declining indicating a higher probability the market is in a general state of excess supply
➡️ = No trend, the ribbon is flattening indicating a higher probability the market is in equilibrium
Price Action
📈 = Rising peaks and rising troughs indicating buy-the-dip activity and supply removal (i.e., indicating a higher probability market is in a general state of excess demand)
📉 = Falling peaks and falling troughs indicating sell the rally activity and demand removal (i.e., indicating a higher probability market is in a general state of excess supply)
⬅️➡️ = Neither of the above scenarios, market price action is indecisive
Candles
⬜ = Predominantly demand-side candles in the recent past, i.e., white bodies and or downward-pointing shadows (i.e., indicating a higher probability market is in a general state of excess demand)
⬛ = Predominantly supply-side candles in the recent past, i.e., black bodies and or upward-pointing shadows (i.e., indicating a higher probability market is in a general state of excess supply)
⬜⬛ = Mixed, i.e., indicating no discernible trend towards demand-side or supply-side candles in the recent past
