ChartWatch ASX Scans: Fortescue, Rio Tinto, South32, Evolution Mining, Develop Global, Echoiq, Telstra
Your daily dose of the most actionable uptrends and downtrends on the ASX based on expert technical analysis.


Source: Shutterstock
Mentioned
KEY POINTS
- Today’s most interesting uptrends: Avita Medical (AVH), Fisher & Paykel Healthcare (FPH), BetaShares Video Games and Esports ETF (GAME), Resmed (RMD), Sonic Healthcare (SHL), Telstra Group (TLS), Vanguard Australian Fixed Interest Index ETF (VAF).
- Today’s most interesting downtrends: A2 Milk (A2M), Ampol (ALD), Chalice Mining (CHN), Develop Global (DVP), Echoiq (EIQ), Evolution Mining (EVN), Fortescue (FMG), Metals X (MLX), Macquarie Group (MQG), Rio Tinto (RIO), South32 (S32), WA1 Resources (WA1).
Welcome to my daily ChartWatch ASX Scans series. Here, I present scan lists based on my trend following technical analysis methodology which you can learn by watching these videos 📺. My goal is to alert you to the best uptrends and downtrends on the ASX.
How to use the Uptrends & Downtrends lists
Feel free to get your favourite AI to convert the tables below into lists you can upload to your favourite trading platform like TradingView. Then, you can skip from chart to chart and quickly assess the best uptrends and downtrends on the ASX.
Some investors prefer to buy stocks in strong uptrends, and avoid, sell, or short sell stocks in strong downtrends – but how you use my ChartWatch lists is really up to you!
As long as a stock meets my criteria, it will keep appearing in a list – but there aren't any notifications when a trend changes – so you'll have to do your own research!
Uptrends Scan List 📈
Company | Code | Last Price | 1mo % | 1yr % | Mkt Cap |
|---|---|---|---|---|---|
Avita Medical | AVH | $5.10 | +27.8% | +351.3% | $10.9b |
Bapcor | BAP | $0.905 | +16.8% | -45.2% | $608.8m |
Clover Corporation | CLV | $1.200 | +17.1% | +81.8% | $200.4m |
Cochlear | COH | $153.87 | +8.8% | -43.5% | $10.1b |
CSL | CSL | $199.85 | +1.9% | +11.0% | $95.9b |
Dexus | DXS | $6.16 | +9.8% | -14.0% | $6.6b |
Fisher & Paykel Healthcare | FPH | $40.61 | +1.9% | +28.4% | $23.9b |
BetaShares Video Games Esports ETF | GAME | $17.58 | +9.1% | -9.1% | $42.4m |
Global Lithium Resources | GL1 | $0.995 | +4.2% | +71.6% | $276.1m |
BetaShares Global Cybersecurity ETF | HACK | $18.78 | +2.3% | +25.5% | $1.7b |
iShares Core Composite Bond ETF | IAF | $101.79 | +1.9% | -1.1% | $3.8b |
Qantas Airways | QAN | $9.68 | +15.9% | +0.5% | $14.6b |
Resmed | RMD | $36.41 | +4.4% | -3.7% | $52.0b |
The Star Entertainment Group | SGR | $0.175 | +45.8% | +103.5% | $1.2b |
Sonic Healthcare | SHL | $21.33 | +13.4% | +2.1% | $10.5b |
Spark New Zealand | SPK | $1.820 | +19.0% | -5.9% | $3.5b |
Telstra Group | TLS | $5.23 | +7.8% | +6.3% | $57.8b |
TPG Telecom | TPG | $4.06 | +4.6% | +6.8% | $8.0b |
Temple & Webster | TPW | $6.47 | +44.7% | -67.3% | $754.1m |
Vanguard Aus Fixed Interest ETF | VAF | $45.67 | +2.0% | -1.4% | $4.0b |
Vanguard Global Infrastructure ETF | VBLD | $79.74 | +8.1% | +6.2% | $735.2m |
Vanguard Aus Gov Bond ETF | VGB | $46.22 | +2.1% | -1.5% | $1.5b |
Webbeds Group | WEB | $3.88 | +11.5% | -3.0% | $1.4b |
Woolworths Group | WOW | $42.25 | +0.9% | +51.0% | $51.6b |
Today's Uptrends Scan List
Feature Charts from today's Uptrends List 🔎
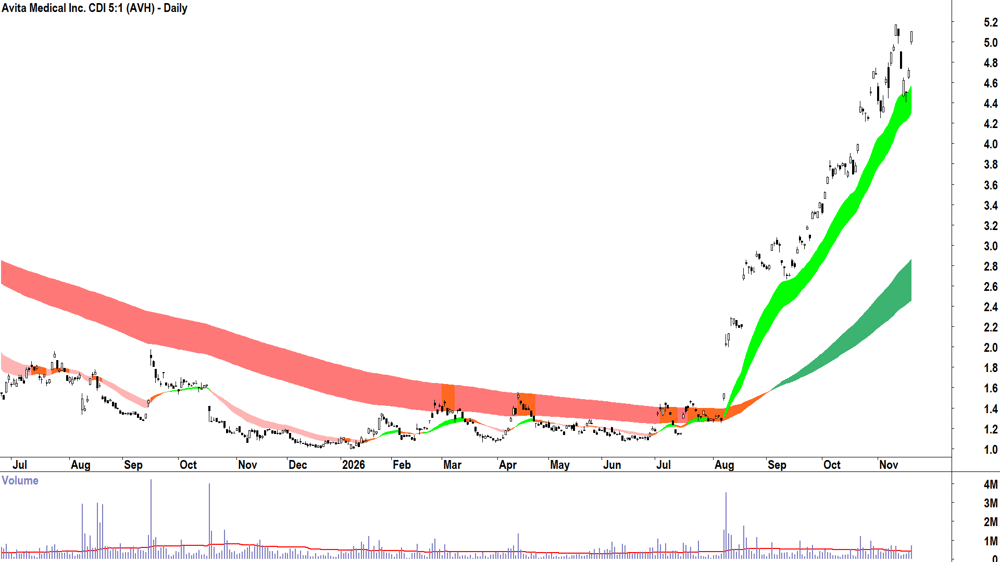
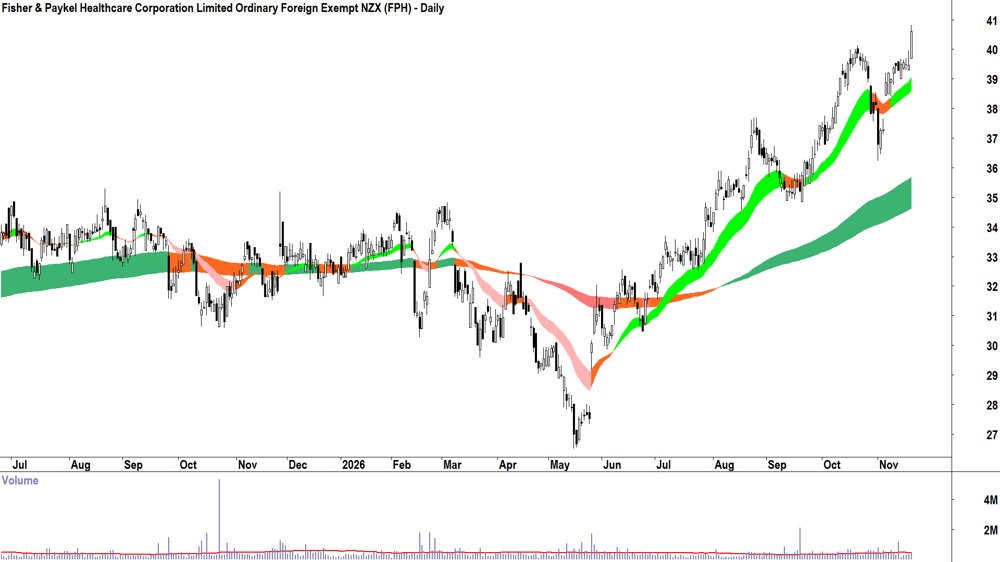
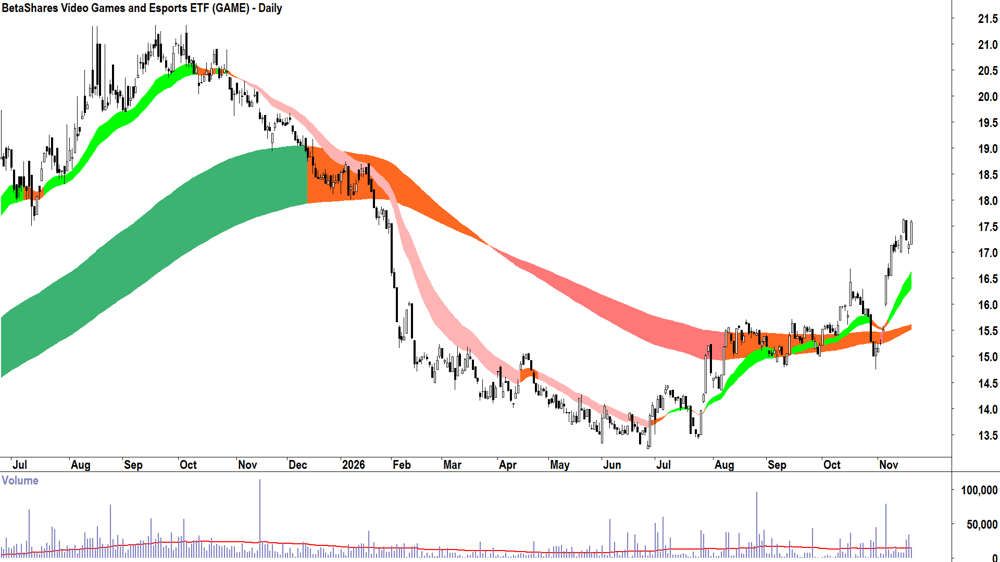
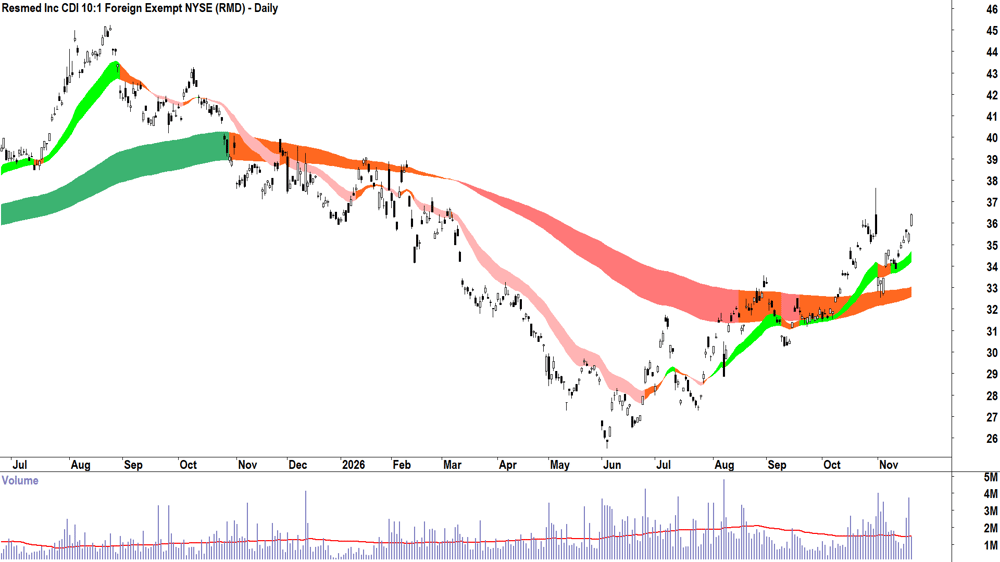
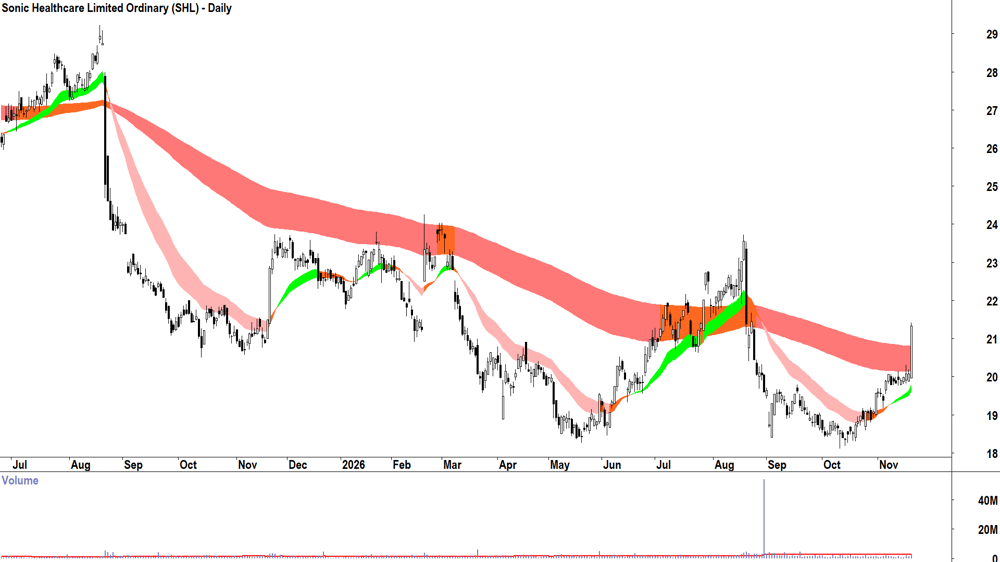
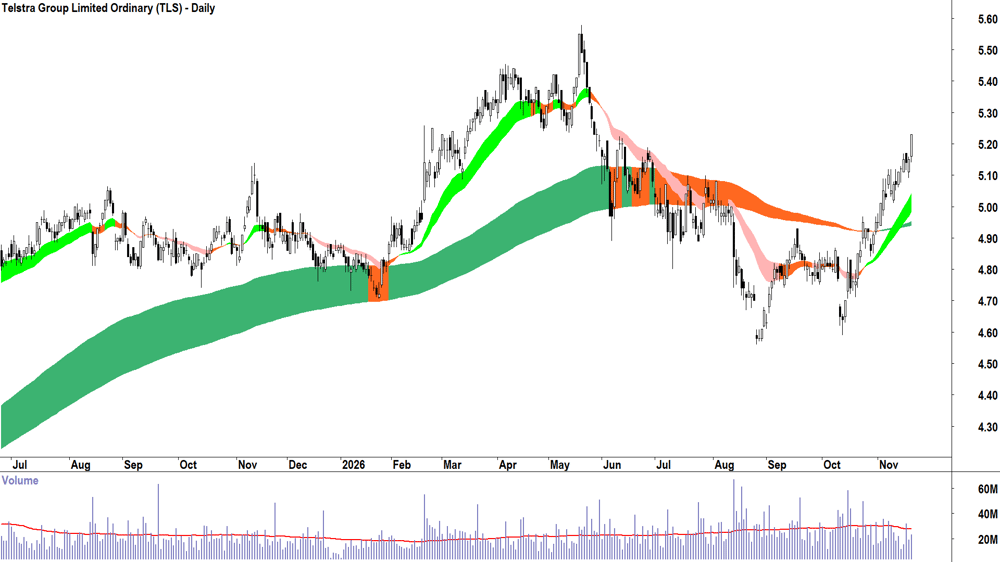
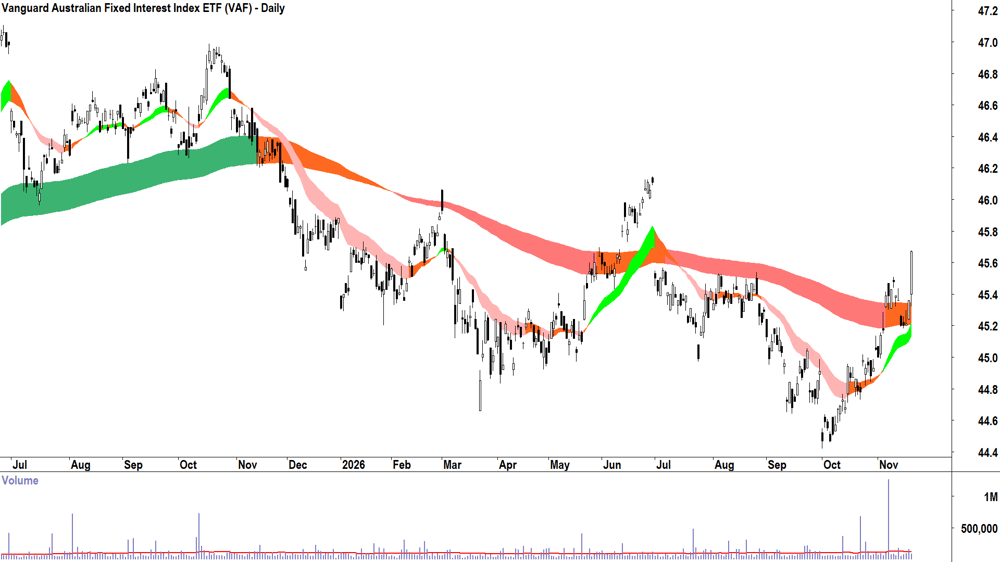
The stocks that I feel are showing the strongest excess demand from today's Uptrends List are: Avita Medical (AVH), Fisher & Paykel Healthcare Corporation (FPH), BetaShares Video Games and Esports ETF (GAME), Resmed (RMD), Sonic Healthcare (SHL), Telstra Group (TLS), Vanguard Australian Fixed Interest Index ETF (VAF).
Feature Uptrend Charts:
ChartWatch *LIVE* Webinar
ChartWatch *LIVE* Webinars – WEEKLY Wednesday's @ 12pm AEDT
Learn more about technical analysis and trend following through real case studies on ASX stocks. Australia's premier technical analyst, Carl Capolingua, shares his unique insights on stocks as requested by viewers. Ask about a company in your portfolio or anything related to trading and investing and get Carl's expert opinion.
Places are limited so >REGISTER NOW!<
Downtrends Scan List 📉
Company | Code | Last Price | 1mo % | 1yr % | Mkt Cap |
|---|---|---|---|---|---|
AIC Mines | A1M | $0.580 | -23.7% | +22.1% | $587.7m |
The A2 Milk Company | A2M | $6.45 | -5.0% | -31.7% | $4.7b |
Alcoa Corporation | AAI | $53.27 | -8.5% | -3.0% | $2.2b |
Amplitude Energy | AEL | $1.595 | -15.6% | -43.4% | $478.3m |
Ampol | ALD | $36.14 | -8.9% | +15.6% | $8.6b |
Arafura Rare Earths | ARU | $0.135 | -10.0% | -50.9% | $820.1m |
Autosports Group | ASG | $0.960 | -11.9% | -78.4% | $204.9m |
Artrya | AYA | $2.59 | -2.3% | -18.0% | $425.9m |
Boab Metals | BML | $0.275 | -14.1% | -34.5% | $160.4m |
Beach Energy | BPT | $0.855 | -10.9% | -32.7% | $2.0b |
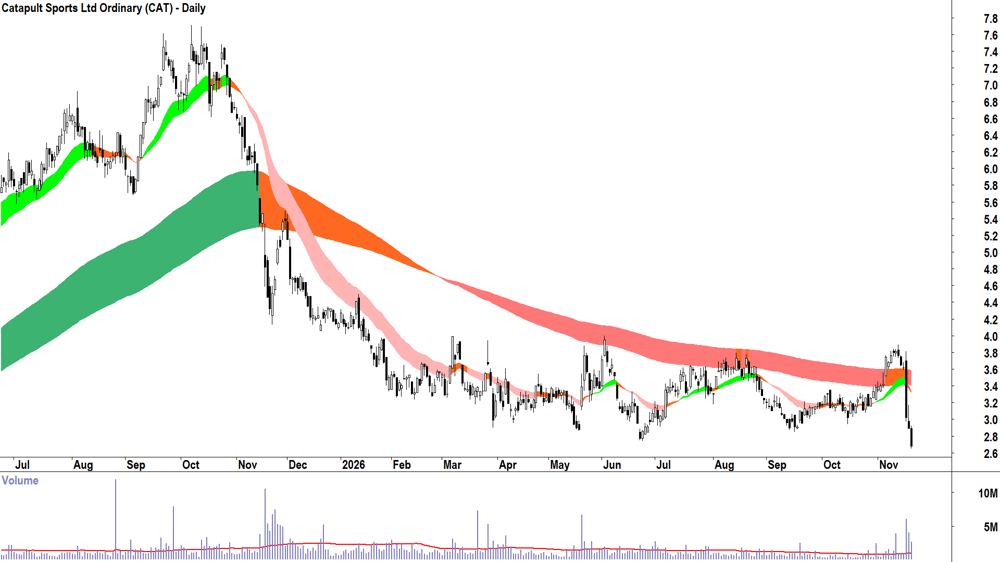
Catapult Sports | CAT | $2.68 | -17.0% | -44.4% | $846.8m |
Cobre | CBE | $0.190 | -24.0% | +100.0% | $247.4m |
Chalice Mining | CHN | $0.915 | -3.2% | -47.1% | $357.0m |
Capricorn Metals | CMM | $12.10 | -12.8% | -10.0% | $5.5b |
Centaurus Metals | CTM | $0.330 | -13.2% | -20.5% | $217.2m |
Dyno Nobel | DNL | $3.14 | -21.7% | -5.7% | $5.5b |
DPM Metals | DPM | $45.48 | -22.3% | +23.9% | $435.4m |
Deterra Royalties | DRR | $3.61 | -7.4% | -5.2% | $1.9b |
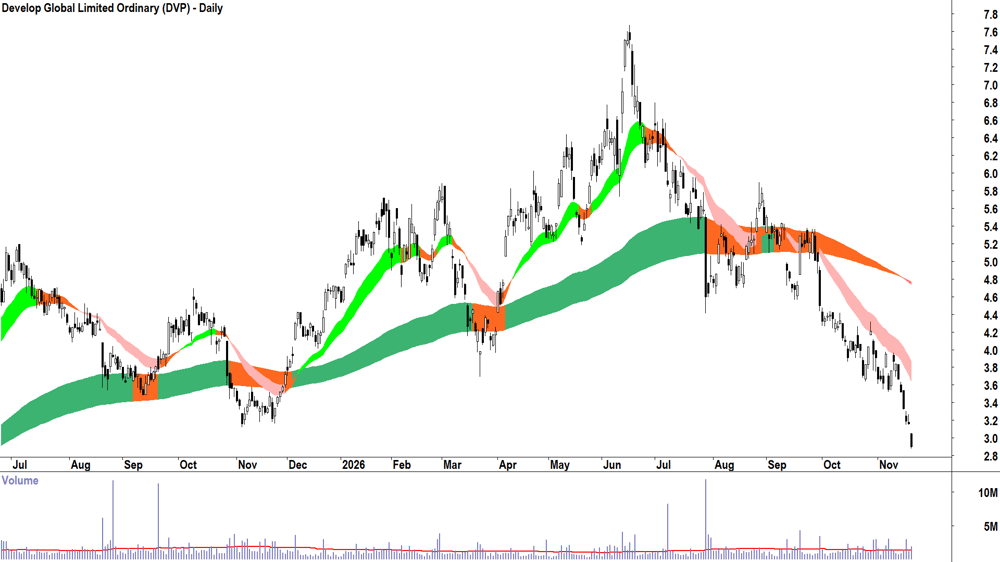
Develop Global | DVP | $2.90 | -27.9% | -11.9% | $957.0m |
Deep Yellow | DYL | $0.680 | -9.9% | -57.1% | $662.6m |
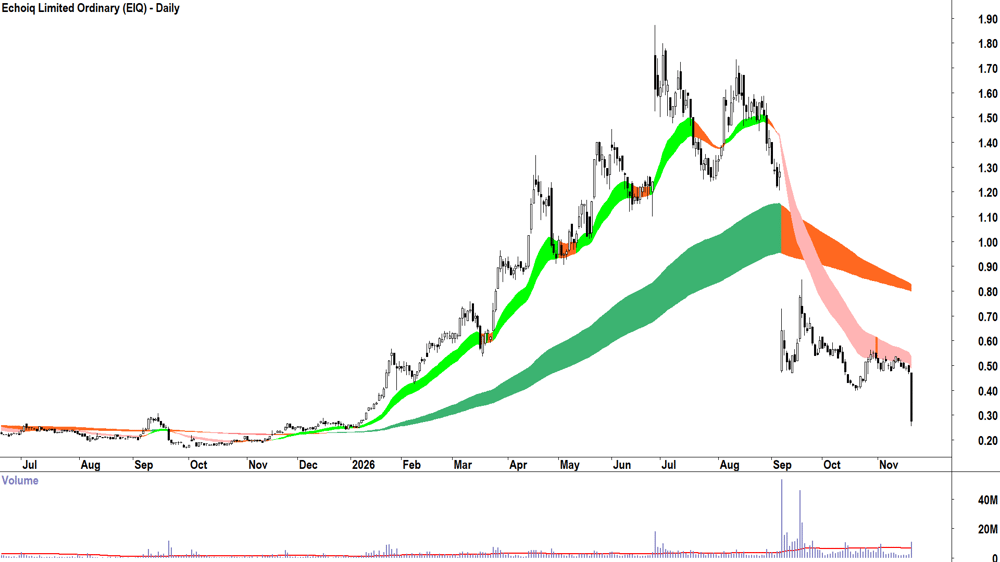
Echoiq | EIQ | $0.275 | -33.7% | +34.1% | $203.7m |
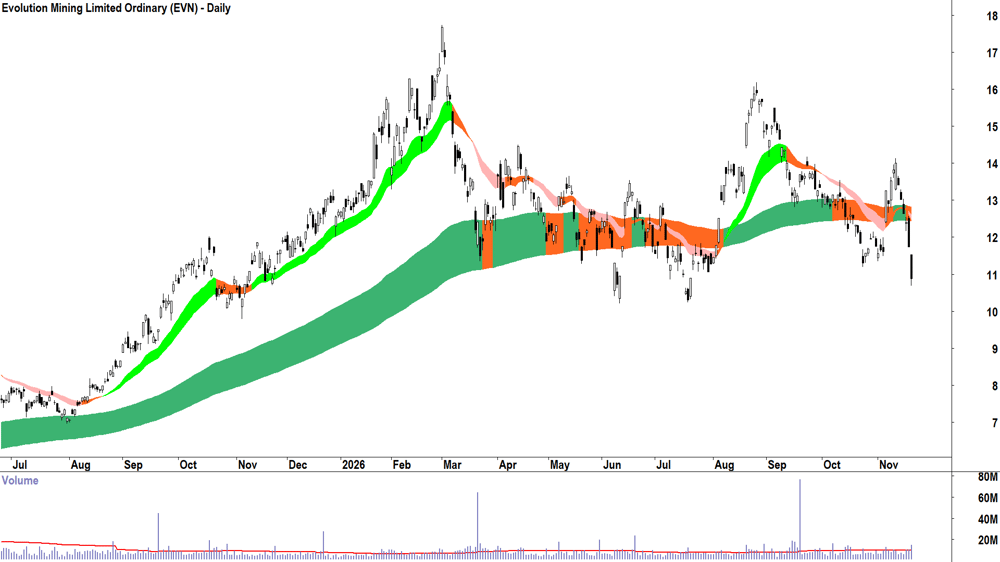
Evolution Mining | EVN | $10.88 | -10.3% | +0.6% | $22.4b |
Firefly Metals | FFM | $1.195 | -10.8% | -34.3% | $1.0b |
Fortescue | FMG | $13.16 | -13.8% | -34.4% | $40.5b |
Focus Minerals | FML | $1.605 | -9.3% | -36.3% | $459.9m |
Forrestania Resources | FRS | $0.270 | -22.9% | +35.0% | $689.9m |
Generation Development | GDG | $2.82 | -14.5% | -53.2% | $1.1b |
GDI Property Group | GDI | $0.615 | -2.4% | -5.4% | $331.6m |
Greatland Resources | GGP | $9.02 | -4.4% | +21.2% | $6.1b |
Galan Lithium | GLN | $0.185 | -17.8% | +23.3% | $235.3m |
Genesis Minerals | GMD | $6.20 | -10.1% | +0.5% | $7.3b |
Helloworld Travel | HLO | $1.325 | -3.3% | -24.3% | $247.9m |
IVE Group | IGL | $2.18 | -5.2% | -24.3% | $334.2m |
Iperionx | IPX | $1.770 | -7.8% | -64.1% | $641.3m |
Jupiter Mines | JMS | $0.220 | -8.3% | -15.4% | $432.5m |
Karoon Energy | KAR | $1.430 | -18.5% | -13.3% | $996.8m |
Kingsgate Consolidated | KCN | $3.57 | -19.0% | -17.0% | $951.1m |
Lifestyle Communities | LIC | $4.02 | +1.8% | -21.9% | $489.4m |
Lendlease Group | LLC | $1.720 | -28.6% | -67.1% | $1.2b |
Larvotto Resources | LRV | $0.680 | -15.0% | -40.4% | $354.2m |
Liontown | LTR | $0.580 | -15.3% | -61.1% | $1.9b |
Mader Group | MAD | $5.55 | -10.5% | -34.5% | $1.2b |
Macmahon Holdings | MAH | $0.815 | -22.0% | +48.2% | $1.8b |
Metals X | MLX | $1.380 | -18.6% | +75.8% | $1.2b |
Medallion Metals | MM8 | $0.355 | -13.4% | -17.4% | $329.6m |
Macquarie Group | MQG | $224.92 | -10.2% | +16.7% | $86.3b |
Maritana Minerals | MRT | $0.445 | -25.2% | -55.1% | $166.2m |
Mesoblast | MSB | $1.705 | -8.3% | -25.2% | $2.2b |
Nexgen Energy | NXG | $10.65 | -12.4% | -11.7% | $5.2b |
Orica | ORI | $21.40 | -7.1% | -9.9% | $9.9b |
Paladin Energy | PDN | $6.19 | -14.3% | -24.2% | $2.8b |
PLS Group | PLS | $2.56 | -12.0% | -37.4% | $8.3b |
Pinnacle Investment | PNI | $14.40 | -1.4% | -9.6% | $3.5b |
Polynovo | PNV | $0.835 | -7.2% | -26.1% | $576.9m |
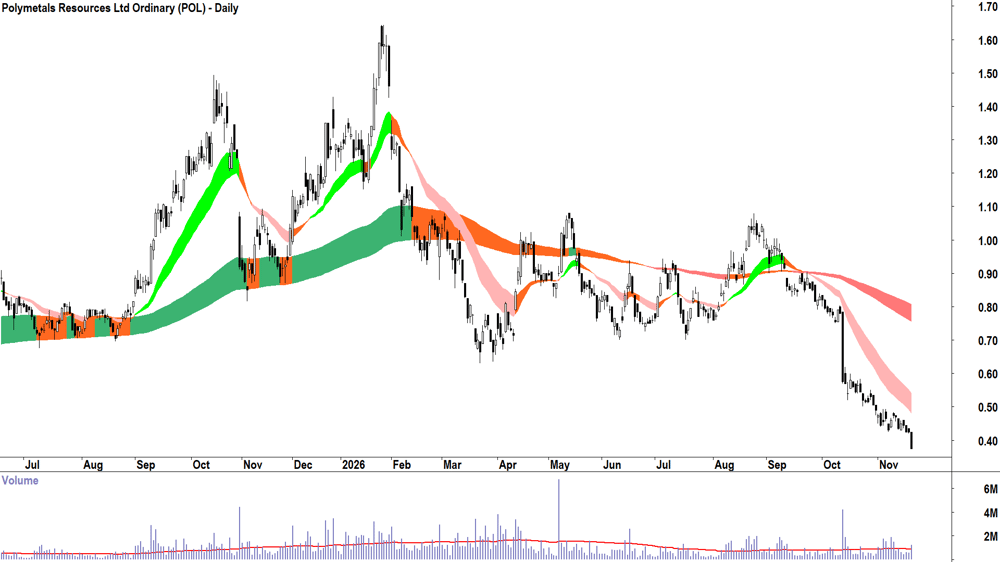
Polymetals Resources | POL | $0.375 | -33.6% | -63.6% | $115.7m |
Perenti | PRN | $1.870 | -6.3% | -29.2% | $1.7b |
PYC Therapeutics | PYC | $1.630 | -9.4% | +21.8% | $1.6b |
Ridley Corporation | RIC | $2.45 | -5.8% | -11.6% | $918.4m |
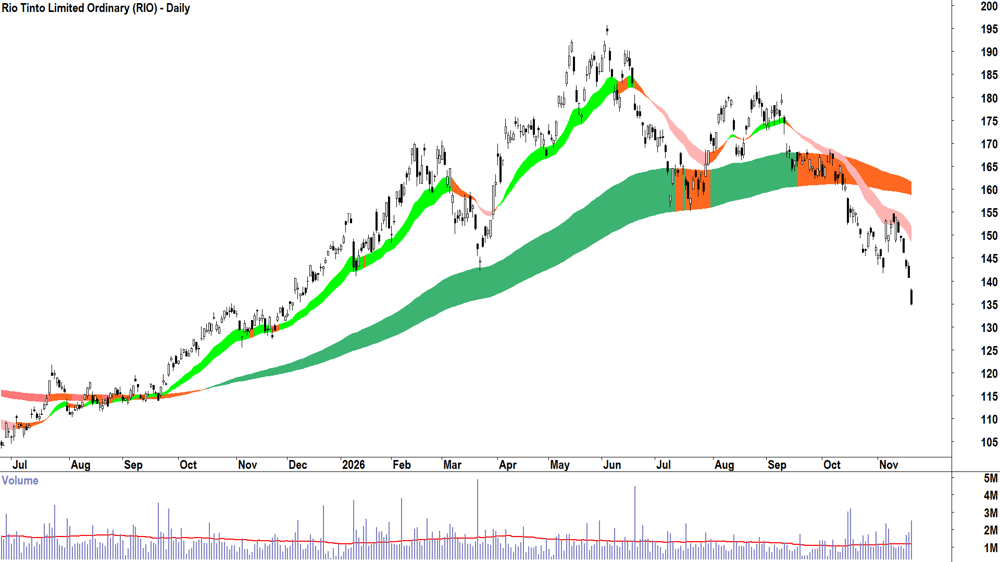
Rio Tinto | RIO | $135.00 | -11.5% | +4.6% | $233.2b |
Resolute Mining | RSG | $1.040 | -8.8% | +3.5% | $2.2b |
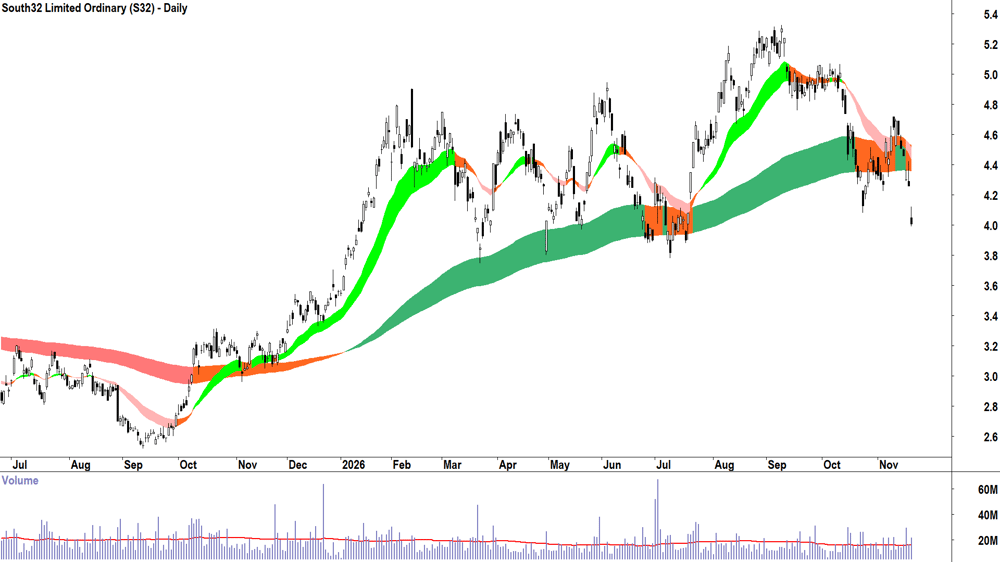
South32 | S32 | $4.01 | -7.2% | +29.8% | $18.0b |
Sinclair Gold | SGC | $0.735 | -26.5% | +53.1% | $136.6m |
St George Mining | SGQ | $0.054 | -5.3% | -53.0% | $254.7m |
Sky Metals | SKY | $0.120 | -31.4% | +73.9% | $119.3m |
Silex Systems | SLX | $2.66 | -23.6% | -67.8% | $741.6m |
Service Stream | SSM | $2.01 | -4.4% | -10.3% | $1.2b |
Sovereign Metals | SVM | $0.380 | -15.6% | -26.2% | $249.3m |
Symal Group | SYL | $2.46 | -5.7% | 0% | $588.4m |
Toubani Resources | TRE | $0.255 | -12.1% | -24.6% | $273.8m |
Titomic | TTT | $0.075 | -42.3% | -66.7% | $135.9m |
Tivan | TVN | $0.150 | -6.3% | -30.2% | $352.1m |
Vitrafy Life Sciences | VFY | $2.38 | -9.8% | +88.1% | $148.4m |
WA1 Resources | WA1 | $6.50 | -22.4% | -56.8% | $483.3m |
WIA Gold | WIA | $0.345 | -25.0% | -1.4% | $688.9m |
Worley | WOR | $9.76 | +3.4% | -28.6% | $4.7b |
Yancoal Australia | YAL | $5.38 | -8.7% | -2.0% | $7.1b |
Today's Downtrends Scan List
Feature Charts from today's Downtrends List 🔎
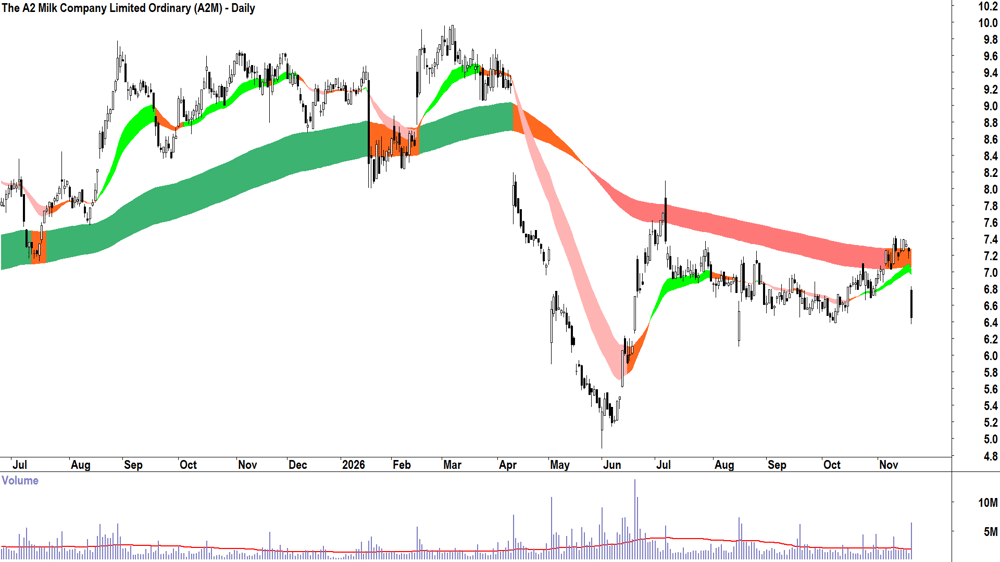
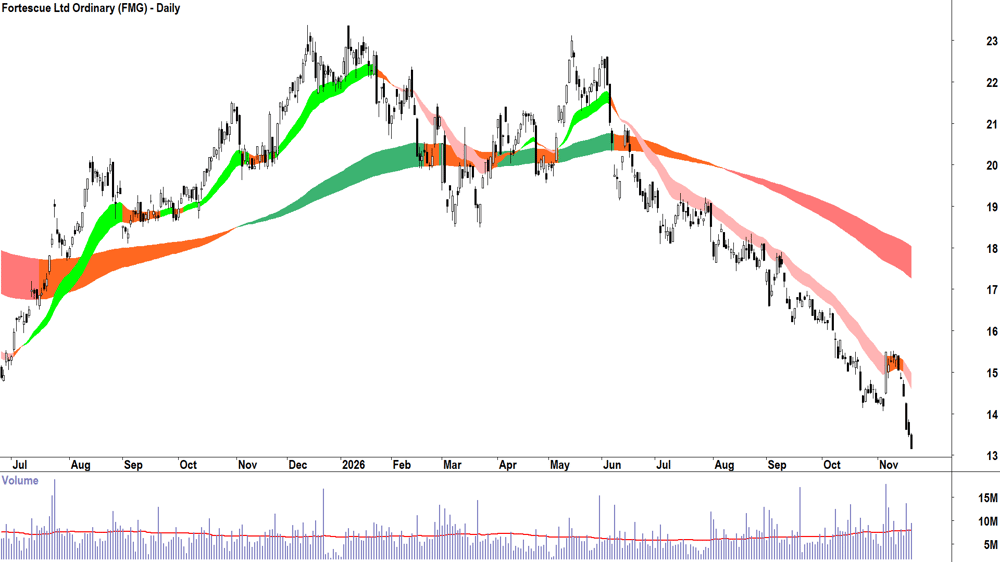
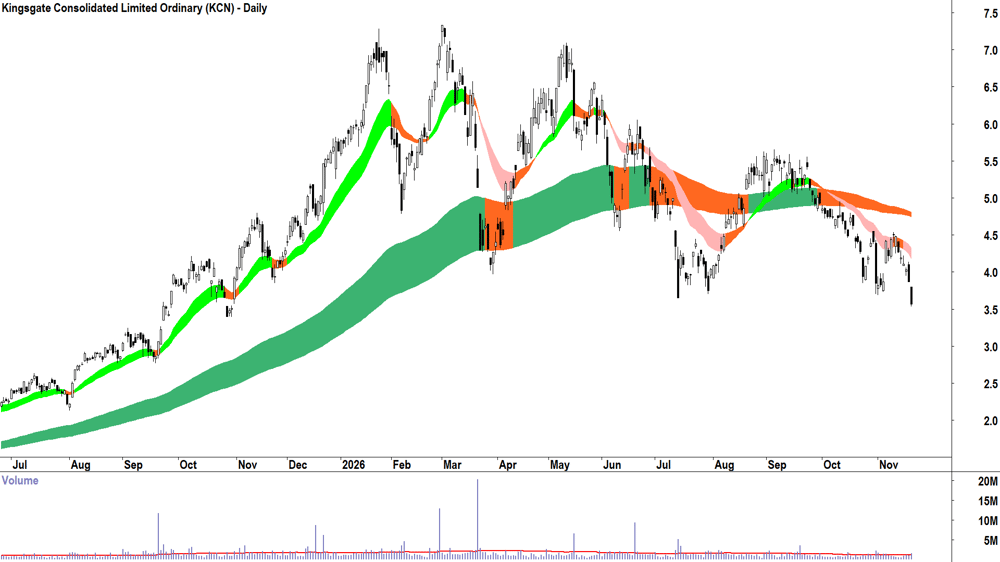
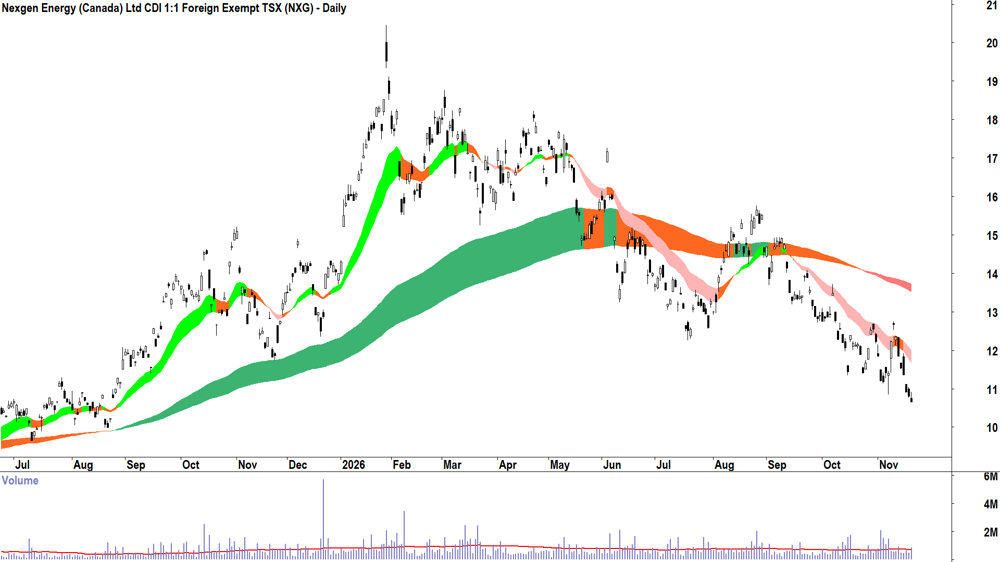
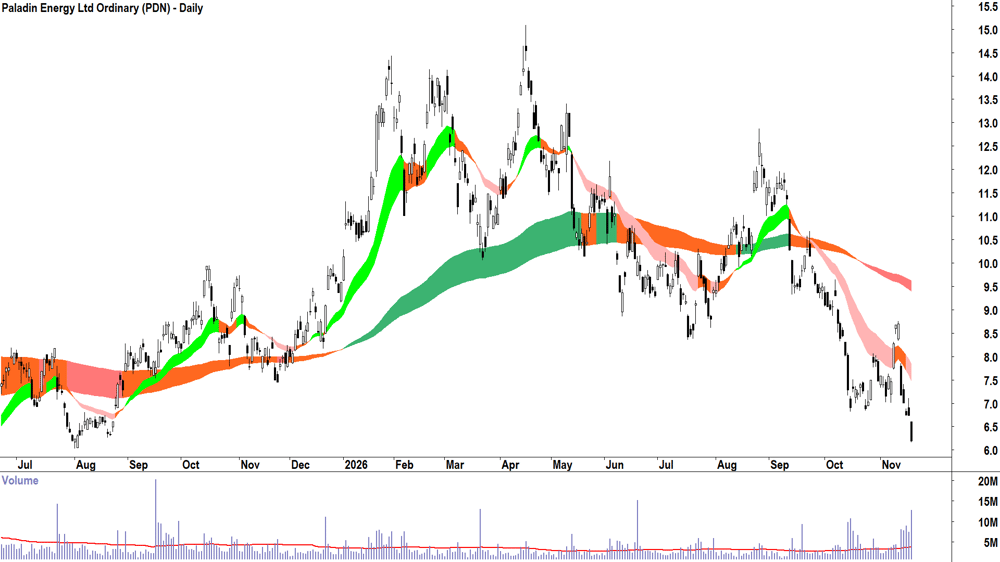
The stocks that I feel are showing the strongest excess supply from today's Downtrends List are: A2 Milk (A2M), Alcoa (AAI), Ampol (ALD), Boab Metals (BML), Catapult Sports (CAT), Chalice Mining (CHN), Dyno Nobel (DNL), Develop Global (DVP), Echoiq (EIQ), Evolution Mining (EVN), Fortescue (FMG), Forrestania Resources (FRS), IVE Group (IGL), Iperionx (IPX), Kingsgate Consolidated (KCN), Macmahon Holdings (MAH), Metals X (MLX), Macquarie Group (MQG), Maritana Minerals (MRT), Nexgen Energy (NXG), Paladin Energy (PDN), Polymetals (POL), Perenti (PRN), PYC Therapeutics (PYC), Ridley Corp (RIC), Rio Tinto (RIO), South32 (S32), WA1 Resources (WA1).
12 Randomly chosen Feature Downtrend Charts:
Important considerations for using the ChartWatch Daily ASX Scans
1. For more information on Carl's trend following information, check out his Technical analysis for beginners: ChartWatch Primer. 2. The future is unknown: Anything can happen to change the trends in the lists above. A stock in a perfect uptrend or downtrend may not remain that way by the next trading today. 3. These lists are not exhaustive, they are carefully curated by Carl. You will find that certain stocks might not appear in a particular list on consecutive days but might reappear when Carl feels it deserves to return to the list. 4. This is not a recommendation service, merely an aid to help you better understand the workings of Carl’s technical analysis model in a practical way. Carl will not alert you to stocks that have dropped off a list because their trend has changed – it's up to you to apply the criteria to determine why a particular stock might not still be included. 5. This is general, educational information only – so always do your own research!!!