
News | Market Wraps
Evening Wrap: ASX 200's gain hides heavy selling into new high, as property stocks prosper and uranium stocks plunge
The S&P/ASX 200 closed 4.9 points higher, up 0.06%.

Mentioned
The S&P/ASX 200 closed 4.9 points higher, up 0.06%.
There was a sense of déjà vu about today's new all-time high on the benchmark S&P/ASX 200 (note, the S&P/ASX 200 Total Return Index hit a new all time high back on 30-May).
The last time we made a new all-time high, it was Feb-14 Valentine's Day. But there was no love for Aussie investors on that day as sellers offloaded into opening strength, and sustained their selling all session. Feb-14's candle exhibited the deadly "long upward pointing shadow" that ChartWatch readers have grown to both respect and dread...😬
It was the exact-same scenario today. Sellers were lying in wait to gleefully pile out of stocks as the #FOMO and #YOLO crowd rushed in to buy the record open. The result? Another long upward pointing shadow ⚠️!
It's not the kind of emphatic close we'd ordinarily associate with a new high, and let's hope that this new high is not followed with the same post-high plunge experienced after the Valentine's Day one – caused by President Trump's trade war.
History might rhyme from time to time...but that doesn't mean it has to repeat...right!? 🤔
To make sense of all the above, I have detailed technical analysis on the Nasdaq Composite, S&P/ASX 200, and Uranium in today's ChartWatch.
Be sure to click/scroll through for the usual reporting of the major sector and stock-specific moves, the broker responses to them, as well as all the key upcoming economic data in tonight's Evening Wrap.
Let's dive in!
Today in Review
Wed 11 Jun 25, 5:05pm (AEST)
Name | Value | % Chg |
|---|---|---|
Major Indices | ||
| ASX 200 | 8,592.1 | +0.06% |
| All Ords | 8,819.6 | +0.08% |
| Small Ords | 3,250.9 | +0.05% |
| All Tech | 4,036.0 | -0.77% |
| Emerging Companies | 2,299.6 | -0.50% |
Currency | ||
| AUD/USD | 0.6524 | 0.00% |
US Futures | ||
| S&P 500 | 6,040.5 | +0.50% |
| Dow Jones | 42,881.0 | -0.07% |
| Nasdaq | 21,951.0 | +0.59% |
Name | Value | % Chg |
|---|---|---|
Sector | ||
| Real Estate | 4,004.7 | +0.90% |
| Energy | 8,236.0 | +0.77% |
| Materials | 16,607.2 | +0.63% |
| Consumer Staples | 12,501.3 | +0.29% |
| Communication Services | 1,847.3 | +0.27% |
| Consumer Discretionary | 4,161.9 | +0.06% |
| Industrials | 8,390.7 | +0.06% |
| Utilities | 9,217.2 | -0.07% |
| Financials | 9,405.3 | -0.15% |
| Health Care | 41,570.9 | -0.83% |
| Information Technology | 2,911.7 | -1.49% |
Markets
%20intraday%20chart%2011%20Jun%202025.png)
ASX 200 Session Chart
The S&P/ASX 200 (XJO) finished points higher at 8,592.1, 0.55% from its session high and just 0.05% from its low. Reflecting the narrow final gain on the benchmark index, in the broader-based S&P/ASX 300 (XKO) advancers beat decliners by a slender 142 to 136.
The Real Estate Investment Trusts (XPJ) (+0.89%) was the best performing sector today, likely in response to a strong gain from Metcash (MTS) (+3.7%), which continued to rise after its positive trading update yesterday.
%20chart%2011%20Jun%202025.png)
Real Estate Investment Trusts (XPJ) (click here for full size image)
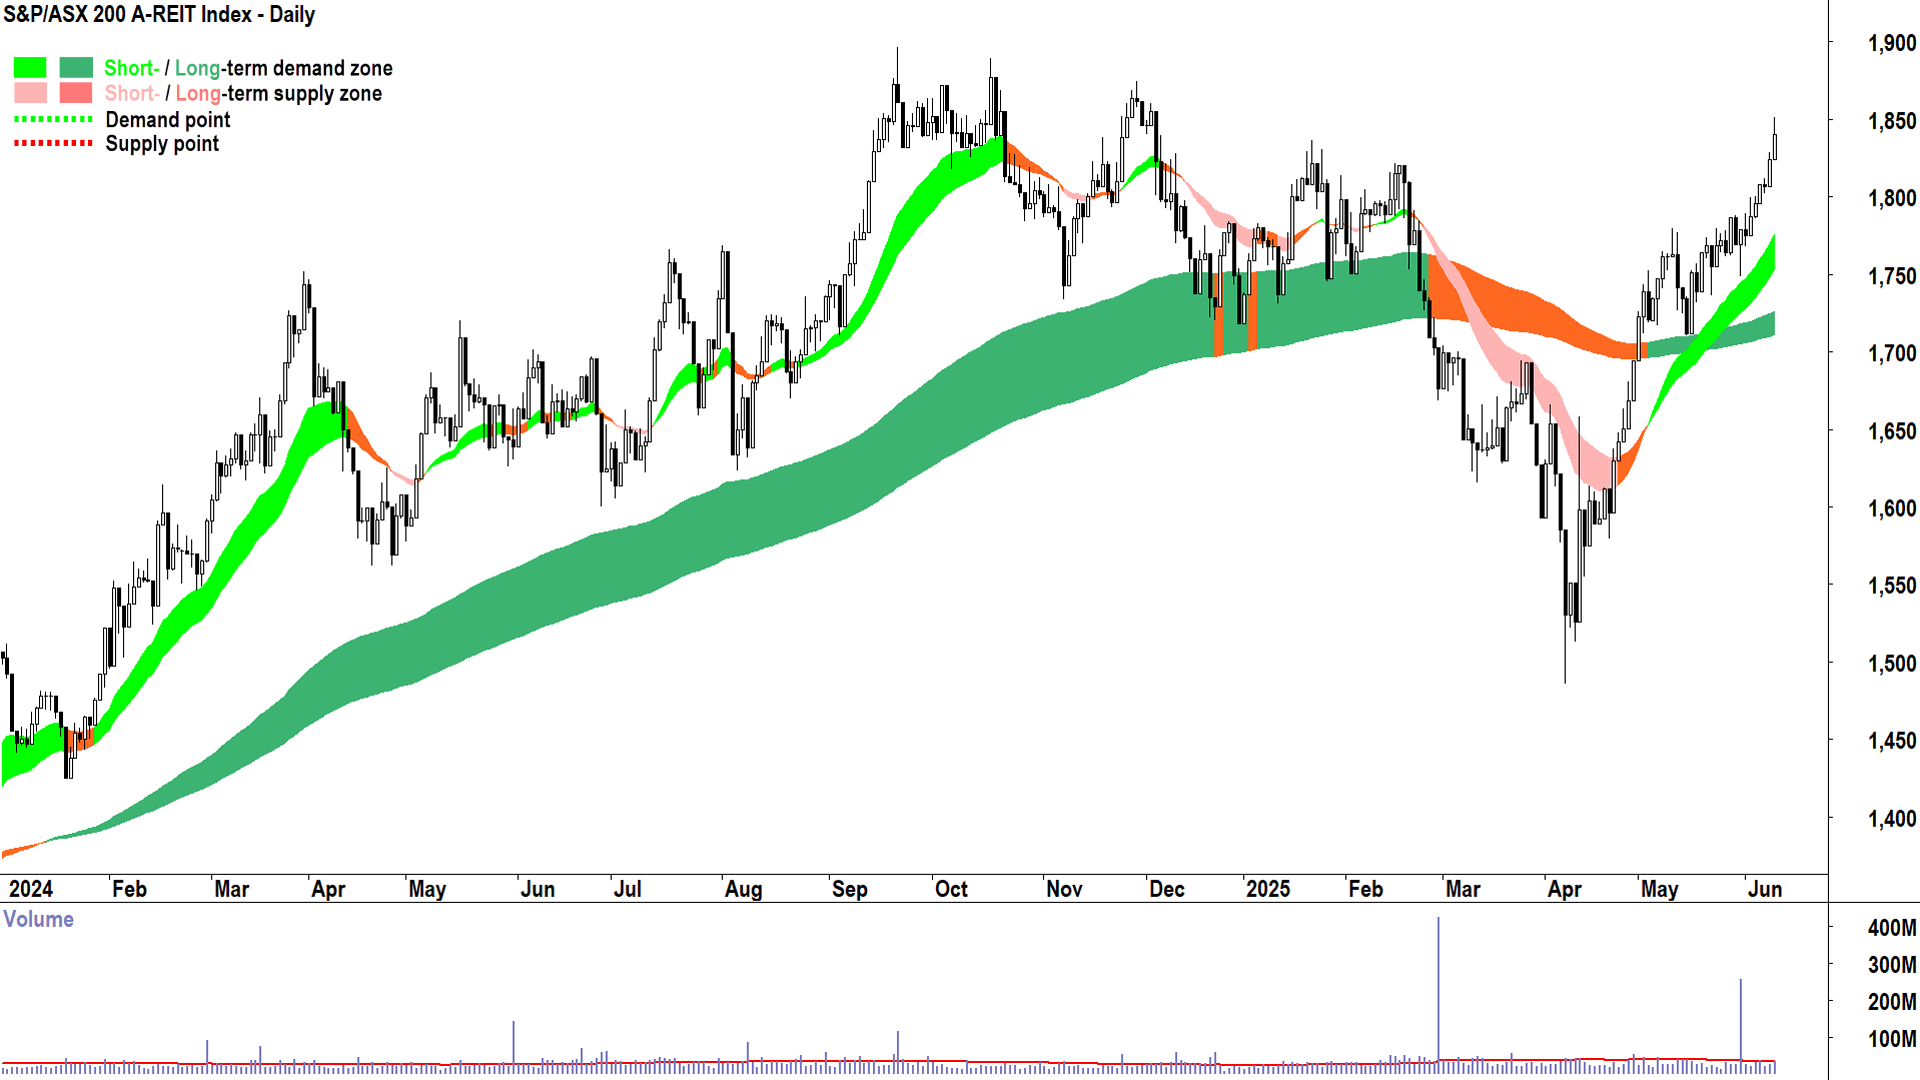
However, looking at the consistency of gains across the sector, one can’t help but conclude there’s also some fund rotational money moving in here. The general expectation (as per rhetoric in several broker reports I’ve read recently), is that interest rates are expected to fall and this will create a supportive environment for real estate stocks.
Energy (XEJ) (+0.77%) and Resources (XJR) (+0.67%) were also strong today, as hopes continued to grow of impending good news from the US-China trade negotiations. Woodside Energy (WDS) (+1.5%) bolstered Energy, while BHP Group (BHP) (+1.5%) and Fortescue (FMG) (+3.4%) did the heavy lifting in Resources.
As for pockets, good and bad…Good goes to the ASX lithium sector. I could say that benchmark July lithium carbonate futures were over 1% higher on the GFEX exchange today, but I suggest stocks generally did much better than that (Liontown Resources (LTR) (+8.3%) and Pilbara Minerals (PLS) (+5.6%)). Again, with all this renewed focus on critical minerals, is lithium finally attracting some fund flows – be dammed of the horrific state of the lithium price? 🤔
As for bad, the reasons for the shellacking in uranium stocks is likely more apparent. Check today’s ChartWatch for details on the precarious state of the uranium price. Bannerman Energy (BMN) (-9.9%), Lotus Resources (LOT) (-8.6%) and Silex Systems (SLX) (-7.2%) were hardest hit.
Today's blue-chip winners:
Company | Last Price | Change $ | Change % | 1mo % | 1yr % |
|---|---|---|---|---|---|
Pilbara Minerals (PLS) | $1.425 | +$0.075 | +5.6% | -7.8% | -62.1% |
Metcash (MTS) | $3.64 | +$0.13 | +3.7% | +9.3% | -5.2% |
Fortescue (FMG) | $16.21 | +$0.54 | +3.4% | +0.2% | -32.6% |
Mineral Resources (MIN) | $25.71 | +$0.79 | +3.2% | +12.7% | -62.9% |
Stockland (SGP) | $5.66 | +$0.16 | +2.9% | +1.1% | +23.3% |
IGO (IGO) | $4.37 | +$0.11 | +2.6% | +0.2% | -36.3% |
Vicinity Centres (VCX) | $2.54 | +$0.06 | +2.4% | +5.0% | +31.9% |
Light & Wonder (LNW) | $138.11 | +$2.84 | +2.1% | +4.7% | -7.7% |
Dexus (DXS) | $7.07 | +$0.13 | +1.9% | -5.9% | +1.4% |
Woodside Energy Group (WDS) | $23.52 | +$0.43 | +1.9% | +13.1% | -13.2% |
GPT Group (GPT) | $4.96 | +$0.09 | +1.8% | +5.8% | +14.6% |
Mirvac Group (MGR) | $2.39 | +$0.04 | +1.7% | +1.7% | +19.8% |
James Hardie Industries (JHX) | $41.61 | +$0.69 | +1.7% | +8.3% | -10.0% |
BHP Group (BHP) | $39.05 | +$0.57 | +1.5% | +1.7% | -11.4% |
Aristocrat Leisure (ALL) | $65.42 | +$0.85 | +1.3% | -2.4% | +41.3% |
Car Group (CAR) | $36.60 | +$0.4 | +1.1% | +3.6% | +1.8% |
Lendlease Group (LLC) | $5.78 | +$0.06 | +1.0% | +5.7% | -1.7% |
Today's blue-chip losers:
Company | Last Price | Change $ | Change % | 1mo % | 1yr % |
|---|---|---|---|---|---|
Lynas Rare Earths (LYC) | $8.60 | -$0.77 | -8.2% | +12.4% | +29.7% |
IDP Education (IEL) | $3.56 | -$0.18 | -4.8% | -63.9% | -75.5% |
Bluescope Steel (BSL) | $22.44 | -$1.09 | -4.6% | -3.0% | +6.4% |
Technology One (TNE) | $41.00 | -$1.61 | -3.8% | +29.7% | +126.0% |
Paladin Energy (PDN) | $6.43 | -$0.18 | -2.7% | -1.1% | -58.5% |
Life360 (360) | $32.06 | -$0.79 | -2.4% | +34.4% | +118.2% |
Xero (XRO) | $187.75 | -$4.35 | -2.3% | +9.5% | +46.5% |
Block (XYZ) | $98.98 | -$1.53 | -1.5% | +23.4% | +0.8% |
Telix Pharmaceuticals (TLX) | $25.59 | -$0.39 | -1.5% | +4.6% | +43.0% |
The A2 Milk Company (A2M) | $8.11 | -$0.12 | -1.5% | -2.2% | +13.3% |
Pro Medicus (PME) | $279.35 | -$4.13 | -1.5% | +9.9% | +128.0% |
CSL (CSL) | $240.85 | -$3.28 | -1.3% | +2.4% | -16.8% |
Orora (ORA) | $1.855 | -$0.025 | -1.3% | -2.4% | -15.3% |
Qantas Airways (QAN) | $10.50 | -$0.14 | -1.3% | +6.6% | +70.5% |
Downer EDI (DOW) | $6.06 | -$0.08 | -1.3% | -1.3% | +26.3% |
Qube (QUB) | $4.29 | -$0.05 | -1.2% | +1.2% | +16.6% |
QBE Insurance Group (QBE) | $23.43 | -$0.24 | -1.0% | +4.2% | +27.3% |
Newmont Corporation (NEM) | $80.80 | -$0.82 | -1.0% | -0.1% | +30.7% |
ChartWatch
NASDAQ Composite Index

Staying the course on the Comp 📈✅ (click here for full size image)
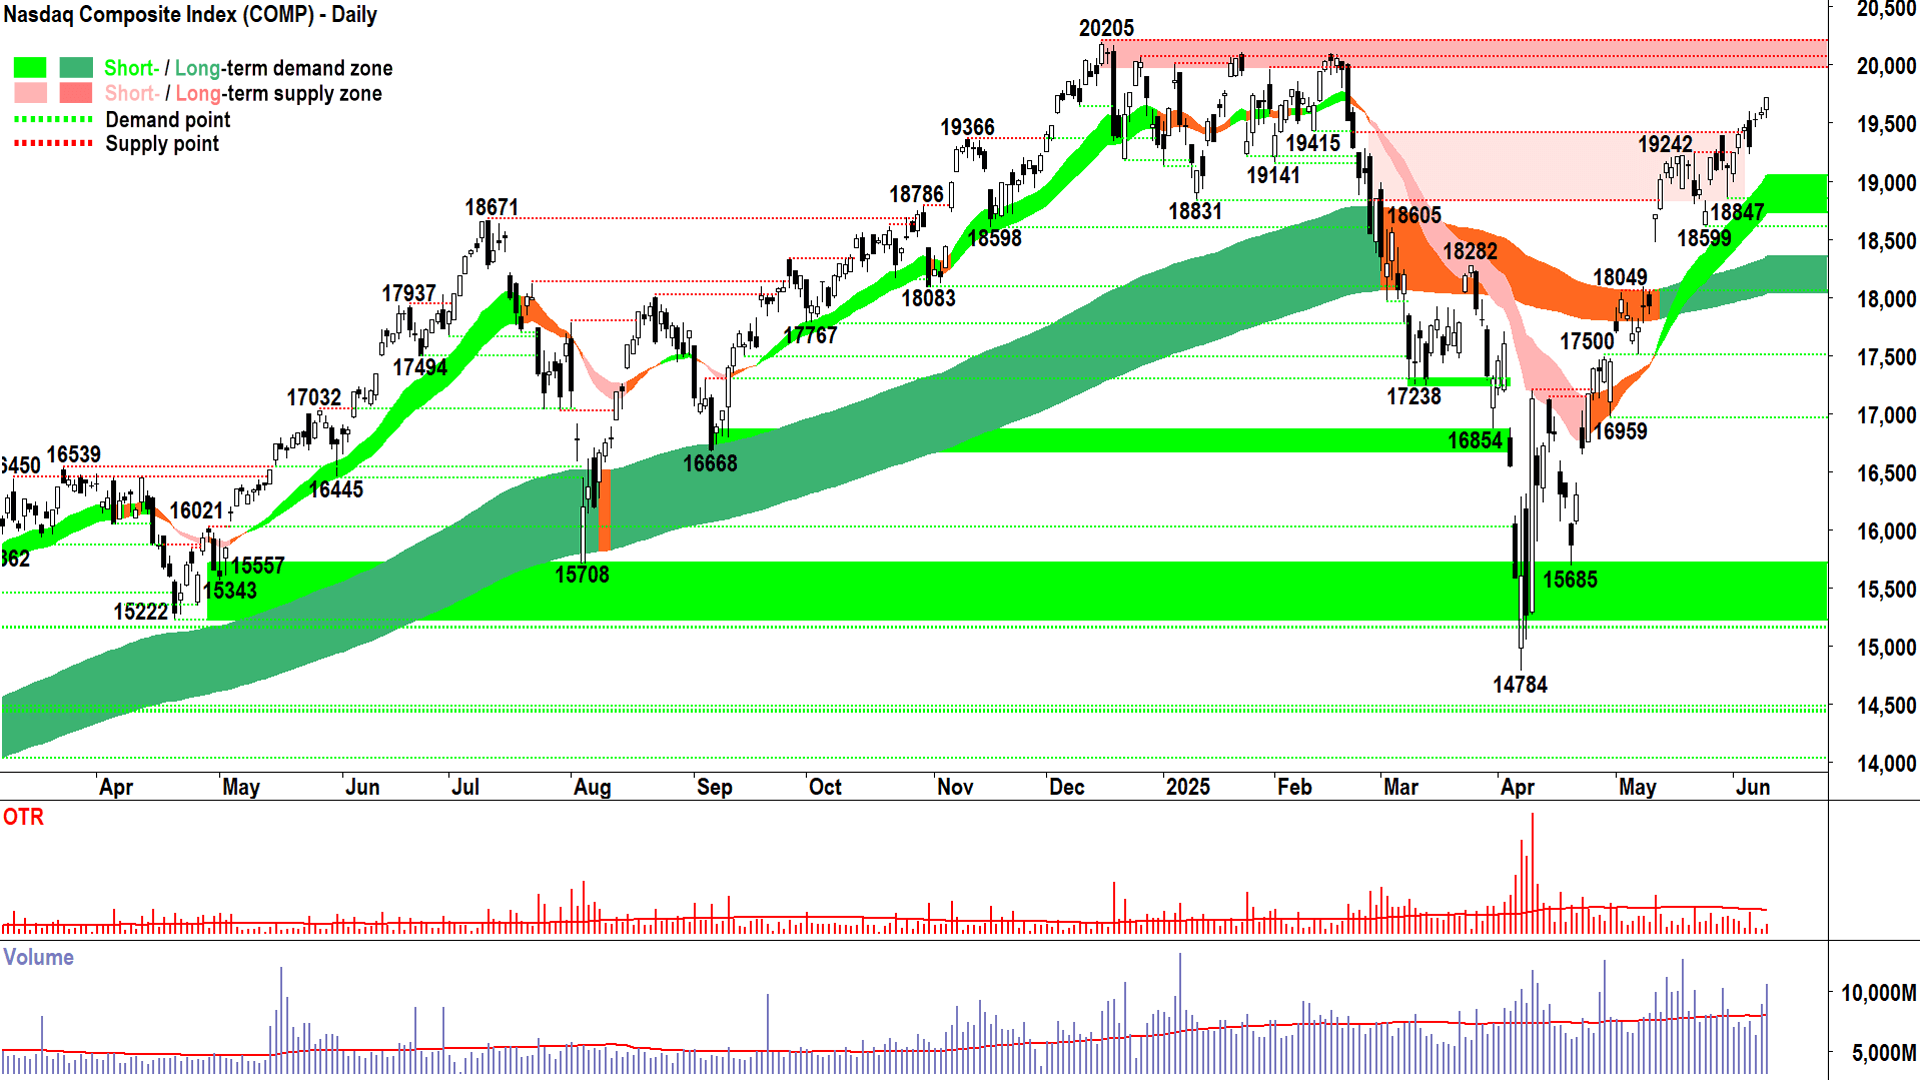
Steady as she goes…edging towards a potential date with the 20205 major (major, major!) point of supply.
Tuesday’s candle is perfectly in-line with the analysis that’s been presented here for weeks now – the demand-side is in control of the Comp price.
It is modest in size, but the downward pointing shadow demonstrates buy the dip activity, and along with the white body and close right on the candle’s high, confirms sustained excess demand throughout the session.
As do:
✅ Rising trend ribbons that continue to act as zones of dynamic excess demand
✅ Price action that demonstrates demand reinforcement and supply removal (i.e., rising peaks and rising troughs)
✅ The broader predominance of demand-side candles (i.e., white-bodied and or with downward pointing shadows) that demonstrates pervasive buy the dip activity and accumulation.
The short term trend ribbon is the critical demand zone – and I propose that the short term uptrend remains intact until the Comp closes below it. I’d also be concerned if we were to see prior to this event the occurrence of substantial supply-side candles (i.e., long black-bodied and or long upward pointing shadow) – particularly near or above 20,000 and into 20205. This would signal that this zone is indeed a formidable area of excess supply.
Until then, there’s not a shred of evidence to suggest anything but staying the course on the Comp 📈✅.
S&P/ASX 200 (XJO)
%20chart%2011%20Jun%202025.png)
Déjà vu 😭 (click here for full size image)
Did you experience a sense of déjà vu today? 🤔
A highly anticipated new XJO high…the excitement and buzz…the wave of #FOMO and #YOLO? 🥳
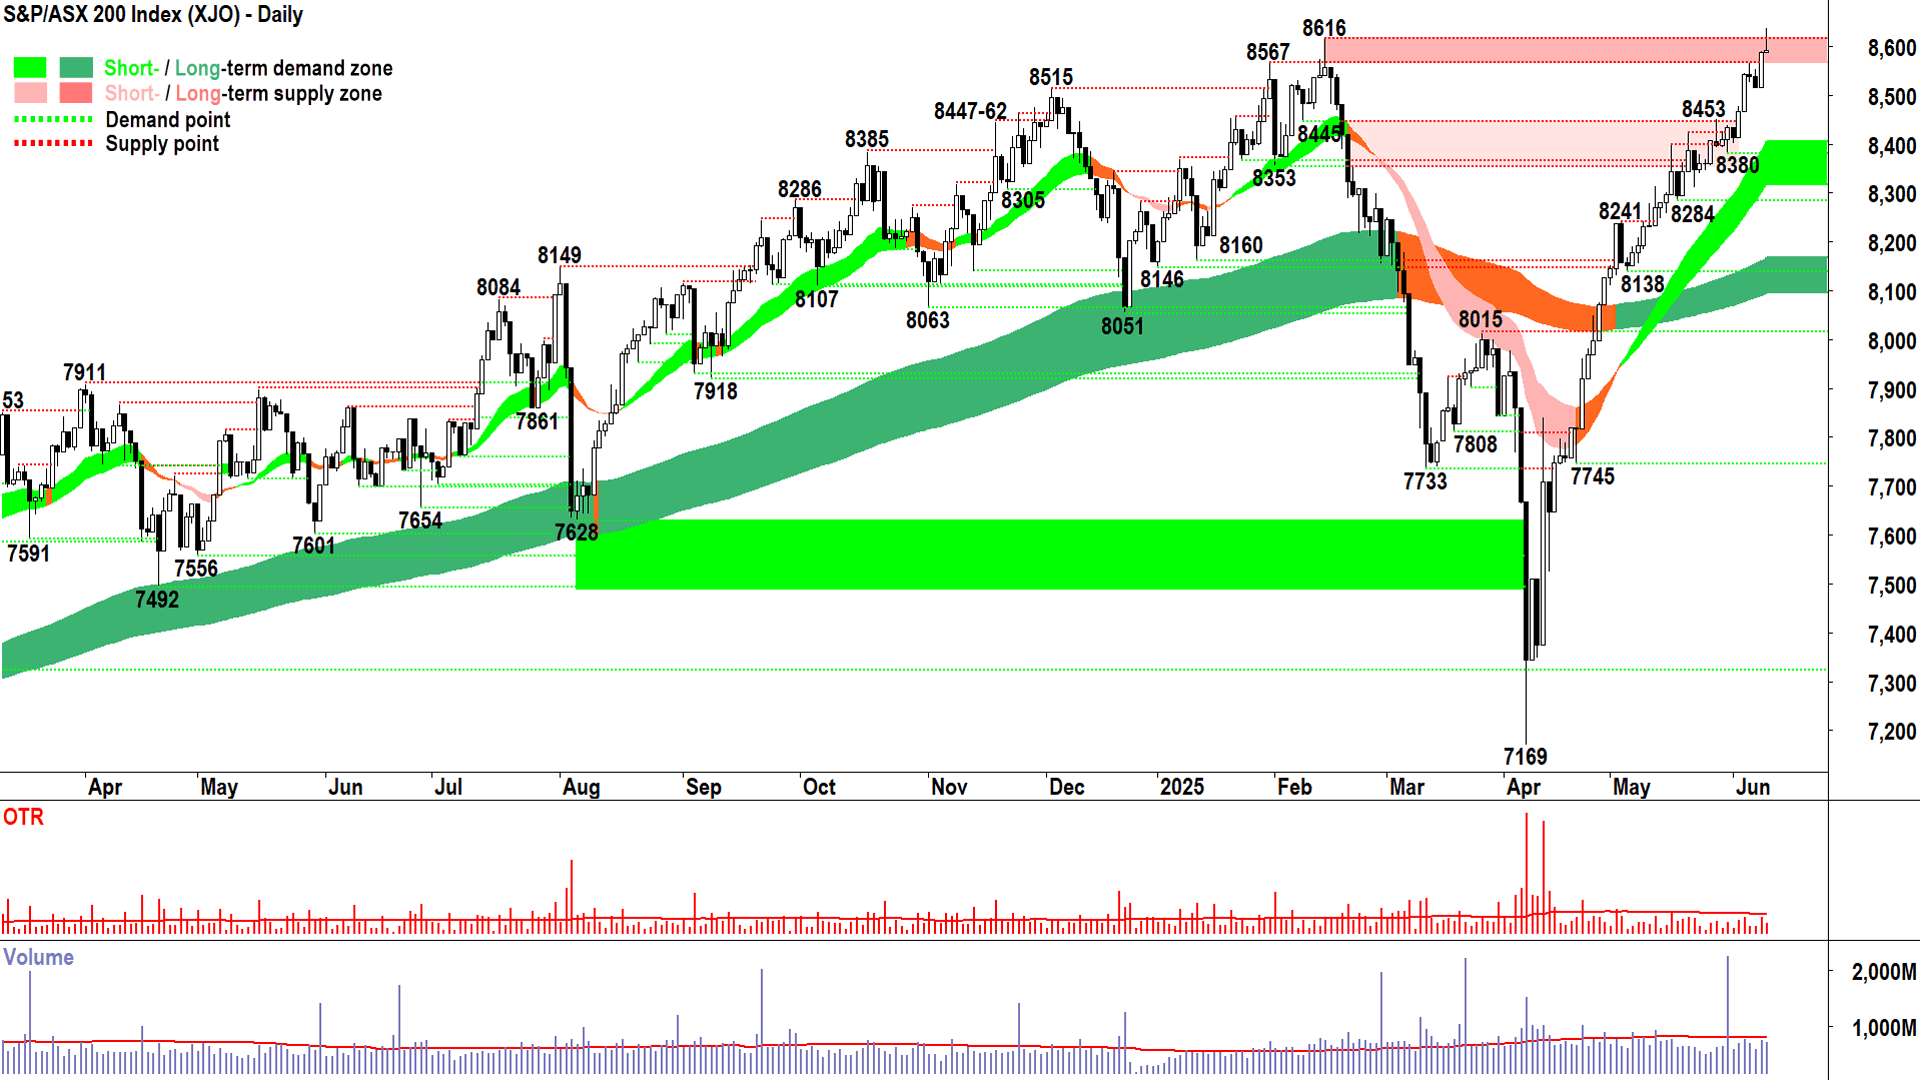
Yet, much like on Valentine’s Day, what we got from about 15 minutes post-open was steady and deliberate selling. The supply side was waiting for this.
And the demand-side had little after the open to prevent them for grinding back prices.
For us candlestick technicians, we know that today’s long upward shadow is a signal of supply-side control…of sell the rally activity. It’s the opposite of healthy buy the dip bull market activity.
As much as we can put today’s price action down to, “Well that’s just the ASX 200, that’s just what we do at new highs…We don’t do emphatic, kick-ass new highs like the Americans do…Noooo, we need to flop over the line and then painfully dissolve back below it…New highs by a thousand cuts…so to speak” 🤦.
But that would make us boring cynics, wouldn’t it? 🤷
I have a saying: “One supply-side candle does not a reversal make.”
Everything else about the XJO’s trends and price action is spot on, and it has been that way for some time now. Today’s candle is not enough in itself to require any counter measures.
Sure, it could be the start of something sinister – heck, look what happened after the identical occurrence back on Feb 14…but no, we will give it the benefit of the doubt for now.
That’s right…We’re going to wait for confirmation one way or the other. Either the supply-side builds on its first shot across the bough of supplying into new highs (i.e., distribution), or the demand-side soaks up these non-believers quickly enough and the price resumes its prevailing trends.
In conclusion, I’m sitting on my hands for now. I’ve extracted my anti-cynicism pills from the medicine cabinet. Nope, I'm hoping…no, stuff that…I’m expecting we’ll get the right result here (a proper move beyond 8616).
(But I’m also unfortunately all too aware that we could get the opposite 😭!)
Confirmation we want to see 🤞:
Long demand-side candles, rising peaks and rising troughs (preferably a trough set above 8616), continued support from the short term uptrend ribbon.
Confirmation we don’t want to see ⚠️:
Long supply-side candles, setting of a lower peak below today’s new high of 8640 or a close below 8380 (i.e., the last trough), close below the short term uptrend ribbon (presently approx. 8320).
(You all know how many times I’ve typed “8616” since Valentine’s Day! Please market gods, don’t let it be the case for “8640” 🙏!)
Uranium Futures (Front month, back-adjusted) COMEX
%20COMEX%20chart%2010%20Jun%202025.png)
Could get very bad, very quickly...😱 (click here for full size image)
The last time we covered uranium was in ChartWatch in the Evening Wrap on 5 June.
In that update, we reflected on prior calls that “the long term trend ribbon continues to pose a very real threat to this still-fledgling short term uptrend”, but also noted that “It is not uncommon to see the price action compress around known and expected significant zones of supply”.
Basically, compression in the price action around the super-important delineator of the present bear and (potentially) future bull market is not surprising.
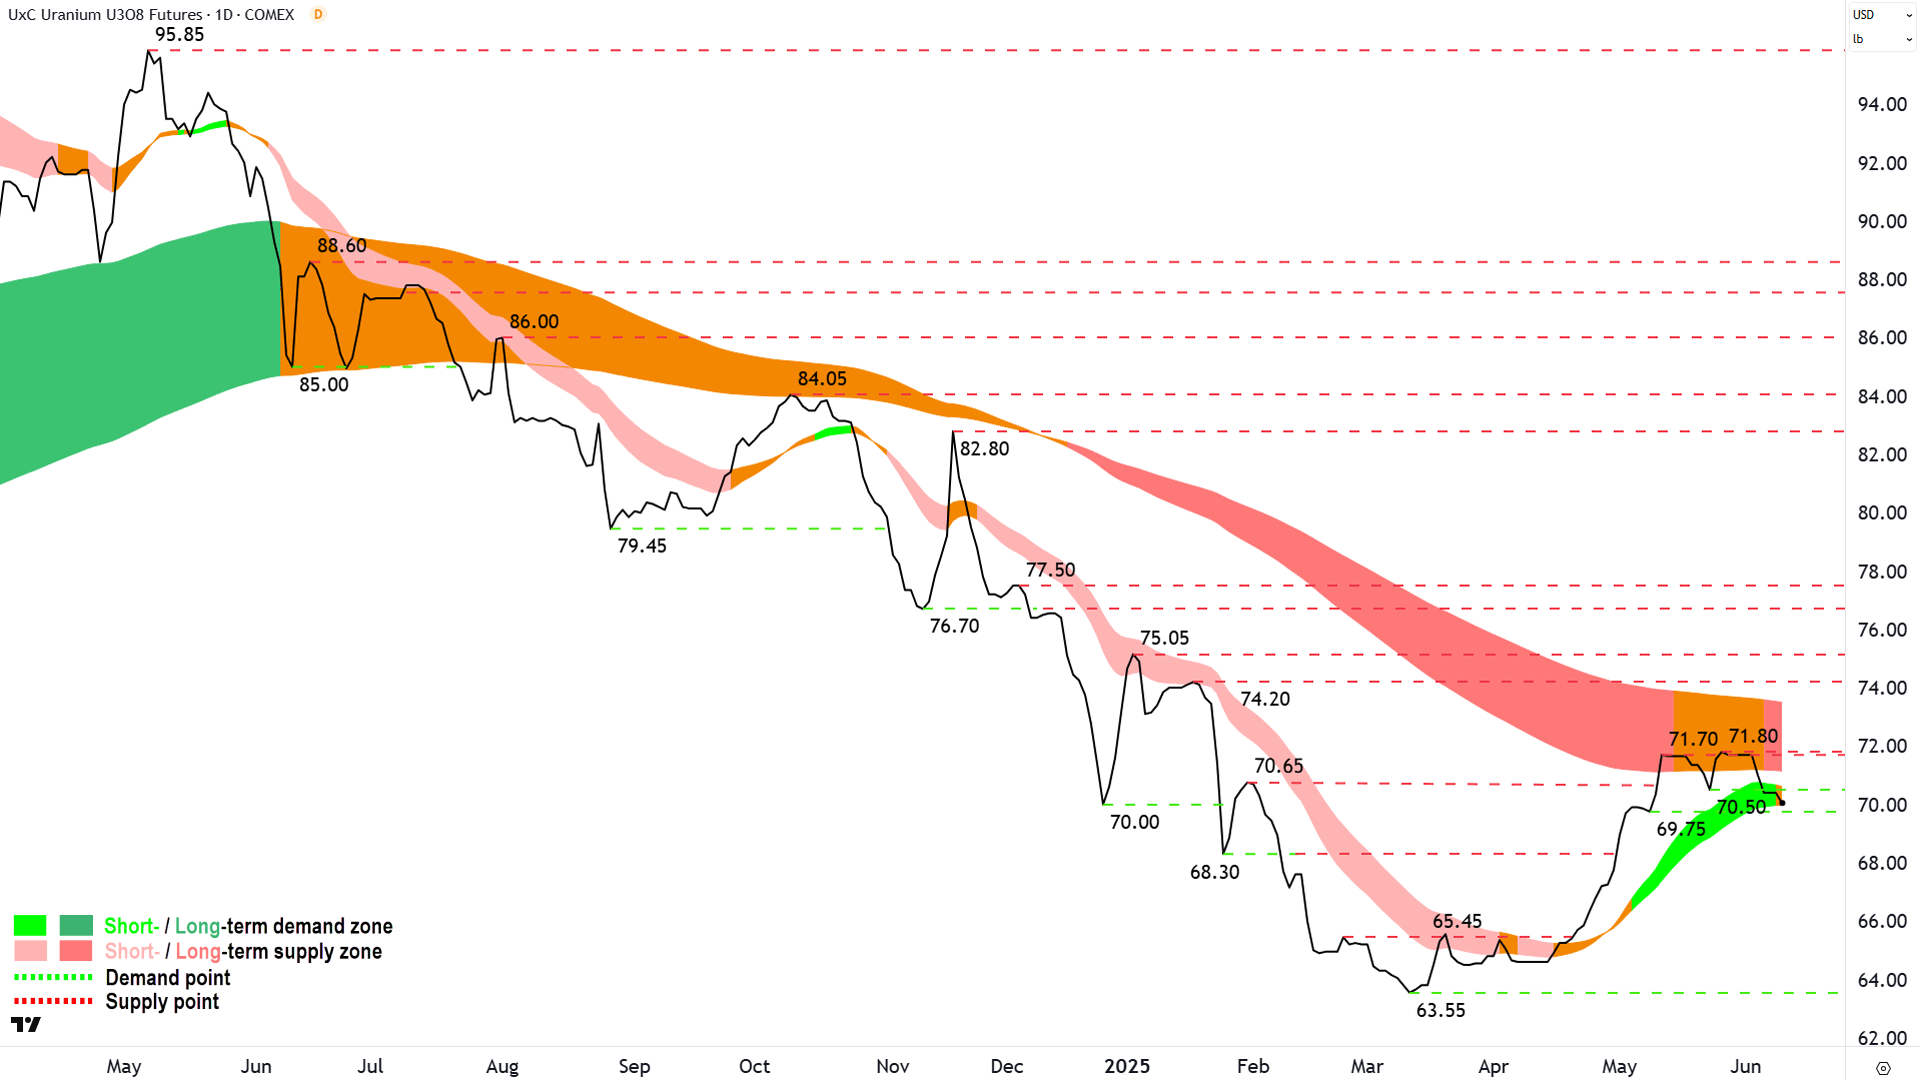
However, with Tuesday’s move it’s growing increasingly likely that the uranium price could lose its battle with the dynamic excess supply of the long term trend ribbon – at least for now.
In that last update, we also noted that “If we see a quick bounce off the short term uptrend ribbon – now clearly the critical zone of dynamic excess demand going forward – then there’s every chance we can clear out the supply at 71.70-71.80 and have another go at defeating that pesky long term trend ribbon.”
Tuesday’s close of 70.05 destroyed the 70.50 point of demand and sees the uranium price flirting dangerously close to the bottom of the short term uptrend ribbon at 69.97. Note also, the short term uptrend ribbon has neutralised (amber), and as if to rub salt into the wounds for uranium bulls, the long term downtrend ribbon has re-established (dark pink) = ❌❌❌.
A close below the short term trend ribbon and 69.75 would likely seal the deal on a roll that would re-establish the long term downtrend, and likely probe the 65.55 point of demand.
I’m prepared to give uranium a couple more sessions to stop the rot – to turn sharply higher and push back into the long term downtrend ribbon. Ultimately though, only a close above 71.80 can put the odds back in favour of a new uranium bull market.
Anything more than a couple of sessions – let’s say by Friday’s close – then we could be watching the establishment of a slow motion train wreck of uranium’s 2025 bull market chances ⚠️.
Economy
Today
There weren't any major data releases in our time zone today
Later this week
Wednesday
22:30 USA Core Consumer Price Index (CPI) May (+0.3% m/m and +2.9% p.a. forecast vs +0.2% m/m and +2.8% p.a. in April)
Thursday
03:01 USA 10-year Bond Auction (US$39 billion forecast for auction, May's high yield 4.34% p.a. and 2.6x bid-cover ratio)
11:00 AUS MI Inflation Expectations (+4.1% p.a. previous)
22:30 USA Core Producer Price Index (PPI) May (+0.3% m/m vs -0.4% m/m and +2.8% p.a. in April)
Friday
03:01 USA 30-year Bond Auction (US$22 billion forecast for auction, May's high yield 4.82% p.a. and 2.3x bid-cover ratio)
Saturday
00:00 USA Prelim UoM Consumer Sentiment June (52.5 forecast vs 52.2 in May)
00:00 USA Prelim UoM Inflation Expectations June (+6.6% p.a. previous)
Latest News
Interesting Movers
Trading higher
+17.7% Johns Lyng Group (JLG) – JLG Receives Conditional & Non-Binding Indicative Proposal.
+15.5% Zip Co. (ZIP) – Upgrade to FY25 guidance and May trading update, rise is consistent with prevailing short term uptrend and long term trend is transitioning from down to up, a recent regular in ChartWatch ASX Scans Uptrends list 🔎📈
+11.0% Monash IVF Group (MVF) – No news since 10-Jun Clinic Incident, brokers generally stuck with the stock in various updates today (see Broker Moves section for details), bounced in the wake of the recent sharp selloff.
+10.0% Fletcher Building (FBU) – Fletcher Building Receives Inquiries Amid Strategic Review.
+8.3% Liontown Resources (LTR) – No news, general strength across the broader Lithium sector today.
+8.3% The Star Entertainment Group (SGR) – No news 🤔.
+7.0% Brazilian Rare Earths (BRE) – No news, general strength across the broader Critical Minerals sector today.
+6.7% Ridley Corporation (RIC) – No news, rise is consistent with prevailing short and long term uptrends, a regular in ChartWatch ASX Scans Uptrends list 🔎📈
+5.9% Reece (REH) – No news, general strength across the broader Materials sector today.
+5.6% Pilbara Minerals (PLS) – Pilgangoora Mineral Resource Update and Becoming a substantial holder, general strength across the broader Lithium sector today, (Vanguard 5%).
+5.3% Rpmglobal (RUL) – No news, rise is consistent with prevailing short and long term uptrends, a regular in ChartWatch ASX Scans Uptrends list 🔎📈
+5.1% OFX Group (OFX) – No news 🤔.
+5.1% PWR Holdings (PWH) – Response to ASX Price Query.
+5.0% Firefly Metals (FFM) – No news since 10-Jun Highly successful $100m placement to drive growth.
+4.9% Develop Global (DVP) – No news, rise is consistent with prevailing short and long term uptrends, a regular in ChartWatch ASX Scans Uptrends list 🔎📈
+4.5% Cettire (CTT) – Ceasing to be a substantial holder (major shareholder, possibly one that was driving the price lower, has exited via a major block trade).
+4.1% MTM Critical Metals (MTM) – No news, general strength across the broader Critical Minerals sector today, rise is consistent with prevailing short and long term uptrends, a regular in ChartWatch ASX Scans Uptrends list 🔎📈
+3.9% Eroad (ERD) – No news, rise is consistent with prevailing short and long term uptrends, a regular in ChartWatch ASX Scans Uptrends list 🔎📈
+3.7% Metcash (MTS) – Continued positive response to 10-Jun Further strengthening of Hardware pillar / Earnings update, several positive broker reports today including several large price target increases (see Broker Moves for details), rise is consistent with prevailing short term uptrend and long term trend is transitioning from down to up, a recent regular in ChartWatch ASX Scans Uptrends list 🔎📈
+3.7% Reliance Worldwide Corporation (RWC) – No news, general strength across the broader Materials sector today.
Trading lower
-21.0% Dateline Resources (DTR) – No news since 10-Jun U.S. Government Support for Colosseum Rare Earths, today's move is consistent with recent volatility.
-13.5% Austin Engineering (ANG) – FY25 Trading Update, fall is consistent with prevailing short and long term downtrends, a regular in ChartWatch ASX Scans Downtrends list 🔎📉
-10.0% 4DS Memory (4DS) – No news, today's move is consistent with recent volatility.
-9.9% Bannerman Energy (BMN) – No news, general weakness across the broader Uranium sector today, uranium price lower overnight (see ChartWatch for details).
-8.6% AMA Group (AMA) – No news 🤔.
-8.6% Lotus Resources (LOT) – No news, general weakness across the broader Uranium sector today, fall is consistent with prevailing short and long term downtrends, a regular in ChartWatch ASX Scans Downtrends list 🔎📉
-8.2% Lynas Rare Earths (LYC) – No news 🤔.
-8.2% Electro Optic Systems (EOS) – No news 🤔.
-7.5% Beach Energy (BPT) – No news, downgraded to neutral from buy at UBS and price target cut to $1.350 from $1.400, fall is consistent with prevailing short and long term downtrends 🔎📉
-7.4% Predictive Discovery (PDI) – No news 🤔.
-7.2% Silex Systems (SLX) – No news, general weakness across the broader Uranium sector today.
-6.7% Clarity Pharmaceuticals (CU6) – No news, fall is consistent with prevailing short and long term downtrends 🔎📉
-6.0% Perseus Mining (PRU) – Perseus Mining Announces 5 Year Gold Production Outlook and 5 Year Gold Production Outlook Webinar Presentation, general weakness across the broader Precious Metals sector today.
-5.9% Adriatic Metals (ADT) – General weakness across the broader Precious Metals sector today.
-0.1% Botanix Pharmaceuticals (BOT) – No news since 10-Jun Botanix Signs Debt Facility with Kreos Capital, fall is consistent with prevailing short and long term downtrends, a recent regular in ChartWatch ASX Scans Downtrends list 🔎📉
-4.8% BetaShares Global Uranium ETF (URN) – No news, uranium miners ETF.
-4.8% IDP Education (IEL) – No news, fall is consistent with prevailing short and long term downtrends, one of the most Featured (highest conviction) stocks in ChartWatch ASX Scans Downtrends list 🔎📉
Broker Moves
AMA Group (AMA)
Retained at buy at Bell Potter; Price Target: $0.120 from $0.100
Beach Energy (BPT)
Downgraded to neutral from buy at UBS; Price Target: $1.350 from $1.400
Breville Group (BRG)
Retained at outperform at Macquarie; Price Target: $40.20 from $41.10
Catapult Group International (CAT)
Retained at hold at Bell Potter; Price Target: $6.00 from $5.00
Coronado Global Resources (CRN)
Retained at neutral at Macquarie; Price Target: $0.190 from $0.250
Clarity Pharmaceuticals (CU6)
Retained at speculative buy at Bell Potter; Price Target: $4.90 from $5.20
Caravel Minerals (CVV)
Retained at speculative buy at Canaccord Genuity; Price Target: $0.620 from $0.600
Cygnus Metals (CY5)
Retained at speculative buy at Canaccord Genuity; Price Target: $0.300
Retained at buy at Shaw and Partners; Price Target: $0.250
DGL Group (DGL)
Retained at neutral at UBS; Price Target: $0.470 from $0.530
Firefly Metals (FFM)
Retained at outperform at Macquarie; Price Target: $1.550 from $1.600
Imricor Medical Systems (IMR)
Retained at speculative buy at Morgans; Price Target: $2.28
Metcash (MTS)
Retained at buy at Citi; Price Target: $3.70
Retained at outperform at CLSA; Price Target: $4.30 from $4.10
Retained at hold at Jefferies; Price Target: $3.80 from $3.40
Retained at overweight at JP Morgan; Price Target: $4.40 from $4.20
Upgraded to outperform from neutral at Macquarie; Price Target: $3.70 from $3.30
Retained at buy at UBS; Price Target: $4.00 from $3.50
Monash IVF Group (MVF)
Retained at buy at Jefferies; Price Target: $1.050 from $1.250
Retained at outperform at Macquarie; Price Target: $1.300
Retained at sector perform at RBC Capital Markets; Price Target: $1.000
Retained at overweight at Wilsons; Price Target: $1.250
National Storage Reit (NSR)
Retained at outperform at Citi; Price Target: $2.70
Nextdc (NXT)
Retained at buy at Morgans; Price Target: $18.80
Retained at buy at Ord Minnett; Price Target: $18.00
Retained at buy at UBS; Price Target: $20.20 from $19.80
Platinum Asset Management (PTM)
Retained at sell at UBS; Price Target: $0.500
Qantas Airways (QAN)
Retained at sector perform at RBC Capital Markets; Price Target: $9.75
Redox (RDX)
Upgraded to accumulate from hold at Ord Minnett; Price Target: $2.68 from $2.85
Rio Tinto (RIO)
Retained at neutral at Citi; Price Target: $130.00
Retained at buy at Ord Minnett; Price Target: $126.00
Retained at sector perform at RBC Capital Markets; Price Target: $110.00
Siteminder (SDR)
Initiated at outperform at Macquarie; Price Target: $6.09
Service Stream (SSM)
Retained at buy at Citi; Price Target: $2.00
Super Retail Group (SUL)
Retained at buy at Citi; Price Target: $16.50
Suncorp Group (SUN)
Retained at neutral at Citi; Price Target: $22.40 from $20.00
Transurban Group (TCL)
Retained at neutral at Citi; Price Target: $14.30
Telstra Group (TLS)
Retained at accumulate at Ord Minnett; Price Target: $5.00
Whitehaven Coal (WHC)
Retained at buy at Ord Minnett; Price Target: $7.70
Scans
Top Gainers
Code | Company | Last | % Chg |
|---|---|---|---|
| REZ | Resources & Energy Group Ltd | $0.018 | +38.46% |
| PLY | Playside Studios Ltd | $0.20 | +37.93% |
| SLA | Solara Minerals Ltd | $0.195 | +25.81% |
| OLY | Olympio Metals Ltd | $0.036 | +24.14% |
| DAL | Dalaroo Metals Ltd | $0.042 | +23.53% |
Top Fallers
Code | Company | Last | % Chg |
|---|---|---|---|
| G50 | G50 Corp Ltd | $0.14 | -26.32% |
| DTR | Dateline Resources Ltd | $0.079 | -21.00% |
| VPR | Volt Group Ltd | $0.15 | -18.92% |
| FCT | Firstwave Cloud Technology Ltd | $0.013 | -18.75% |
| RAS | Ragusa Minerals Ltd | $0.013 | -18.75% |
52 Week Highs
Code | Company | Last | % Chg |
|---|---|---|---|
| NH3 | NH3 Clean Energy Ltd | $0.036 | +16.13% |
| EQX | Equatorial Resources Ltd | $0.16 | +14.29% |
| MPW | Metal Powder Works Ltd | $1.20 | +14.29% |
| LOC | Locate Technologies Ltd | $0.17 | +6.25% |
| DCC | Digitalx Ltd | $0.082 | +5.13% |
52 Week Lows
Code | Company | Last | % Chg |
|---|---|---|---|
| GAS | State GAS Ltd | $0.02 | -16.67% |
| OLH | Oldfields Holdings Ltd | $0.02 | -16.67% |
| ANG | Austin Engineering Ltd | $0.32 | -13.51% |
| RBX | Resource Base Ltd | $0.025 | -10.71% |
| DWG | Dataworks Group Ltd | $0.10 | -9.09% |
Near Highs
Code | Company | Last | % Chg |
|---|---|---|---|
| IHD | Ishares S&P/ASX DIV Opportunities Esg Screened ETF | $15.07 | +0.47% |
| CNEW | Vaneck China New Economy ETF | $7.09 | +1.00% |
| HVN | Harvey Norman Holdings Ltd | $5.43 | -0.91% |
| MVB | Vaneck Australian Banks ETF | $41.31 | +1.23% |
| MTO | Motorcycle Holdings Ltd | $2.58 | +4.03% |
Relative Strength Index (RSI) Oversold
Code | Company | Last | % Chg |
|---|---|---|---|
| IPG | Ipd Group Ltd | $3.00 | +1.70% |
| SDV | Scidev Ltd | $0.30 | -4.76% |
| DMP | Domino's PIZZA Enterprises Ltd | $21.37 | +1.57% |
| BBOZ | Betashares Aus Equities Strong Bear Complex ETF | $22.97 | 0.00% |
| AOF | Australian Unity Office Fund | $0.475 | -1.55% |
