News | Market Wraps
Evening Wrap: ASX 200 triple digit rebound rejoiced by investors as bets grow Energy and Mining stocks have finally bottomed
The S&P/ASX 200 closed 166.7 points higher, up 2.27%.

Mentioned
The S&P/ASX 200 closed 166.7 points higher, up 2.27%.
Pretty much everything went up today, for a change!
And it was much of the stuff that’s been hit the hardest in this downturn. You know – all the really cheap stuff now. "Cheap" of course is in the eye of the beholder...and beaten down Energy, Technology and Resources stocks were most beheld!
Lagging the pack, for very good reason, were defensive stocks from the Consumer Staples sector, as well as bond proxies like Utilities and Real Estate. The fact that bond proxies did it tough today is super important, and you'll have to read ChartWatch to find out why!
On that point, I have detailed technical analysis on the Nasdaq Composite, US 10-year T-Bond Yield, S&P/ASX 200, and Iron Ore in today's ChartWatch.
So, be sure to click/scroll through for the usual reporting of the major sector and stock-specific moves, the broker responses to them, as well as all the key upcoming economic data in tonight's Evening Wrap.
Let's dive in!
Today in Review
Tue 08 Apr 25, 4:59pm (AEST)
Name | Value | % Chg |
|---|---|---|
Major Indices | ||
| ASX 200 | 7,510.0 | +2.27% |
| All Ords | 7,704.4 | +2.39% |
| Small Ords | 2,833.3 | +2.98% |
| All Tech | 3,177.7 | +4.50% |
| Emerging Companies | 2,032.7 | +3.34% |
Currency | ||
| AUD/USD | 0.6062 | +1.27% |
US Futures | ||
| S&P 500 | 5,173.5 | +1.50% |
| Dow Jones | 38,883.0 | +1.88% |
| Nasdaq | 17,792.0 | +1.30% |
Name | Value | % Chg |
|---|---|---|
Sector | ||
| Information Technology | 2,145.0 | +4.63% |
| Energy | 6,860.2 | +4.06% |
| Consumer Discretionary | 3,619.4 | +3.24% |
| Health Care | 39,771.2 | +2.72% |
| Materials | 14,970.9 | +2.43% |
| Financials | 7,920.7 | +1.96% |
| Industrials | 7,531.9 | +1.84% |
| Communication Services | 1,653.8 | +1.79% |
| Real Estate | 3,390.7 | +1.46% |
| Consumer Staples | 12,011.0 | +1.33% |
| Utilities | 8,675.2 | +0.64% |
Markets

ASX 200 Session Chart
The S&P/ASX 200 (XJO) finished 166.7 points higher at 7,510.0, smack–bang on its session high. In the broader-based S&P/ASX 300 (XKO), advancers beat decliners by a resounding 258 to 25.
What a difference a day can make in the markets, and ain’t markets fickle!
Backing up from yesterday’s wipe out – but really a prolonged wipe out that’s been going on for weeks – we saw a near unanimous rise across the ASX today, and a decent one at that.
Importantly, we also achieved the all-important “close on the high”.
It suggests that the wall of excess demand persisted without fear, scooping up stocks without any supply-side impact on price – right until the closing bell. The theory behind such price action is that it suggests – all things being equal – the same excess demand will simply pick up where it left off tomorrow.
All things being equal.
That’s the kicker. Because it assumes no major hand grenades going off tonight in global markets – but that’s a big ask! 🙏
As for what went up, if I try to provide more specifics than “pretty much everything”, it was much of the stuff that’s been hit the hardest in this downturn. You know – all the really cheap stuff now (note how those last 5 words are dripping with trend follower sarcasm!).
So, Information Technology (XIJ) (+4.6%), Energy (XEJ) (+4.1%), and Consumer Discretionary (XDJ) (+3.2%) were in high demand, as were Resources (XJR) (+2.9%).
Within Resources, the Gold (XGD) sub-index (+4.5%), bounced sharply – making up all of yesterday's losses – one of the few sectors to do so (the XIJ and Communication Services (XTJ) (+1.8%) were the only other two – what does that say about their relative strength to the other sectors – and which sectors funds are potentially targeting first 🎯!?).
There were few stock-specific news drivers, nor relevant broader sector drivers (as you will see when you get to the Market Moves section below). It was just fund flows today. What was on the shopping list at these levels, and what wasn’t 📃.
On the latter item, what wasn’t high up the shopping list, I note defensives like Consumer Staples (XSJ) (+1.3%) lagged the pack – makes sense as we’re back to offence now…right 🤔? But so too did the interest rate sensitives / bond proxies of Utilities (XUJ) (+0.64%) and Real Estate Investment Trusts (XPJ) (+1.4%).
At least these made sense – or at least they will do when you read the US 10yr T-Bond write up in ChartWatch below.
ChartWatch
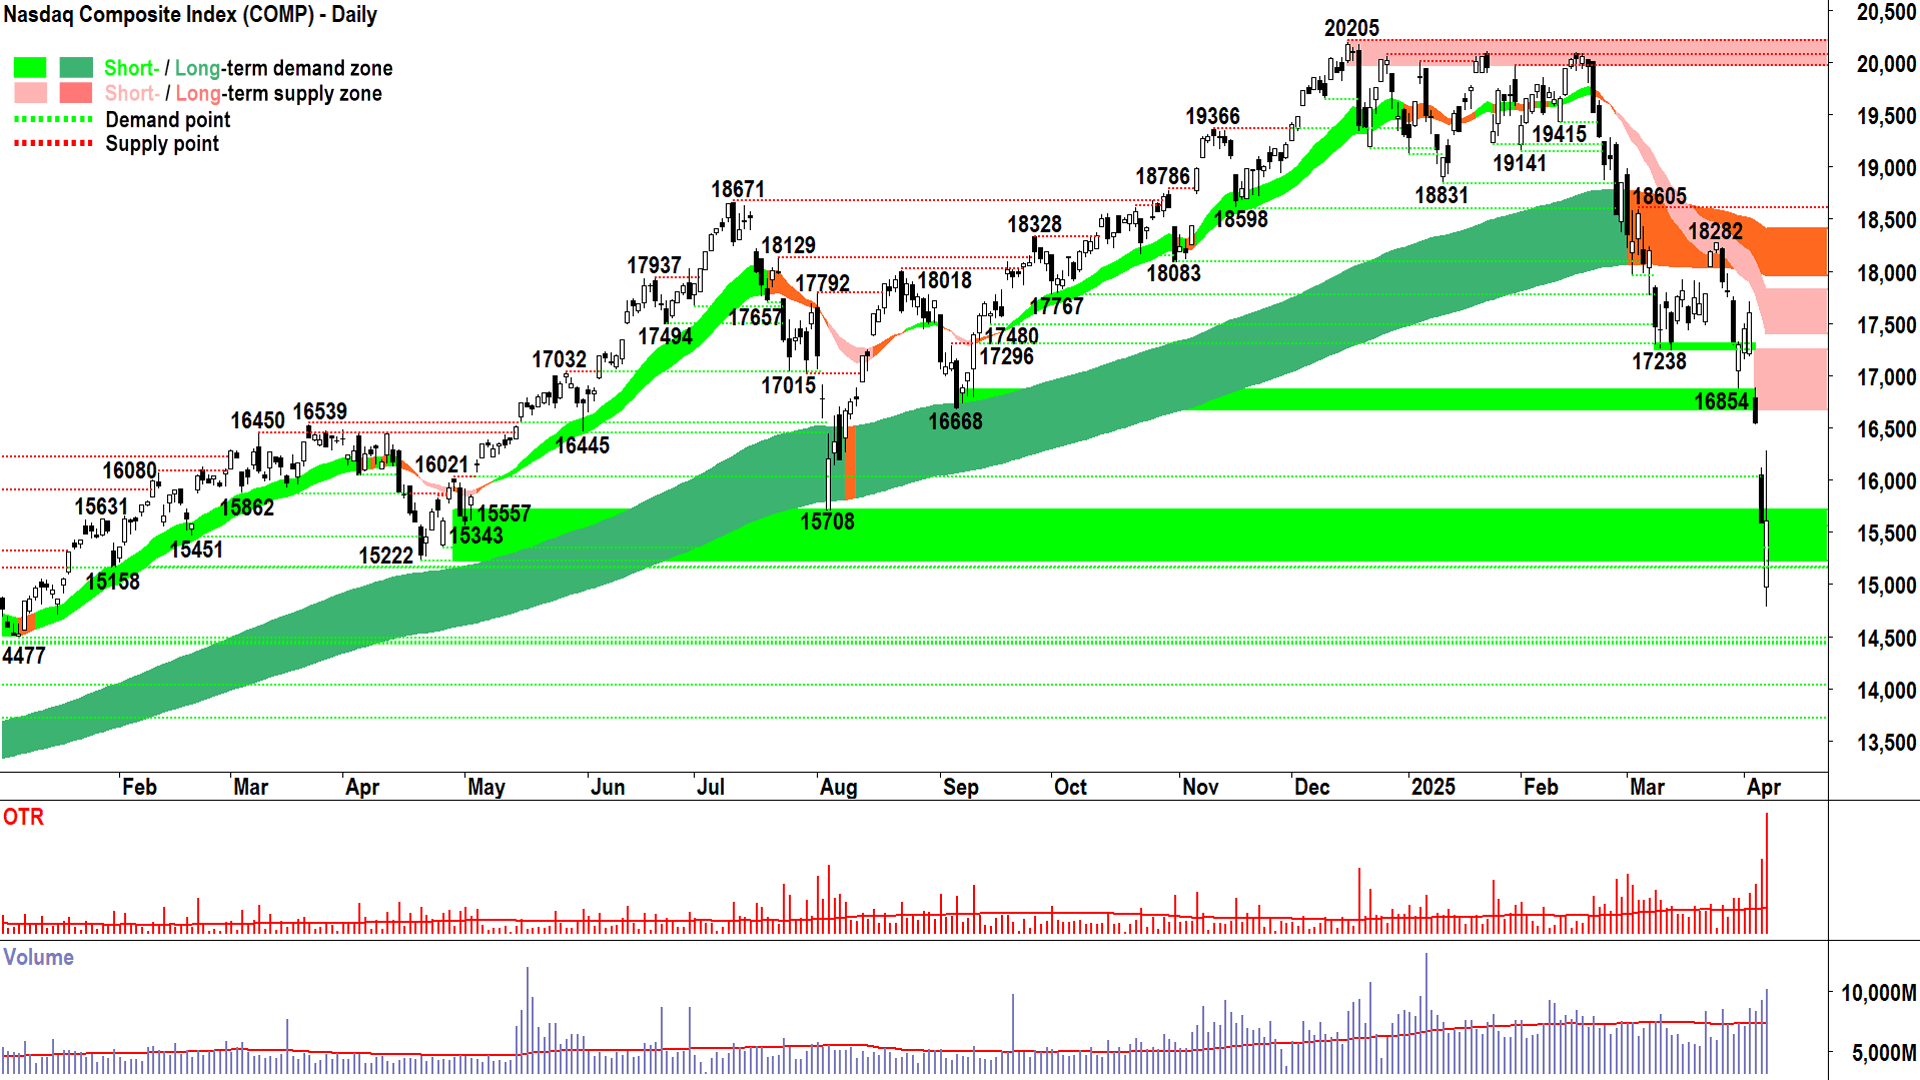
NASDAQ Composite Index

Shenanigans x 💯! (click here for full size image)
Not sure if you read Kerry’s article about the tweet that blew up the market – but it was shenanigans on the Comp last night (hahaha…yeah…for a change…right!?).
So, we have a bit of a dodgy upward pointing shadow that I’m not sure how to process. Is it real? Does it mean anything (because upward pointing shadows are one of our tried and true “fingerprints of supply”, remember?
Yes, it’s real. That bits easy – if you can see it then it happened.
Does it mean anything? My gut says probably not. This stuff is more common than you think – as in fat fingers causing massive spikes one way or the other, resulting in largely and ultimately erroneous price action.

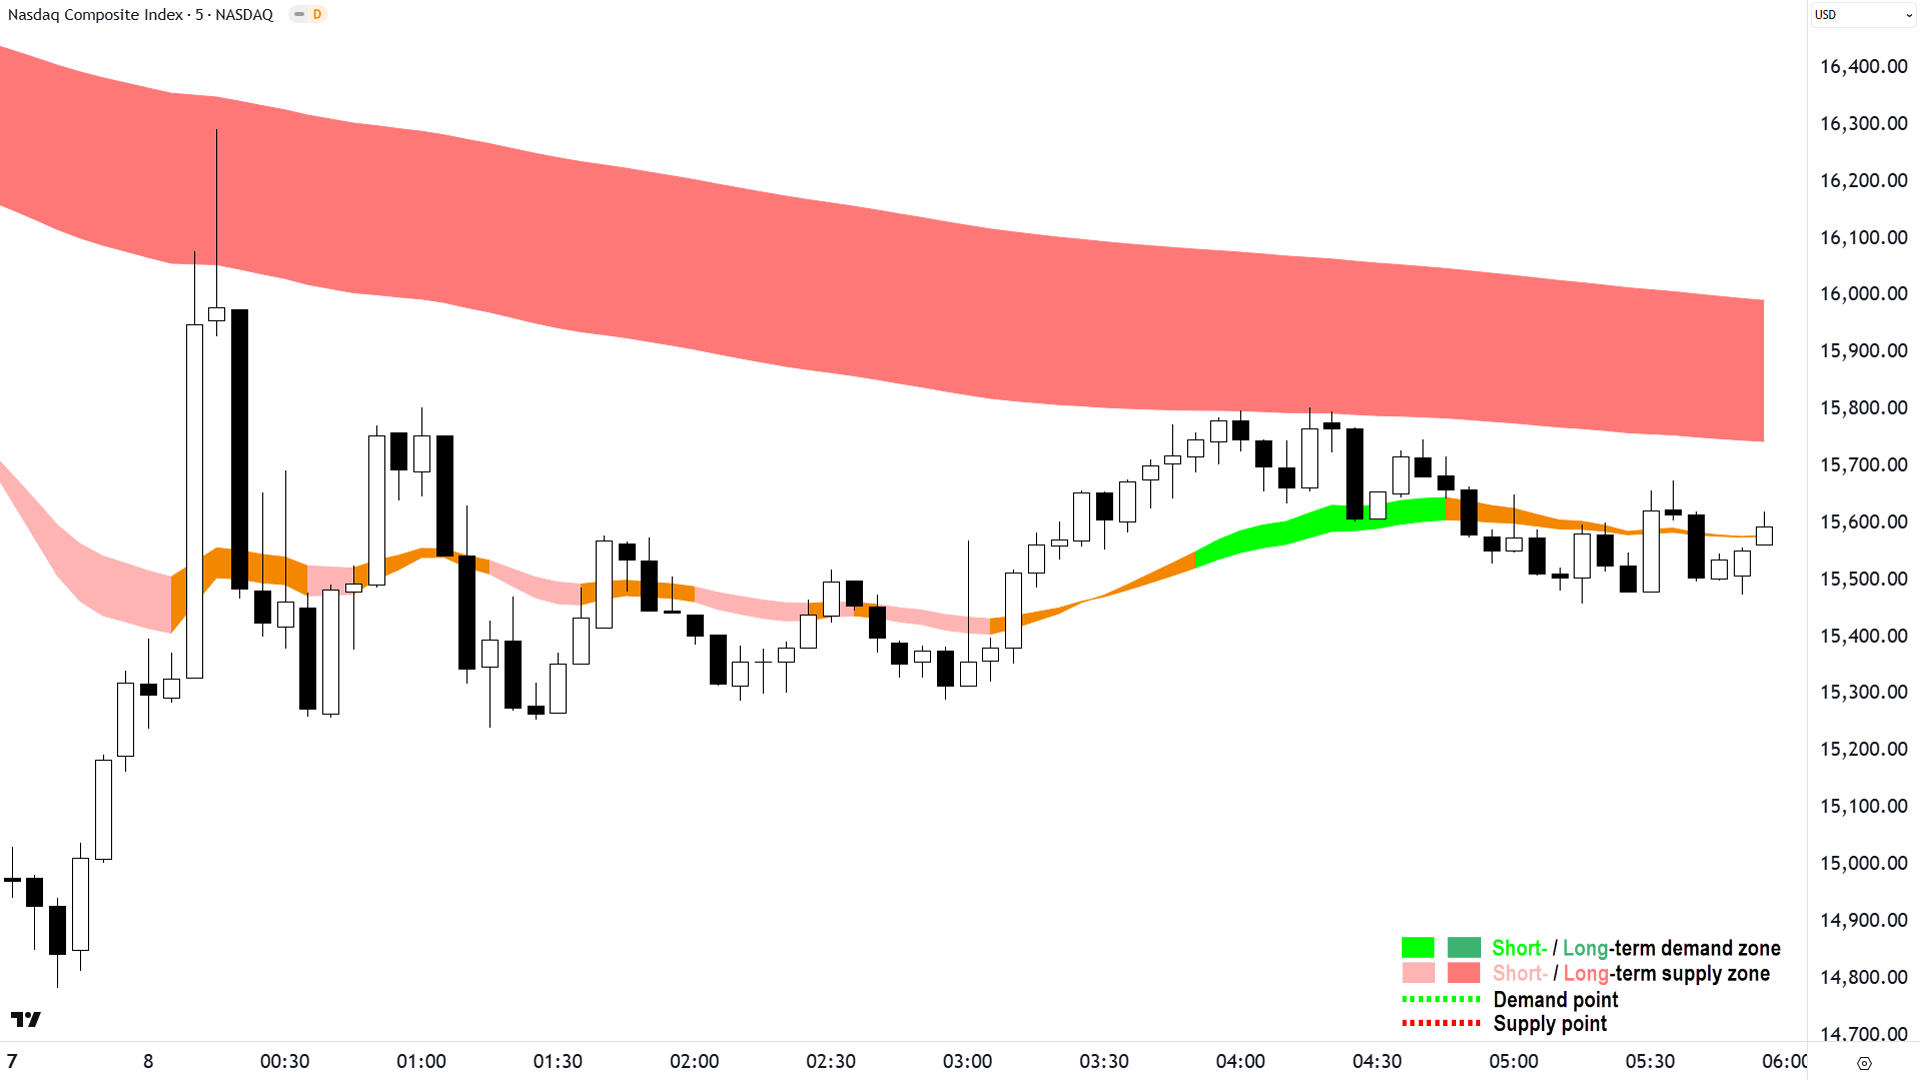
NASDAQ Composite Index 5-minute intraday chart (click here for full size image)
Looking at the intraday chart, it was largely an equilibrium session after accounting for the first hour’s antics – with perhaps the slightest of demand-side tones to it.
But is that really enough? I mean the Comp has been smashed. Slight demand-side tone is hardly an emphatic showing of confidence manifesting itself in the price action.
At least it’s not excess supply.
The good news is that we’ll get another candle tonight. It’s the only thing you can count on (whether you’re there to read it tomorrow or not!).
So, let’s wait for further confirmation on just how bullish/bearish last night’s candle/present environment was/is.
Bigger picture, I don’t need to remind you we’re in a bear market by official terms (i.e., >20% decline from peak), and short and long term downtrends by my model.
16854-17238 is the key static supply zone that will likely impede any subsequent rally. Above it, lies the catching up short and long term trend ribbons.
As for key points of demand, 15222 looks to have held well enough based upon last night's price action. I do think there’s a chance that we could see some stabilisation here – if only as a staging point for the next leg down.
But that’s getting way too far ahead of ourselves…Next candle first (and read next chart’s analysis), please! 🕯️✅
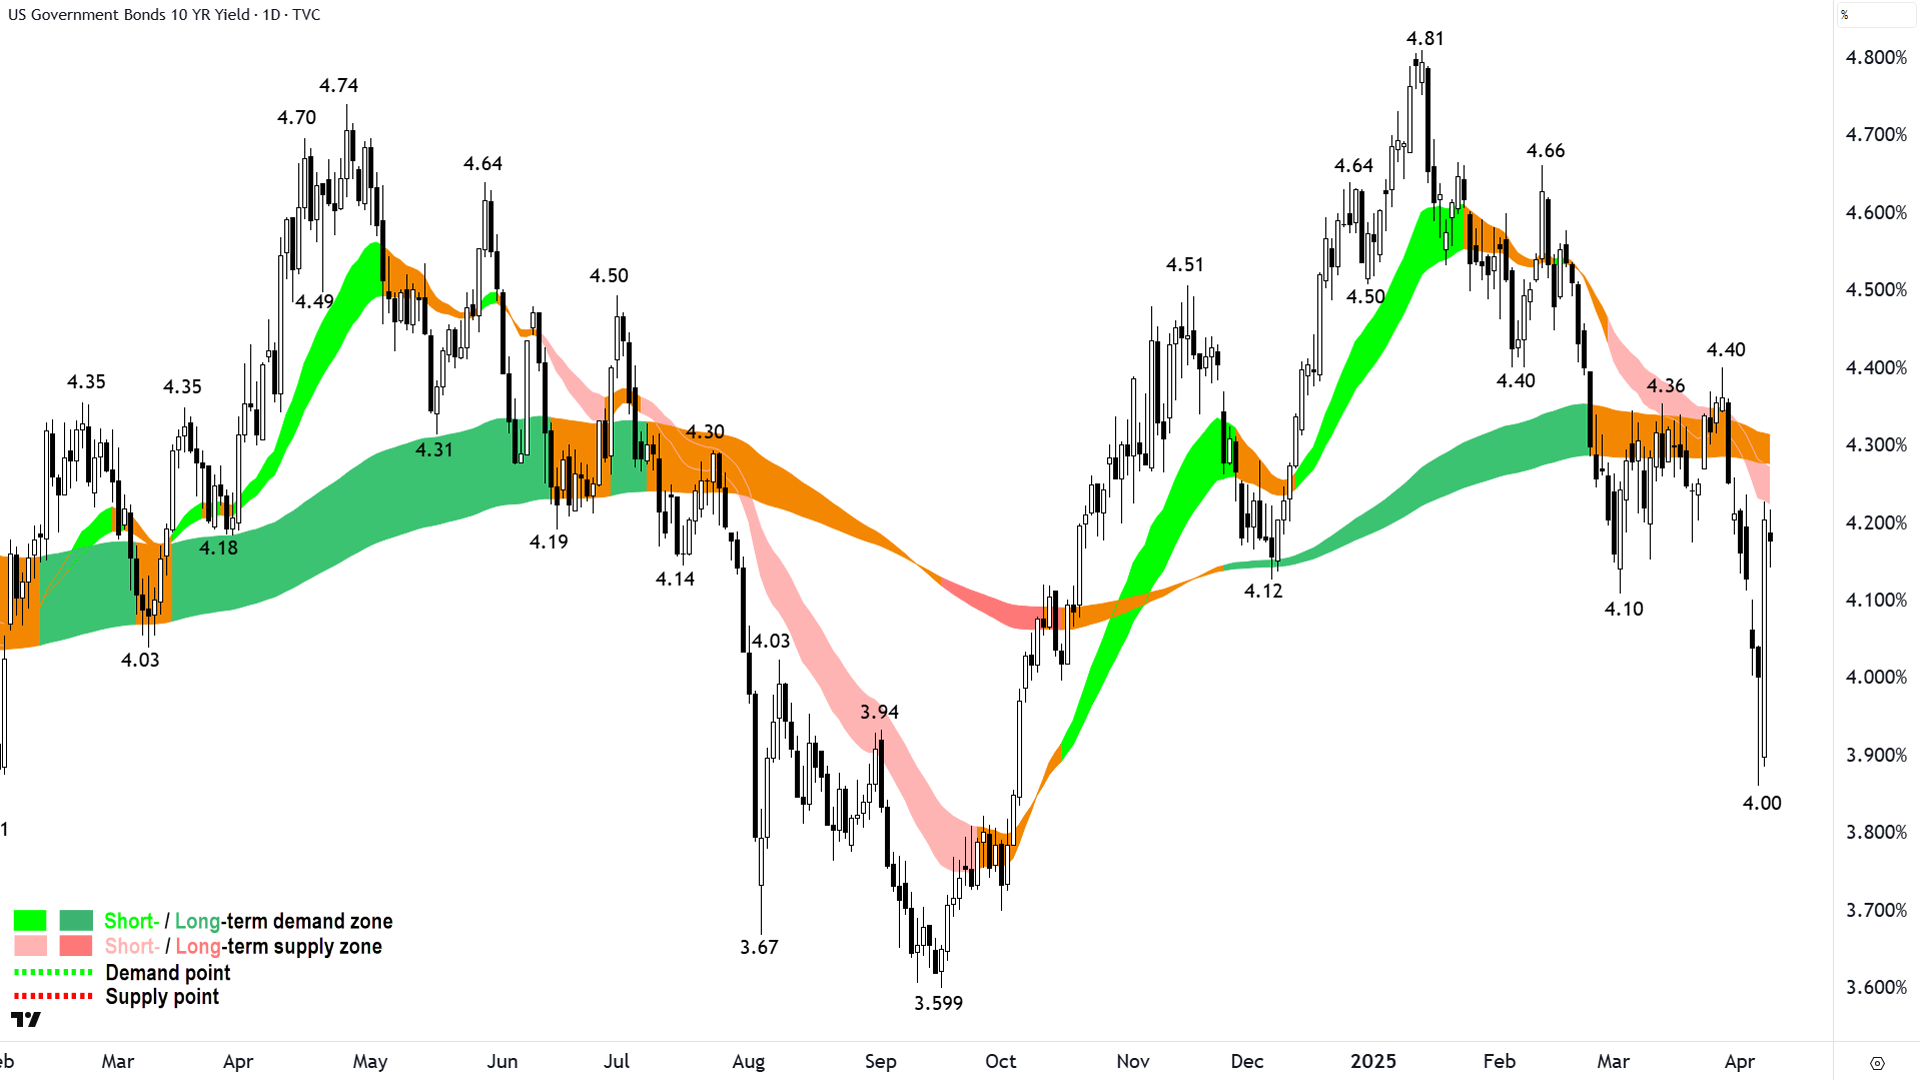
US 10 Year T-Bond Yield

Shenanigans x 💯s💯! (click here for full size image)
This chart and the Comp chart aren’t exactly adding up. Hopefully I’ve convinced you of the importance of this chart – it’s important on regular days, sure, but it’s critical when risk markets are melting down.
Like air moves from areas of high pressure to low pressure, so too does capital from risk assets to risk-free assets in times of uncertainty.
So, until yesterday – we’ve seen capital moving from risky stocks and crypto into cash and government bonds – like the US 10yrs.
There’s an inverse relationship between bond prices and bond yields, so the black candles above indicate rising bond prices / falling bond yields and white candles indicate falling bond prices / rising bond yields.
You know I get a little excited by big candles closing near their extremes – white and closing near the high = increased probability of subsequent rise vs black and closing near the low = increased probability of subsequent decline.
That’s a pretty substantial white candle (remember the last candle is today’s live candle – we discount it – I’m talking about Monday’s candle, second last on the chart above).
It follows Friday’s long downward pointing shadow (notice the exact low – 4.0% – not a coincidence!). Yields have reversed in a massive way.
That’s scary 😱. It deserves a warning sign emoji ⚠️. Heck, it deserves two warning sign emojis ⚠️⚠️!
Why?
Because stocks didn’t also reverse to the same degree. They were kinda supposed to happen at the same time / magnitude – because it would have been consistent with our flow of capital model – out of bonds and back into risk assets like stocks.
Stocks were up a bit, sure, but what about the rest of that giant white candle (i.e., bond selloff) last night? 🤔
This is a conundrum that requires resolution. Here’s my hunch:
Markets just realised the Fed put is off the table (i.e., referring to the Fed’s tendency through history to ride to the market’s rescue in tough times, by cutting rates, and ultimately stoking the next bull market) ⚠️;
Markets just realised that Trump’s policies are indeed going to cause a substantial inflation, therefore limiting or preventing reason 1 from occurring ⚠️;
Markets just realised that major foreign governments may be absent from upcoming US bond auctions this week (you take a swing at us…we’re not going to prop up your dictatorship!) ⚠️.
All three are scary prospects. That’s why I just added another three warning sign emojis.
This is a chart you want to keep watching. You also want to prick your ears for any growing rhetoric around these three themes…particularly the increased use of the word “Stagflation”.
These are indeed interesting times in which we live! 🙏
S&P/ASX 200 (XJO)
%20chart%208%20April%202024%20Source%20Market%20Index.png)
Here kitty kitty 🙀 (click here for full size image)
There’s an old saying in the markets: How high does a dead cat bounce?
It’s usually bandied about by crusty old traders that have seen one too many market downturns…Well young Whippersnapper…How high does a dead cat bounce?
I don’t know Crusty Old Trader? How high? 🤷
That high, son (points at chart 👆).
Let’s hope today’s rally is not “That high”.
As a Crusty Old Trader myself, I have learned through bitter experience that jumping in too early can cause significant self-harm.
The best rallies are the sharpest – the V-shaped rallies, chock full of white bodies and high closes. The bigger the better. Rallies such as these smack of recouped demand-side confidence and a supply side that is unwilling or unable to get in the way.
Don’t forget, much of the supply-side now is shorts (and not just garden variety sellers). They’ve had some wins, and they’re convinced we’re headed into the financial abyss – so they want some more.
We may well encounter them again a little higher up, as they reset into the better prices and liquidity that accompany a relief-rally based on the false hope the worst is over.
When they engage, we’ll see the telltale fingerprints of supply: black bodied candles, very likely long upward pointing shadows (the epitome of taking advantage of better price and liquidity), and these price action signals will likely occur on a spike in accompanying volume – showing the shorts are really getting set.
Where? 7733-short term trend ribbon would be my bet. I’ll be watching the candles very closely there.
Looking at potential points of demand, Monday’s low (7163) is now a key level – close beneath that and it’s going to get ugly again.
In the middle, today’s candle, whilst a perfectly sound demand-side showing, it remains paled in comparison to Monday’s washout, and indeed the broader Valentine’s Day correction. So, I suggest it’s still more dead cat bounce than V-shaped rally (young whippersnapper😁!)
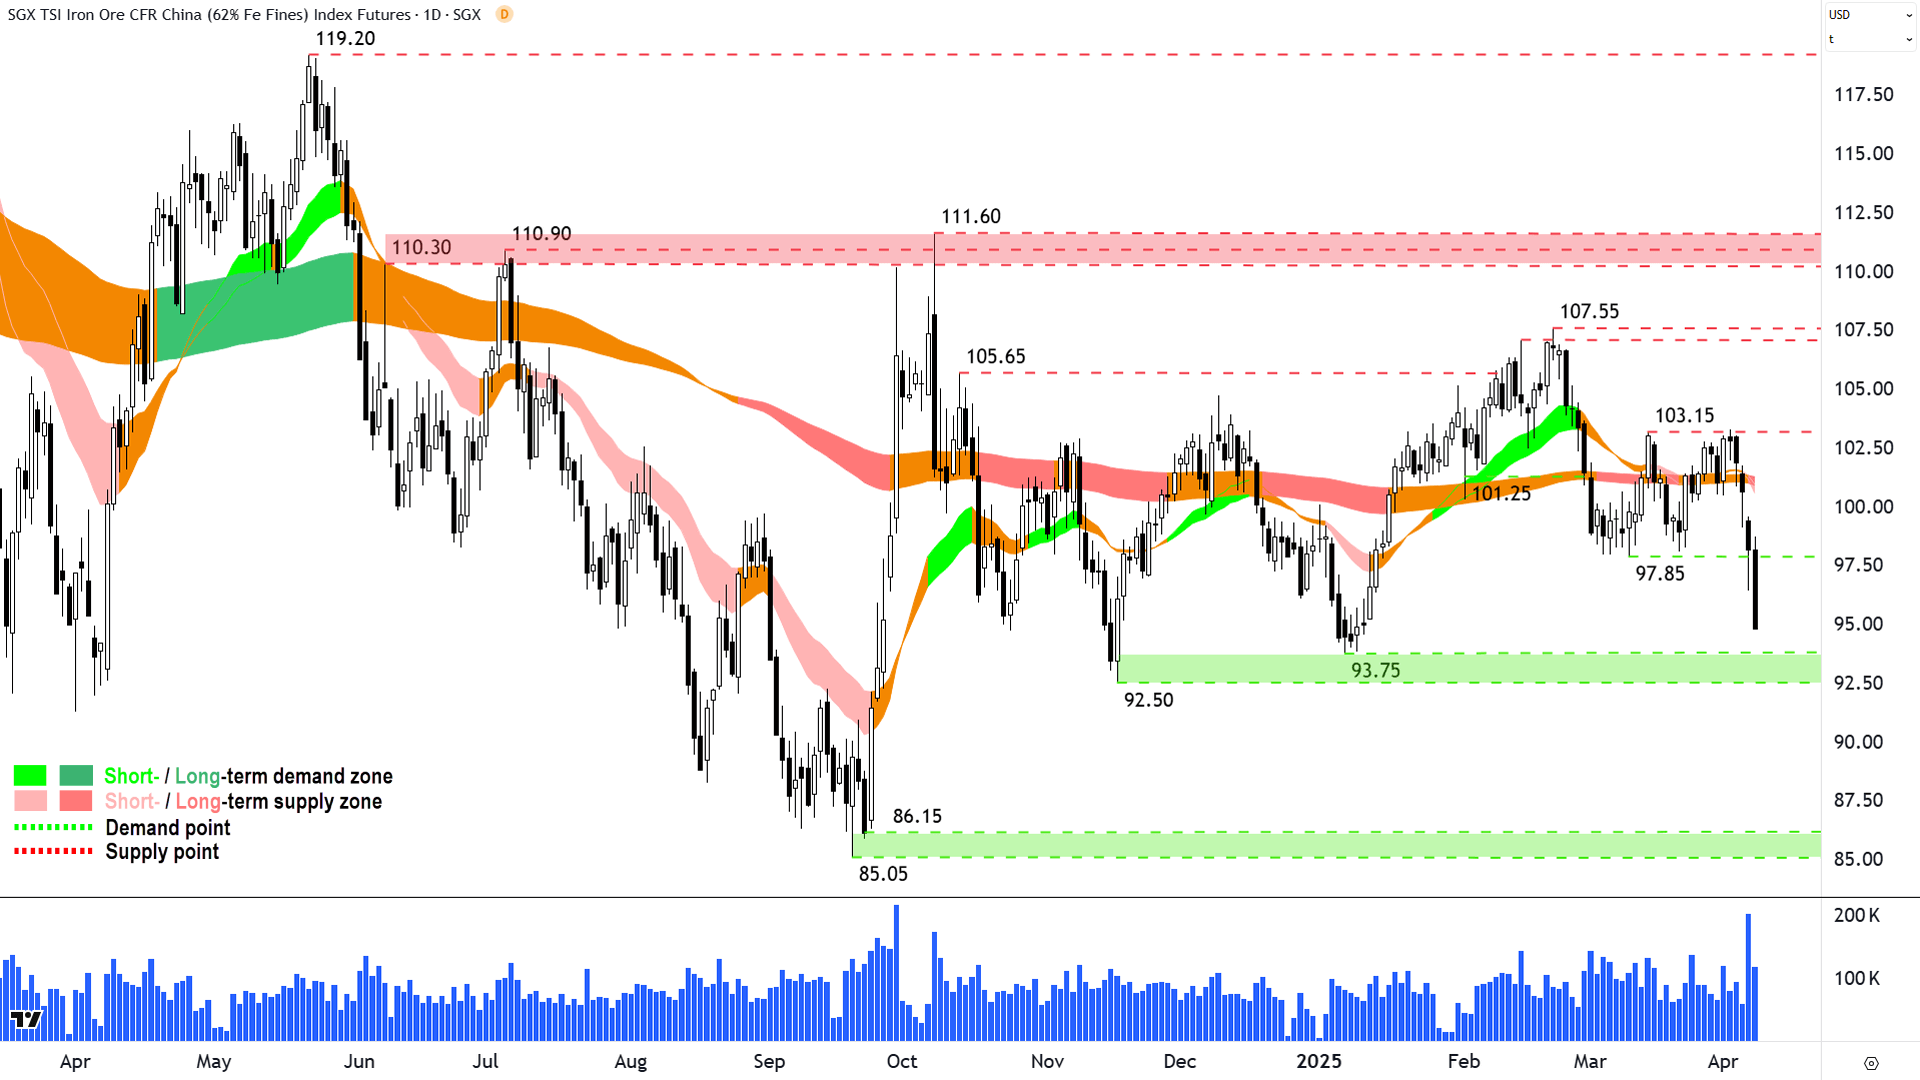
Iron Ore 62% (Front month, back-adjusted) SGX
%20SGX%20chart%208%20April%202024.png)
Iron awwwwww 📉 (click here for full size image)
Just a quickie here on iron ore as it appears to be in the process of cracking a short term point of demand at 97.85. That last candle is live, but should it hold, I suggest it confirms the move to short term downtrend, as well as swing the balance towards downtrend for the long term trend.
It could be the start of something small, i.e., a move to a clear zone of demand at 9250-93.75, or it could be the start of something far more substantial, i.e., a move to the next lower zone of demand at 85.05-86.15.
Either way, it’s not like we’re both sitting here looking at the above chart and going: Well, it’s probably going to go up to…
Dot dot dot indeed!
Economy
Today
Westpac Consumer Sentiment April
-6.0% to 9.1 vs +3.7% to 95.9 in March
Not surprisingly, tariff war and share market selloff to blame for consumers' growing despair! 😭

Westpac-Melbourne Institute Consumer Sentiment Index, Source: Westpac Economics
NAB Business Confidence March
-1 point to -3 points vs -7 points to -2 points in February (revised down from -1 point)
Broad-based declines across sectors, but survey taken before Trump tariff chaos, so likely will get substantially worse next month...

NAB Business Confidence Survey. Source: National Australia Bank
Later this week
Wednesday
(TENTATIVE) CHN New Loans March (2.36 billion forecast vs 1.01 billion in February)
(TENTATIVE) CHN M2 Money Supply March y/y (+7.0% p.a. forecast, steady with February)
Thursday
04:00 USA FOMC Meeting Minutes
11:30 CHN Consumer Price Index (CPI) & Producer Price Index (PPI) March
CPI: +0.1% p.a. vs -0.7% p.a. in February
PPI: -2.3% p.a. vs -2.2% p.a. in February
20:00 RBA Governor Michelle Bullock Speaks
22:30 USA Core CPI March (+0.3% m/m and 3.0% p.a. forecast vs +0.2% m/m and 3.1% p.a. in February)
Friday
22:30 USA Core PPI March (+0.3% m/m and 3.4% p.a. forecast vs -0.1% m/m and 3.2% p.a. in February)
Saturday
00:00 Preliminary University of Michigan Consumer Sentiment April (54.0 forecast vs 57.0 previous)
Latest News
Interesting Movers
Trading higher
+32.0% MTM Critical Metals (MTM) - Exceptional E-Scrap Gold Recovery & Supply Agreement Secured.
+17.9% Strike Energy (STX) - No news, general strength across the broader Energy sector today.
+15.2% BetaShares Geared US Equity Fund Currency Hedged ETF (GGU) - No news, long US equities ETF.
+12.3% BetaShares Crypto Innovators ETF (CRY) - No news, major cryptos rallied in line with other risk assets overnight/today.
+12.2% Vulcan Energy Resources (VUL) - No news since 07-Apr Acquisition of Geox completed, general strength across the broader Resources sector today.
+11.8% Santana Minerals (SMI) - No news since 07-Apr Update on Fast-track Approvals application submission, general strength across the broader Gold sector today.
+11.0% Boss Energy (BOE) - N, general strength across the broader Energy sector today.
+9.7% Sovereign Metals (SVM) - No news, general strength across the broader Resources sector today.
+9.6% Metals Acquisition (MAC) - No news, general strength across the broader Resources sector today.
+9.4% Meteoric Resources (MEI) - No news since 07-Apr REE Supply Restrictions Highlight Caldeira Project Value, general strength across the broader Resources sector today.
+9.0% Appen (APX) - No news, general strength across the broader Information Technology sector today.
+8.7% Whitehaven Coal (WHC) - No news, general strength across the broader Energy sector today.
+8.6% Block (XYZ) - No news, general strength across the broader Information Technology sector today.
Trading lower
-11.8% Global X Ultra Short Nasdaq-100 Hedge Fund ETF (SNAS) - No news, short NASDAQ ETF.
-11.5% BetaShares US EQY Strong Bear - CH ETF (BBUS) - No news, short US equities ETF.
-5.3% BetaShares Australian Strong Bear ETF (BBOZ) - No news, short ASX equities ETF.
-5.1% Domain Australia (DHG) - Update to Balances on Domain Unlisted Securities Registers.
-4.5% WA1 Resources (WA1) - No news, fall is consistent with prevailing short term downtrend and long term trend is transitioning from up to down, a regular in ChartWatch ASX Scans Downtrends list 🔎📉
-4.4% BetaShares US Treasury Bond 20+YR Hedged ETF (GGOV) - No news, long bond ETF, see ChartWatch - bonds belted last 24-hours (4% is a big drop for a bond fund!).
-3.7% Orthocell (OCC) - No news 🤔.
-3.6% HMC Capital (HMC) - No news, fall is consistent with prevailing short and long term downtrends, a regular in ChartWatch ASX Scans Downtrends list 🔎📉
-3.0% Bapcor (BAP) - No news, fall is consistent with prevailing short and long term downtrends, a regular in ChartWatch ASX Scans Downtrends list 🔎📉
-2.7% Platinum Asset Management (PTM) - Funds Under Management - March 2025, fall is consistent with prevailing short and long term downtrends, a regular in ChartWatch ASX Scans Downtrends list 🔎📉
-2.6% AMP (AMP) - No news, fall is consistent with prevailing short term downtrend and long term trend is transitioning from up to down, a regular in ChartWatch ASX Scans Downtrends list 🔎📉
Broker Moves
Aussie Broadband (ABB)
Retained at neutral at Goldman Sachs; Price Target: $3.90
Abacus Group (ABG)
Retained at buy at Shaw and Partners; Price Target: $1.200
AGL Energy (AGL)
Retained at outperform at Macquarie; Price Target: $12.29
Ampol (ALD)
Retained at buy at Goldman Sachs; Price Target: $22.58
Aristocrat Leisure (ALL)
Retained at buy at Goldman Sachs; Price Target: $82.00
ARB Corporation (ARB)
Retained at neutral at Citi; Price Target: $39.54
Abacus Storage King (ASK)
Retained at buy at Citi; Price Target: $1.400
Retained at buy at Shaw and Partners; Price Target: $1.650 from $1.350
ASX (ASX)
Retained at hold at Morgans; Price Target: $67.20
Adveritas (AV1)
Initiated at buy at Bell Potter; Price Target: $0.120
BHP Group (BHP)
Retained at buy at Citi; Price Target: $45.00
Beach Energy (BPT)
Retained at sell at Goldman Sachs; Price Target: $1.300
Breville Group (BRG)
Retained at buy at Goldman Sachs; Price Target: $35.00 from $40.80
Brambles (BXB)
Retained at buy at UBS; Price Target: $22.80
Car Group (CAR)
Retained at buy at Citi; Price Target: $42.00
Retained at buy at Goldman Sachs; Price Target: $43.90
Cobram Estate Olives (CBO)
Retained at buy at Ord Minnett; Price Target: $2.23
Challenger (CGF)
Retained at buy at Bell Potter; Price Target: $7.80
Retained at buy at Citi; Price Target: $6.70
Capricorn Metals (CMM)
Retained at neutral at Macquarie; Price Target: $8.20
Coronado Global Resources (CRN)
Downgraded to underperform from neutral at Bank of America; Price Target: $0.250 from $0.900
DigiCo REIT (DGT)
Retained at buy at Goldman Sachs; Price Target: $5.80
Domain Australia (DHG)
Retained at neutral at Citi; Price Target: $3.25
Retained at neutral at Goldman Sachs; Price Target: $3.00
Dexus Convenience Retail Reit (DXC)
Retained at accumulate at Ord Minnett; Price Target: $3.09 from $31.13
Deep Yellow (DYL)
Retained at buy at Canaccord Genuity; Price Target: $1.610 from $1.830
Fineos Corporation (FCL)
Retained at buy at Citi; Price Target: $2.35
Fortescue (FMG)
Retained at neutral at Citi; Price Target: $17.50
Fisher & Paykel Healthcare Corporation (FPH)
Retained at equal-weight at Morgan Stanley; Price Target: NZ$36.70 from NZ$36.30
Gentrack Group (GTK)
Retained at buy at Goldman Sachs; Price Target: $13.50
Guzman y Gomez (GYG)
Retained at underweight at RBC Capital Markets; Price Target: $31.00
Hipages Group (HPG)
Retained at buy at E&P; Price Target: $2.14
Hansen Technologies (HSN)
Retained at buy at Goldman Sachs; Price Target: $6.10
Hub24 (HUB)
Retained at neutral at Citi; Price Target: $84.80
Infratil (IFT)
Retained at neutral at Goldman Sachs; Price Target: $11.50
IGO (IGO)
Retained at outperform at Macquarie; Price Target: $5.50
Iluka Resources (ILU)
Retained at buy at Ord Minnett; Price Target: $5.40 from $5.50
Light & Wonder (LNW)
Retained at buy at Goldman Sachs; Price Target: $184.60
Lynas Rare Earths (LYC)
Downgraded to hold from buy at Ord Minnett; Price Target: $7.80
Retained at buy at UBS; Price Target: $7.95
Macquarie Technology Group (MAQ)
Retained at neutral at Goldman Sachs; Price Target: $80.00
Mineral Resources (MIN)
Retained at outperform at Macquarie; Price Target: $35.00
Megaport (MP1)
Retained at buy at Citi; Price Target: $9.00
Retained at neutral at Goldman Sachs; Price Target: $9.50
Mesoblast (MSB)
Retained at buy at Bell Potter; Price Target: $3.40 from $3.90
Nine Entertainment (NEC)
Retained at buy at Goldman Sachs; Price Target: $1.800
Northern Minerals (NTU)
Retained at buy at Ord Minnett; Price Target: $0.030
Netwealth Group (NWL)
Retained at neutral at Citi; Price Target: $30.70
News Corporation (NWS)
Retained at buy at Goldman Sachs; Price Target: $61.00
Nextdc (NXT)
Retained at buy at Citi; Price Target: $18.70
Retained at buy at Goldman Sachs; Price Target: $17.10
Objective Corporation (OCL)
Retained at neutral at Goldman Sachs; Price Target: $14.10
OOH!Media (OML)
Retained at neutral at Goldman Sachs; Price Target: $1.500
Origin Energy (ORG)
Retained at neutral at Goldman Sachs; Price Target: $10.30
Pilbara Minerals (PLS)
Retained at outperform at Macquarie; Price Target: $2.40
Pro Medicus (PME)
Retained at buy at Goldman Sachs; Price Target: $309.00
Platinum Asset Management (PTM)
Retained at sell at Goldman Sachs; Price Target: $0.560 from $0.650
Pexa Group (PXA)
Retained at buy at Goldman Sachs; Price Target: $14.50
REA Group (REA)
Retained at buy at Citi; Price Target: $275.00
Retained at buy at Goldman Sachs; Price Target: $273.00
Rio Tinto (RIO)
Retained at neutral at Citi; Price Target: $130.00
Regis Resources (RRL)
Upgraded to neutral from underperform at Bank of America; Price Target: $4.30 from $3.00
Retained at outperform at Macquarie; Price Target: $0.000
Retained at outperform at Macquarie; Price Target: $4.30 from $4.10
Retained at add at Morgans; Price Target: $4.65 from $3.89
South32 (S32)
Retained at buy at Citi; Price Target: $4.00
Steadfast Group (SDF)
Retained at outperform at Macquarie; Price Target: $0.000
Retained at outperform at Macquarie; Price Target: $6.80
Siteminder (SDR)
Retained at buy at Citi; Price Target: $7.20
Retained at neutral at Goldman Sachs; Price Target: $5.90
Seek (SEK)
Retained at neutral at Goldman Sachs; Price Target: $25.00
Serko (SKO)
Retained at buy at Citi; Price Target: $4.25
Superloop (SLC)
Retained at sell at Goldman Sachs; Price Target: $2.10
Spark New Zealand (SPK)
Retained at neutral at Goldman Sachs; Price Target: $2.75
Santos (STO)
Retained at buy at Citi; Price Target: $7.60
Retained at buy at Goldman Sachs; Price Target: $7.90
Seven West Media (SWM)
Retained at sell at Goldman Sachs; Price Target: $0.130
The Lottery Corporation (TLC)
Retained at neutral at Goldman Sachs; Price Target: $5.30
Telstra Group (TLS)
Retained at buy at Goldman Sachs; Price Target: $4.50
Telix Pharmaceuticals (TLX)
Retained at buy at UBS; Price Target: $36.00
Technology One (TNE)
Upgraded to buy from hold at Bell Potter; Price Target: $29.00 from $30.50
Retained at neutral at Goldman Sachs; Price Target: $26.90
TPG Telecom (TPG)
Retained at sell at Goldman Sachs; Price Target: $4.20
Trajan Group (TRJ)
Initiated at buy at Bell Potter; Price Target: $1.500
Viva Energy Group (VEA)
Retained at buy at Goldman Sachs; Price Target: $1.580
Viva Leisure (VVA)
Initiated at add at Morgans; Price Target: $1.750
Woodside Energy Group (WDS)
Retained at neutral at Citi; Price Target: $20.50 from $24.00
Retained at neutral at Goldman Sachs; Price Target: $24.50
Retained at neutral at Goldman Sachs; Price Target: $24.50
Retained at neutral at Macquarie; Price Target: $0.000
Retained at neutral at Macquarie; Price Target: $24.00 from $26.00
Retained at hold at Ord Minnett; Price Target: $26.50 from $26.00
Retained at neutral at UBS; Price Target: $26.50
Waypoint Reit (WPR)
Retained at accumulate at Ord Minnett; Price Target: $2.70 from $2.72
Wisetech Global (WTC)
Retained at buy at Citi; Price Target: $115.00
Retained at buy at Goldman Sachs; Price Target: $128.00
Xero (XRO)
Retained at buy at Citi; Price Target: $198.00
Retained at buy at Goldman Sachs; Price Target: $201.00
Zip Co. (ZIP)
Retained at buy at Citi; Price Target: $3.00
Scans
Top Gainers
Code | Company | Last | % Chg |
|---|---|---|---|
| HFR | Highfield Resources Ltd | $0.15 | +50.00% |
| LM1 | Leeuwin Metals Ltd | $0.15 | +50.00% |
| TM1 | Terra Metals Ltd | $0.028 | +40.00% |
| WOA | Wide Open Agriculture Ltd | $0.02 | +33.33% |
| MTM | MTM Critical Metals Ltd | $0.165 | +32.00% |
Top Fallers
Code | Company | Last | % Chg |
|---|---|---|---|
| CAN | Cann Group Ltd | $0.021 | -22.22% |
| NYM | Narryer Metals Ltd | $0.031 | -20.51% |
| ATV | Activeport Group Ltd | $0.012 | -20.00% |
| CTQ | Careteq Ltd | $0.012 | -20.00% |
| OSX | Osteopore Ltd | $0.016 | -20.00% |
52 Week Highs
Code | Company | Last | % Chg |
|---|---|---|---|
| LM1 | Leeuwin Metals Ltd | $0.15 | +50.00% |
| WTL | WT Financial Group Ltd | $0.14 | +21.74% |
| AS1 | Asara Resources Ltd | $0.047 | +20.51% |
| HCT | Holista Colltech Ltd | $0.038 | +8.57% |
| RRL | Regis Resources Ltd | $4.22 | +6.84% |
52 Week Lows
Code | Company | Last | % Chg |
|---|---|---|---|
| CAN | Cann Group Ltd | $0.021 | -22.22% |
| OSX | Osteopore Ltd | $0.016 | -20.00% |
| CUS | Copper Search Ltd | $0.02 | -16.67% |
| ATG | Articore Group Ltd | $0.145 | -14.71% |
| SEQ | Sequoia Financial Group Ltd | $0.28 | -12.50% |
Near Highs
Code | Company | Last | % Chg |
|---|---|---|---|
| GLDN | Ishares Physical Gold ETF | $39.52 | -1.69% |
| GXLD | Global X Gold Bullion ETF | $49.52 | -1.59% |
| AYUPA | Australian Unity Ltd | $81.70 | +0.78% |
| BTH | Bigtincan Holdings Ltd | $0.22 | +2.33% |
| TLS | Telstra Group Ltd | $4.33 | +0.46% |
Relative Strength Index (RSI) Oversold
Code | Company | Last | % Chg |
|---|---|---|---|
| IPX | Iperionx Ltd | $2.19 | +0.92% |
| CHN | Chalice Mining Ltd | $0.905 | +1.69% |
| CTD | Corporate Travel Management Ltd | $12.10 | +0.92% |
| VVLU | Vanguard Global Value Equity Active ETF | $67.21 | +2.61% |
| CNEW | Vaneck China New Economy ETF | $6.41 | -0.62% |
