News | Market Wraps
Evening Wrap: ASX 200 surges on US inflation windfall, as banks, real estate, technology and gold stocks lead the way
The S&P/ASX 200 closed 113.7 points higher, up 1.38%.

Mentioned
The S&P/ASX 200 closed 113.7 points higher, up 1.38%.
Better than expected data on US inflation spurred strong gains in US stocks Wednesday, and this flowed through nicely to a similarly robust performance by Australian shares today.
Lower benchmark market yields helped interest rate sensitive sectors like banks, real estate, technology, and gold to the biggest gains as the S&P/ASX 200 stacked on in excess of 100 points.
Click/scroll through for the usual reporting of the major sector and stock-specific moves, the broker responses to them, as well as all the key upcoming economic data in tonight's Evening Wrap.
Also, I have detailed technical analysis on US and Australian 10-Year Bond Yields and the S&P/ASX 200 (XJO) in today's ChartWatch.
Let's dive in!
Today in Review
Thu 16 Jan 25, 5:05pm (AEST)
Name | Value | % Chg |
|---|---|---|
Major Indices | ||
| ASX 200 | 8,327.0 | +1.38% |
| All Ords | 8,569.1 | +1.33% |
| Small Ords | 3,133.1 | +1.36% |
| All Tech | 3,771.2 | +1.40% |
| Emerging Companies | 2,286.3 | +0.64% |
Currency | ||
| AUD/USD | 0.6199 | -0.45% |
US Futures | ||
| S&P 500 | 5,986.0 | -0.05% |
| Dow Jones | 43,475.0 | +0.02% |
| Nasdaq | 21,369.0 | -0.15% |
Name | Value | % Chg |
|---|---|---|
Sector | ||
| Financials | 8,815.9 | +2.56% |
| Real Estate | 3,933.4 | +2.25% |
| Information Technology | 2,683.7 | +1.81% |
| Materials | 16,760.0 | +1.02% |
| Communication Services | 1,646.4 | +0.61% |
| Industrials | 7,706.3 | +0.57% |
| Consumer Discretionary | 3,921.7 | +0.43% |
| Energy | 9,085.5 | +0.42% |
| Consumer Staples | 11,629.6 | +0.18% |
| Utilities | 9,159.8 | +0.16% |
| Health Care | 44,793.5 | +0.01% |
Markets

ASX 200 Session Chart
The S&P/ASX 200 (XJO) finished 113.7 points higher at 8,327.0, 1.38% from its session low and just 0.22% from its high. In the broader-based S&P/ASX 300 (XKO), advancers beat decliners by an impressive 255 to 62.
You know exactly what happened: There was a major rebound in US stocks overnight, and this sentiment flowed through to the local bourse today.
But that was only the "effect". It's far more important to understand the "cause".
The cause was a plunge in key US risk-free market yields. For example, the yield on the benchmark US-10 Year Treasury Bond dipped to 4.65%, this compares to its peak of 4.81% on Tuesday night. I hear you, -0.16% doesn't sound like much – but it is when you consider the Fed usually deals in 0.25% increments.
The Fed didn't do anything officially last night, but the market just cut long term US interest rates by nearly two-thirds of a typical Fed move. And stocks love lower interest rates – it's that simple.
But there are certain sectors that love plunging benchmark risk-free market yields more than others. I've explained why in the past, and you'll agree that its no surprise today's sector performance table looked like this:
Company | Last Price | Change $ | Change % | 1mo % | 1yr % |
|---|---|---|---|---|---|
S&P/ASX 200 Financials Sector Index | 8815.9 | +219.9 | +2.6% | +0.7% | +29.9% |
S&P/ASX 200 A-REIT Index | 1800.4 | +41.1 | +2.3% | +2.3% | +21.8% |
S&P/ASX All Ordinaries Gold SubInd Index | 9398.0 | +172.9 | +1.9% | +3.6% | +34.4% |
S&P/ASX 200 Information Technology Sector Index | 2683.70 | +47.7 | +1.8% | -2.6% | +50.0% |
S&P/ASX 200 Index | 8327.0 | +113.7 | +1.4% | +0.4% | +11.1% |
S&P/ASX Small Ordinaries Index | 3133.1 | +42.1 | +1.4% | 0.0% | +8.0% |
S&P/ASX 200 Equal Weight Index | 1966.4 | +24.7 | +1.3% | 0.0% | +8.8% |
S&P/ASX 200 Materials Sector Index | 16760.0 | +168.8 | +1.0% | -0.9% | -8.9% |
S&P/ASX MidCap 50 Index | 10351.5 | +102.7 | +1.0% | +0.7% | +13.7% |
S&P/ASX 200 Resources Index | 5364.0 | +37.5 | +0.7% | +0.4% | -11.7% |
S&P/ASX 200 Communication Services Sector Index | 1646.4 | +10 | +0.6% | -0.9% | +3.4% |
S&P/ASX 200 Industrials Sector Index | 7706.3 | +43.9 | +0.6% | +2.2% | +13.4% |
S&P/ASX 200 Consumer Discretionary Sector Index | 3921.7 | +16.6 | +0.4% | -1.5% | +20.6% |
S&P/ASX 200 Energy Sector Index | 9085.5 | +38.2 | +0.4% | +7.1% | -17.3% |
S&P/ASX 200 Consumer Staples Sector Index | 11629 | +20.6 | +0.2% | -1.3% | -4.0% |
S&P/ASX 200 Utilities Sector Index | 9159.80 | +15 | +0.2% | +3.6% | +15.7% |
S&P/ASX 200 Health Care Sector Index | 44793 | +4.8 | +0.0% | -0.1% | +5.7% |
ASX Sector Indices performance table – Interest rate sensitives dominated top positions
Interest rate sensitives featured highly at the top of the list with a couple of notable exceptions in Health Care (XHJ) (+%), Utilities (XUJ) (+%), and Consumer Discretionary (XDJ) (+%). Yes, they were all still up, all 11 major ASX sectors rose today, but I propose their absence is conspicuous.
Company | Last Price | Change $ | Change % | 1mo % | 1yr % |
|---|---|---|---|---|---|
Neuren Pharmaceuticals (NEU) | $12.28 | +$1.27 | +11.5% | -7.8% | -47.5% |
Zip Co. (ZIP) | $3.09 | +$0.28 | +10.0% | +8.0% | +511.9% |
Silver Mines (SVL) | $0.079 | +$0.006 | +8.2% | -15.1% | -50.6% |
Myer (MYR) | $0.885 | +$0.06 | +7.3% | -26.6% | +38.3% |
Corporate Travel Management (CTD) | $14.05 | +$0.9 | +6.8% | +2.1% | -30.0% |
Karoon Energy (KAR) | $1.495 | +$0.085 | +6.0% | +6.0% | -21.5% |
Tabcorp (TAH) | $0.625 | +$0.035 | +5.9% | +5.0% | -16.7% |
James Hardie Industries (JHX) | $54.56 | +$3.04 | +5.9% | +1.8% | -3.8% |
Chalice Mining (CHN) | $1.195 | +$0.065 | +5.8% | +1.3% | -8.8% |
Gentrack Group (GTK) | $10.93 | +$0.54 | +5.2% | -9.7% | +77.4% |
Ramelius Resources (RMS) | $2.32 | +$0.11 | +5.0% | +0.9% | +48.2% |
Brainchip (BRN) | $0.335 | +$0.015 | +4.7% | +39.6% | +91.4% |
Pinnacle Investment Management Group (PNI) | $23.58 | +$1.01 | +4.5% | +0.3% | +135.1% |
Generation Development Group (GDG) | $3.98 | +$0.17 | +4.5% | +2.6% | +134.4% |
Kelsian Group (KLS) | $3.75 | +$0.16 | +4.5% | +3.6% | -45.5% |
Emerald Resources (EMR) | $3.56 | +$0.15 | +4.4% | -4.0% | +10.9% |
Genesis Minerals (GMD) | $2.86 | +$0.12 | +4.4% | +5.5% | +74.4% |
Vault Minerals (VAU) | $0.370 | +$0.015 | +4.2% | -1.3% | +29.8% |
Imdex (IMD) | $2.43 | +$0.09 | +3.8% | +3.8% | +38.1% |
The Star Entertainment Group (SGR) | $0.135 | +$0.005 | +3.8% | -30.8% | -70.7% |
MA Financial Group (MAF) | $6.23 | +$0.23 | +3.8% | +2.6% | +10.7% |
Premier Investments (PMV) | $27.98 | +$1.01 | +3.7% | -17.5% | +0.6% |
Ingenia Communities Group (INA) | $5.31 | +$0.19 | +3.7% | +15.4% | +17.0% |
Stockland (SGP) | $5.06 | +$0.18 | +3.7% | +1.6% | +12.7% |
Lifestyle Communities (LIC) | $8.49 | +$0.3 | +3.7% | -1.3% | -52.3% |
Today's best
Company | Last Price | Change $ | Change % | 1mo % | 1yr % |
|---|---|---|---|---|---|
Novonix (NVX) | $0.660 | -$0.03 | -4.3% | +9.1% | +0.8% |
Vulcan Energy Resources (VUL) | $5.97 | -$0.24 | -3.9% | +2.6% | +167.7% |
Spartan Resources (SPR) | $1.435 | -$0.045 | -3.0% | +1.4% | +200.9% |
McMillan Shakespeare (MMS) | $15.42 | -$0.42 | -2.7% | +5.3% | -7.4% |
Webjet (WJL) | $0.780 | -$0.02 | -2.5% | -8.2% | 0% |
Cettire (CTT) | $1.290 | -$0.03 | -2.3% | +15.2% | -49.8% |
Droneshield (DRO) | $0.665 | -$0.015 | -2.2% | +6.4% | +70.5% |
Mineral Resources (MIN) | $36.01 | -$0.74 | -2.0% | +0.6% | -40.8% |
Sims (SGM) | $13.18 | -$0.27 | -2.0% | +3.5% | -4.9% |
Domino's Pizza Enterprises (DMP) | $28.88 | -$0.59 | -2.0% | -1.9% | -50.7% |
Nexgen Energy (NXG) | $11.05 | -$0.22 | -2.0% | -10.2% | -6.7% |
Alpha HPA (A4N) | $0.885 | -$0.015 | -1.7% | +1.1% | -11.5% |
Monadelphous Group (MND) | $14.20 | -$0.24 | -1.7% | +6.5% | -3.0% |
Iperionx (IPX) | $4.42 | -$0.07 | -1.6% | -2.4% | +213.5% |
Peninsula Energy (PEN) | $1.355 | -$0.02 | -1.5% | +14.8% | -27.5% |
Jumbo Interactive (JIN) | $12.52 | -$0.18 | -1.4% | -11.0% | -9.6% |
Ramsay Health Care (RHC) | $34.18 | -$0.45 | -1.3% | -7.4% | -32.6% |
Collins Foods (CKF) | $7.15 | -$0.09 | -1.2% | -7.0% | -42.2% |
Qualitas Real Estate Income Fund (QRI) | $1.645 | -$0.02 | -1.2% | 0% | +2.5% |
Codan (CDA) | $15.70 | -$0.18 | -1.1% | -0.1% | +85.4% |
Whitehaven Coal (WHC) | $6.20 | -$0.07 | -1.1% | -5.9% | -23.7% |
Cochlear (COH) | $303.89 | -$3.06 | -1.0% | +4.3% | +4.7% |
ARB Corporation (ARB) | $39.75 | -$0.33 | -0.8% | +1.7% | +20.5% |
Fletcher Building (FBU) | $2.58 | -$0.02 | -0.8% | +0.8% | -41.4% |
Eagers Automotive (APE) | $11.86 | -$0.09 | -0.8% | +2.1% | -17.5% |
Today's worst
ChartWatch
US 10 Year T-Bond Yield

Boom! And then a big black candle appeared! ⬛🕯️ Source: TradingView (click here for full size image)
The last time we covered the US 10-year bond yield was ABOUT 5 MINUTES AGO!
It feels that way a little, doesn’t it?
For good reason! There really hasn’t been much else in markets that have had such a major driving impact on all other asset classes as the chart above (and possibly also of the accompanying rampaging US Dollar…thrown in below).
%20ICE%20Chart%2016%20January%202025.png)
US Dollar Index Futures (Front month, back-adjusted) ICEUS. Source: TradingView (click here for full size image)
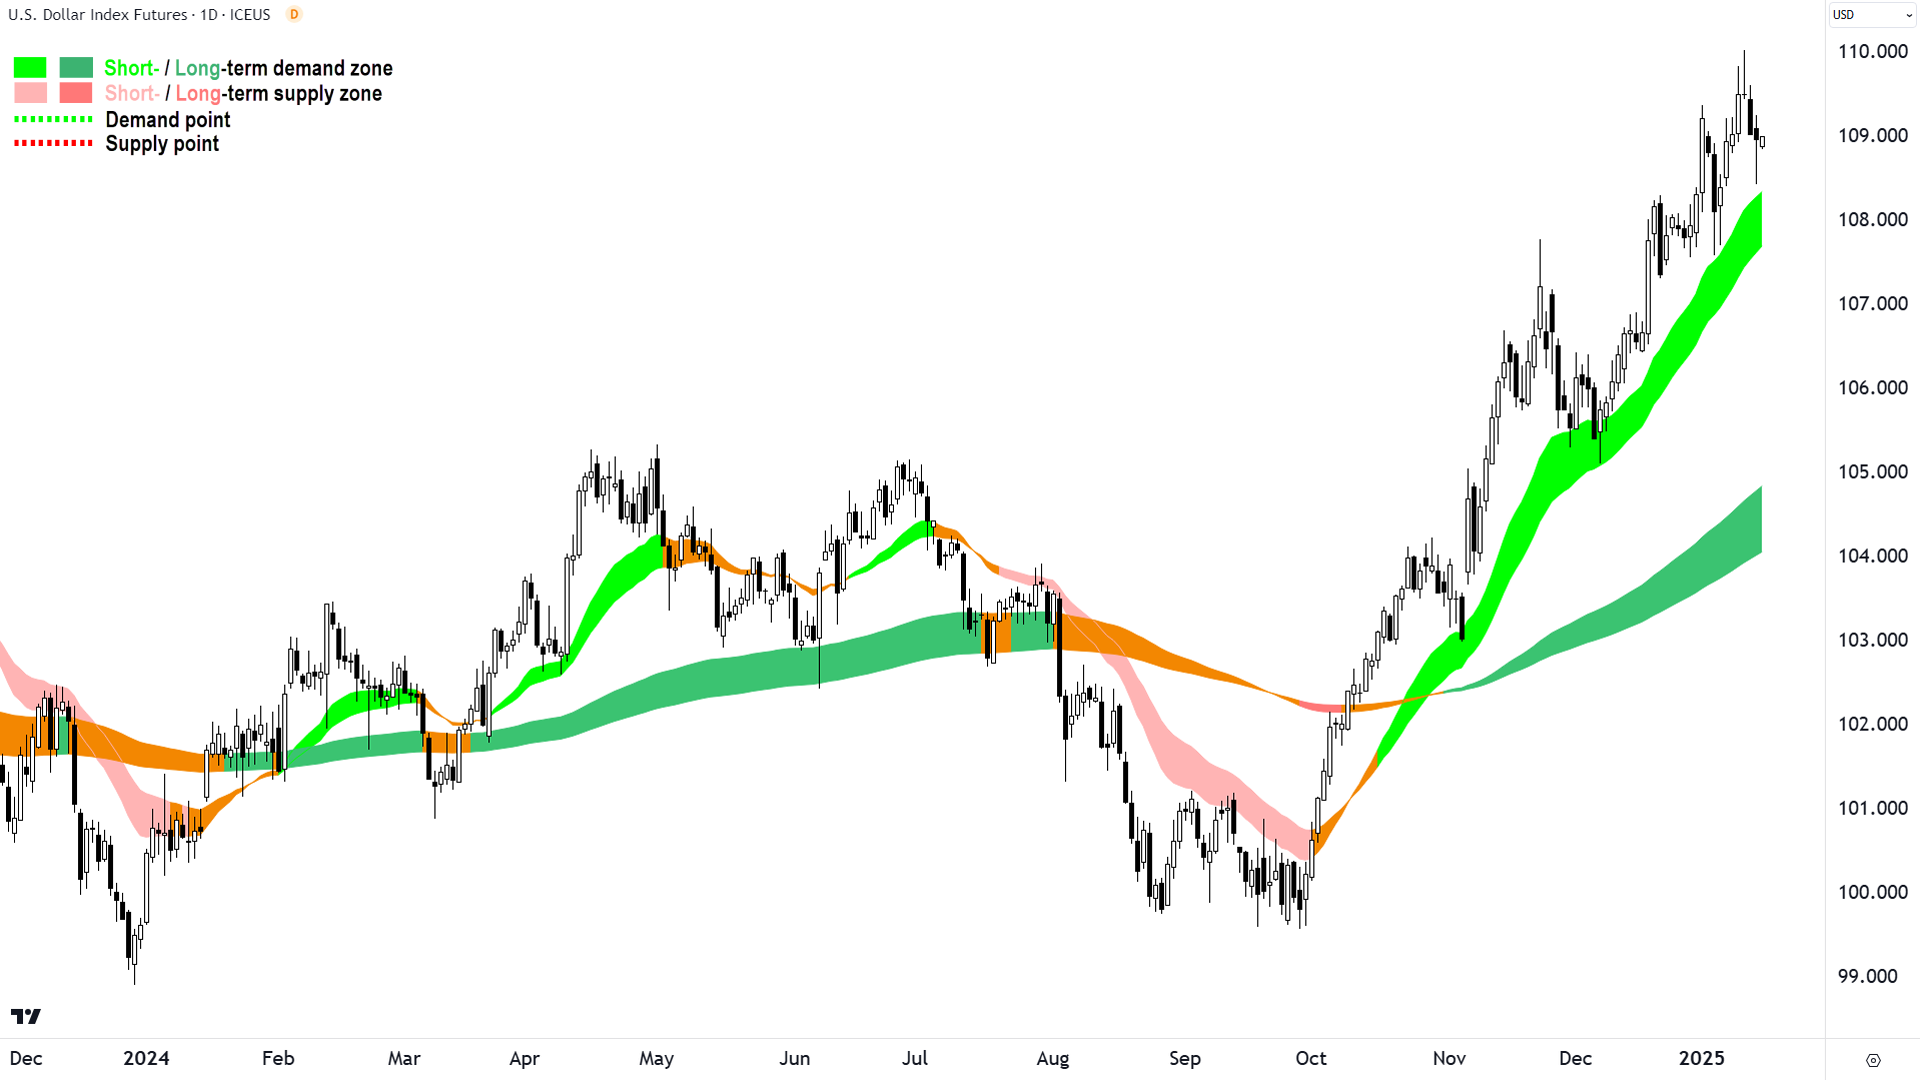
If this is the first ChartWatch/Evening Wrap you’ve ever read, then let me catch you up:
US 10-year T-Bond Yield ⬆️ = Stocks ⬇️
Here’s another crucial equation, to show how simplistic certain crucial equations can be in economics and the markets…
Inflation ⬇️ = US 10-year T-Bond Yield ⬇️
So, last night’s trade in the US went something like this:
CPI Inflation ⬇️ = US 10-year T-Bond Yield ⬇️ = US Stocks ⬆️
And because the Aussie market is incapable of doing anything by itself unless maybe if the iron ore price moves by 20 cents…
= ASX Stocks ⬆️ too!
Enough Economics 101 for now. Let’s do some Technical Analysisomics 101.
Lesson 1
Big black candle = Supply >> Demand
The bigger the black candle, and the closer it closed towards the low of the trading session, the greater the excess supply exhibited (we are of course actually referring to greater excess demand for bonds because of the inverse relationship between bond prices and bond yields – but I don’t want to bend your brains too much on a Thursday evening!).
Anyways, big black candles usually increase the probability of the price continuing lower – in this case, increasing the probability of the yield on the US 10-year T-Bond continuing lower.
We’d love some confirmation of last nights abrupt change in sentiment, as one candle a bear market does not make!
So, another black candle of decent proportions, and or a lengthy upward pointing shadow in to last night's range, would be a most welcome development for stock investors indeed. 🙏
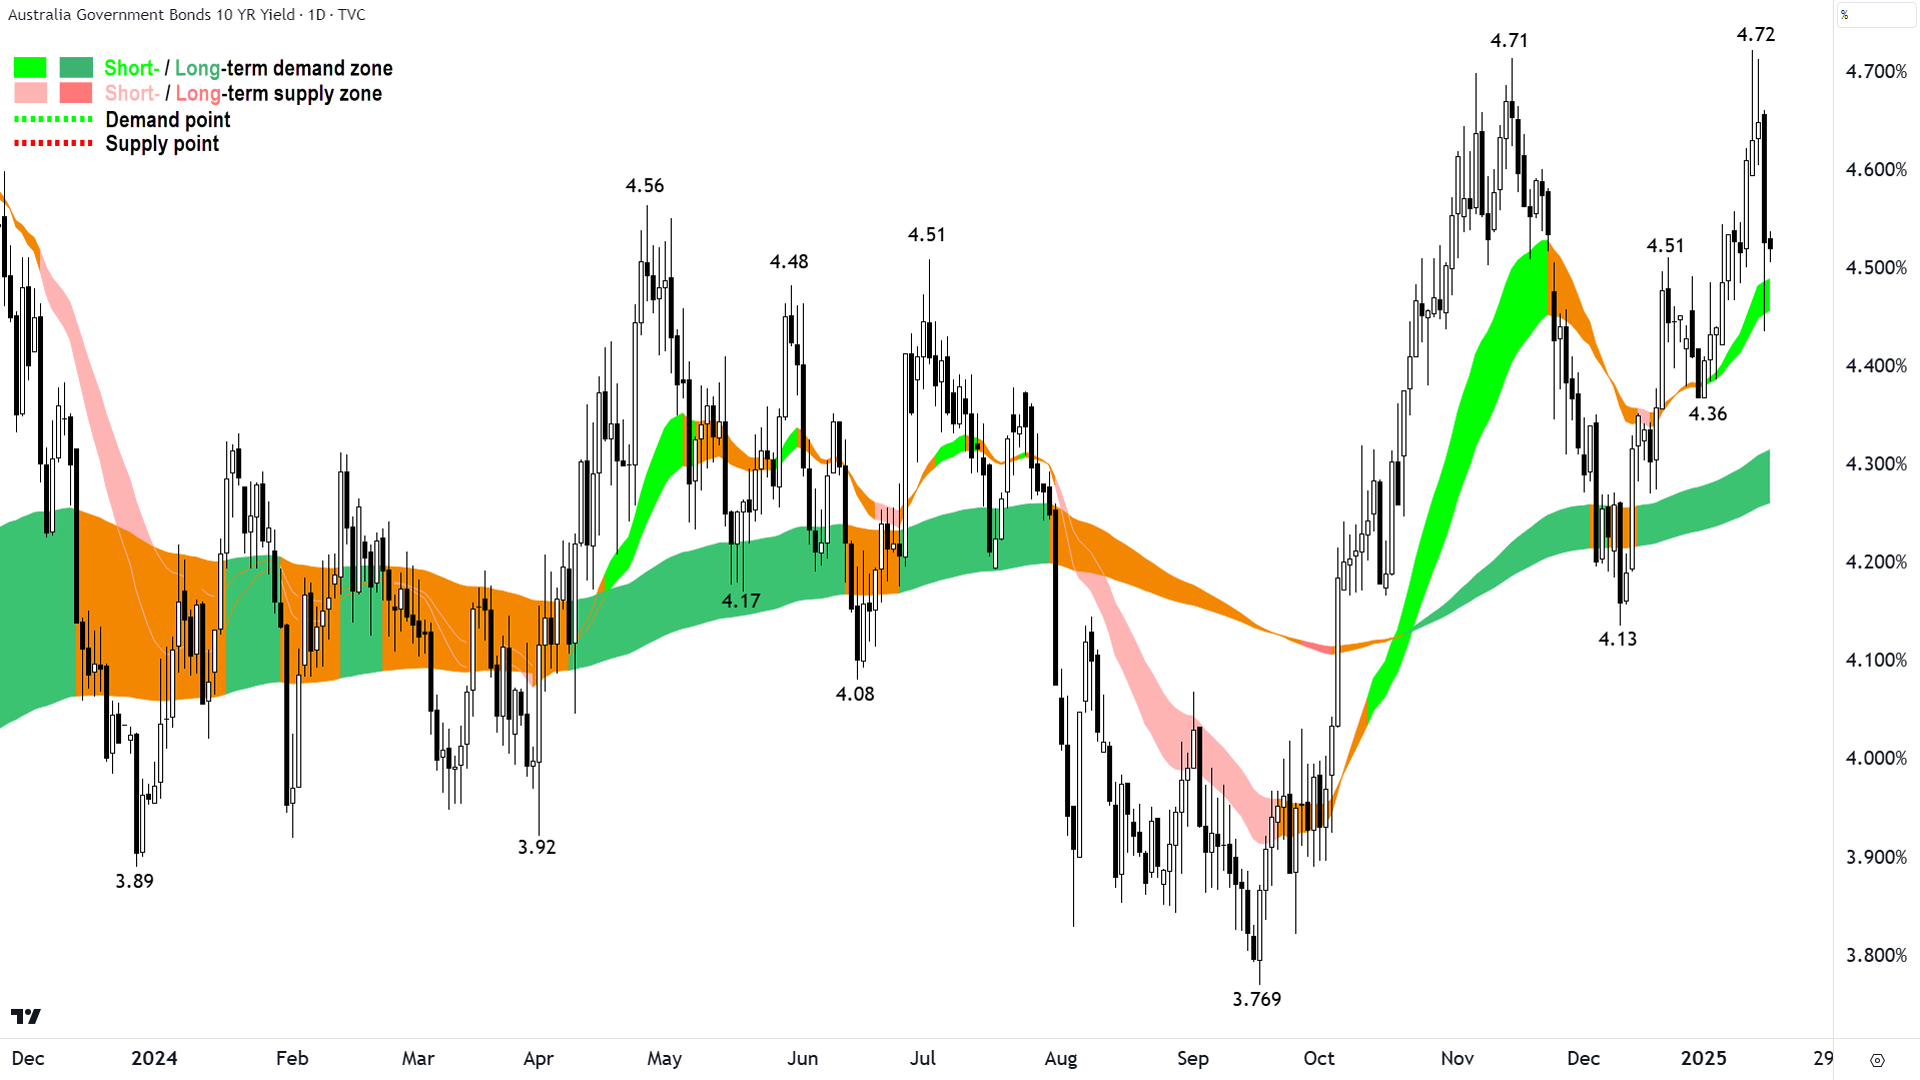
In case you’re wondering what the Aussie 10’s look like – see below. They tumbled in line with their US counterparts, but didn’t close with the same resounding near-session-low-flourish.
I looked at the intraday chart, and I reckon there's a bit of dirty data involved in that downward pointing shadow, so I’m going to discount it.

Australian 10 Year Government Bond Yield. Source: TradingView (click here for full size image)
Most importantly on our critical long term risk free rate benchmark, its yield appears to shrugging off the monster employment print earlier today, dipping into the close of Sydney trade (futures will continue trade overnight).
In summary, all short term signs in the above yield charts point to easing conditions for stocks in the very near term.
S&P/ASX 200 (XJO)
%20Chart%2016%20January%202025.png)
Stay the course. Source: TradingView (click here for full size image)
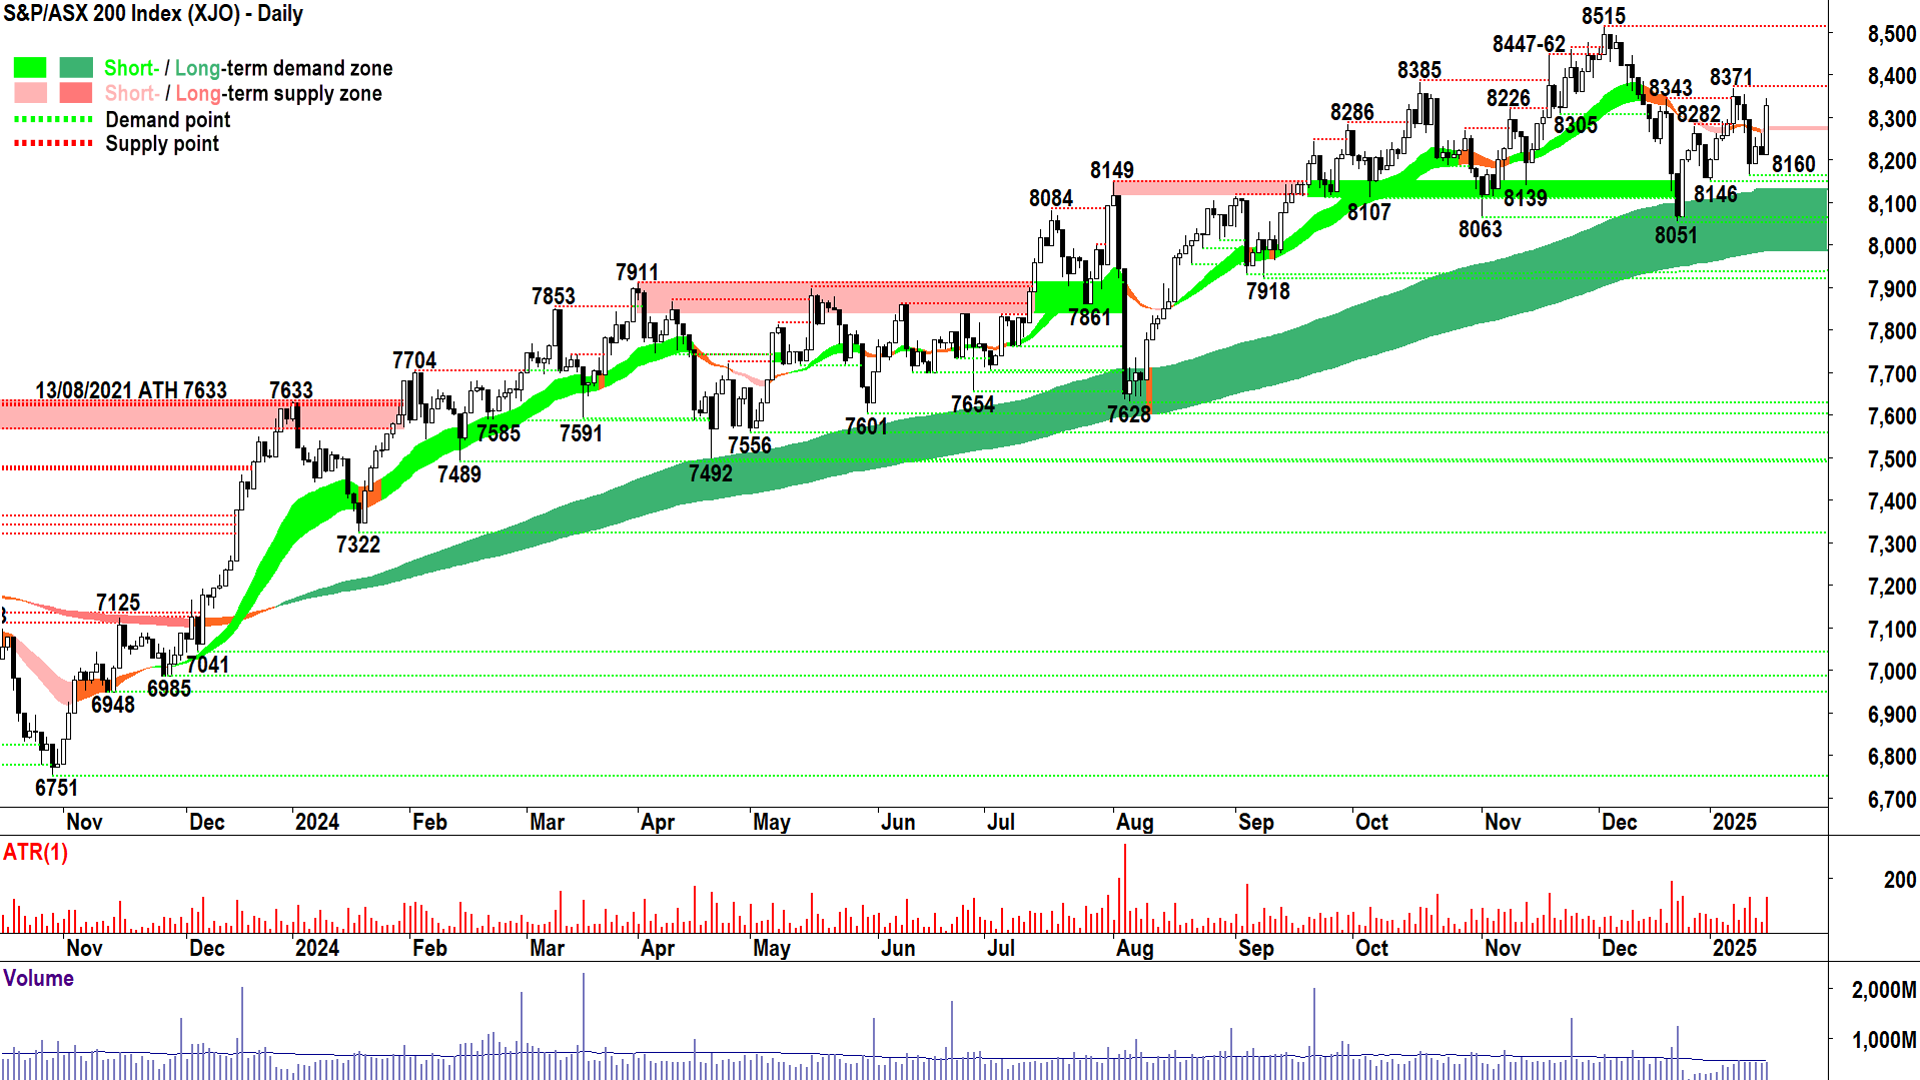
Big black candle in yields usually only means one thing for stocks: A big white candle.
And that's exactly what we saw in the XJO chart above. We can marvel at how much better the inflation print was than expected, or we can call a spade a spade and declare that market expectations and positioning had grown too far out of whack with reality over the last couple of weeks.
Investors seem to flip flop between bouts of extreme optimism and extreme pessimism. We just flipped.
If you're new to markets and this concept frustrates you, then you better just suck it up and get used to it. It's the norm – not the exception.
And three's very good chance we can maintain today's latest flip. Today's candle ratified the new 8160 trough, and given it's higher than 8146, which is also higher than 8051 – the XJO is exhibiting demand reinforcement / building demand. Peaks are also rising.
8371 is the next critical challenge. A close above there, I suggest, confirms the "let's get over December's pessimism" scenario, and sets us up for at least a tickle of the 8515 all-time high.
Of course, continued demand-side candles between here and there are a must (i.e., white bodies and or downward pointing shadows).
In terms of points of demand, it now appears 8051-8160 + dynamic demand from the long term uptrend ribbon is the key defining delineator between bull market and not-so-bull market going forward.
We must at all costs continue to trade above there. You will know something is wrong if we don't, or if before that you start to see an increasing prevalence of supply-side candles (i.e., black bodies and or upward pointing shadows), or a transition to falling peaks and falling troughs.
In the meantime, I see no reason to stay the course vis à vis the long term uptrend – albeit with a continued cautious approach.
Economy
Today
AUS Employment Data December
Change: +56,300 vs +14,500 forecast and +28,200 in November (full time -23,700 vs part time +80,000)
Unemployment Rate: 4.0% as forecast vs 3.9% in November
Participation Rate: 67.1% vs 67.0 in November
View: Yet another solid result. Great for workers, great for consumption, tax revenue, and the economy. So, also great for stock earnings. Not so great if you're the RBA and you were thinking of cutting rates in February! All but rules out the chances of the first cut occurring next month, March 31-April 1 is still in play, but May is the most likely as it is the first meeting to occur after the release of the super-important March quarter CPI data.
Later this week
Friday
00:30 USA Core Retail Sales December (+0.5% m/m forecast vs +0.2% m/m in November)
13:00 CHN Data Dump December
Gross Domestic Product qtr/y (+5.0% p.a. forecast vs 4.6% p.a. in September quarter)
Industrial Production y/y (+5.4% p.a. forecast vs +5.4% p.a. in November)
Retail Sales y/y (+3.5% p.a. forecast vs +3.0% p.a. in November)
Fixed Asset Investment ytd/y (+3.3% p.a. forecast vs +3.3% to November / previous corresponding period)
Unemployment Rate (5.0% forecast vs 5.0% in November)
NBS Press Conference
Latest News
Interesting Movers
Trading higher
+11.5% Neuren Pharmaceuticals (NEU) - Neuren JP Morgan Healthcare Conference 2025 presentation
+10.0% Zip Co. (ZIP) - No news, generally stronger ASX financial stocks today, US exposure/interest rate moves also likely assisting here, rise is consistent with prevailing long term uptrend 🔎📈
+8.2% Silver Mines (SVL) - No news, strong rally in silver price overnight as precious metals pricing generally supported by lower benchmark risk-free market yields, generally stronger ASX gold and precious metals stocks today
+7.3% Myer (MYR) - No news since yesterday's Apparel Brands Combination - Supplementary Ind Expert Report, really just a bounce here after the massive sell off that followed 13-Jan Trading Update
+6.8% Corporate Travel Management (CTD) - No news, rebound in the Australian dollar may have helped…
+6.0% Karoon Energy (KAR) - Becoming a substantial holder (First Sentier Investors), plus generally higher ASX energy stocks today on continued rally in energy commodities overnight, also retained at buy today by Citi and Goldman Sachs (see Broker Moves section below)
+5.9% Tabcorp (TAH) - Tabcorp appoints Chief Wagering Officer, rise is consistent with prevailing short term uptrend, long term trend is transitioning from down to up 🔎📈
+5.9% James Hardie Industries (JHX) - No news, major US exposure/beneficiary of lower benchmark risk-free yields
+5.8% Chalice Mining (CHN) - No news, precious metals exposure
+5.0% Ramelius Resources (RMS) - No news, ditto strong ASX precious metals sector
+4.7% Brainchip (BRN) - No news, generally stronger ASX information technology stocks today, US exposure/interest rate moves also likely assisting here
+4.5% Pinnacle Investment Management Group (PNI) - No news, generally stronger ASX financials stocks today, US exposure/interest rate moves also likely assisting here
+4.5% Generation Development Group (GDG) - No news, generally stronger ASX financials stocks today, US exposure/interest rate moves also likely assisting here, rise is consistent with prevailing short and long term uptrends – will be a Feature Chart in tomorrow's ChartWatch ASX Scans Uptrends list 🔎📈
+4.4% Emerald Resources (EMR) - Change of Director's Interest NoticeN and Change of Director's Interest Notice (2 x sizeable director on market purchases), ditto strong ASX precious metals sector
+4.4% Genesis Minerals (GMD) - Quarterly Activities Report - December 2024, ditto strong ASX precious metals sector
+4.2% Vault Minerals (VAU) - No news, ditto strong ASX precious metals sector
Trading lower
-4.3% Novonix (NVX) - No news, fall is consistent with prevailing short and long term downtrends, a regular in ChartWatch ASX Scans Downtrends list 🔎📉
-3.9% Vulcan Energy Resources (VUL) - No news…
-3.0% Spartan Resources (SPR) - No news…
-2.7% McMillan Shakespeare (MMS) - No news, fall is consistent with prevailing short term downtrend, repelled by short term downtrend ribbon 🔎📉
-2.5% Webjet (WJL) - No news, fall is consistent with prevailing long term downtrend, repelled by long term downtrend ribbon 🔎📉
-2.3% Cettire (CTT) - No news, fall is consistent with prevailing short and long term downtrends, a regular in ChartWatch ASX Scans Downtrends list 🔎📉
-2.2% Droneshield (DRO) - No news, fall is consistent with prevailing short and long term downtrends, a regular in ChartWatch ASX Scans Downtrends list 🔎📉
-2.0% Domino's Pizza Enterprises (DMP) - No news, fall is consistent with prevailing short and long term downtrends, a regular in ChartWatch ASX Scans Downtrends list 🔎📉
Broker Moves
Life360 (360)
Retained at overweight at Morgan Stanley; Price Target: $25.00
Alcoa Corporation (AAI)
Retained at buy at UBS; Price Target: $82.00
Aussie Broadband (ABB)
Retained at overweight at Jarden; Price Target: $4.00
Aeris Environmental (AEL)
Retained at neutral at Goldman Sachs; Price Target: $0.26
Alligator Energy (AGE)
Retained at buy at Bell Potter; Price Target: $0.10
AGL Energy (AGL)
Retained at neutral at Goldman Sachs; Price Target: $11.65 from $11.50
Ampol (ALD)
Retained at neutral at Goldman Sachs; Price Target: $32.30
ARB Corporation (ARB)
Retained at buy at Citi; Price Target: $49.22 from $50.00
Arafura Rare Earths (ARU)
Retained at hold at Bell Potter; Price Target: $0.15 from $0.17
AUB Group (AUB)
Initiated at hold at CLSA; Price Target: $32.80
Avjennings (AVJ)
Retained at hold at Bell Potter; Price Target: $0.70 from $0.67
Baby Bunting Group (BBN)
Upgraded to buy from neutral at Citi; Price Target: $2.01 from $1.98
Retained at overweight at Morgan Stanley; Price Target: $2.00
Retained at hold at Morgans; Price Target: $1.80
Retained at accumulate at Ord Minnett; Price Target: $2.15
Bellevue Gold (BGL)
Retained at buy at UBS; Price Target: $1.55
BHP Group (BHP)
Retained at neutral at UBS; Price Target: $42.00
Boss Energy (BOE)
Retained at buy at UBS; Price Target: $3.40
Beach Energy (BPT)
Downgraded at sell at Citi; Price Target: $1.30 from $1.20
Retained at sell at Goldman Sachs; Price Target: $1.33 from $1.30
Chalice Mining (CHN)
Retained at neutral at UBS; Price Target: $1.50
Capricorn Metals (CMM)
Retained at neutral at Macquarie; Price Target: $7.10
Cochlear (COH)
Retained at hold at Ord Minnett; Price Target: $315.50 from $301.00
Computershare (CPU)
Downgraded to neutral from buy at Goldman Sachs; Price Target: $35.50 from $31.00
Coronado Global Resources (CRN)
Retained at buy at Bell Potter; Price Target: $1.45 from $1.60
Retained at buy at UBS; Price Target: $1.50
CSL (CSL)
Retained at accumulate at Ord Minnett; Price Target: $318.00 from $320.00
Corporate Travel Management (CTD)
Retained at overweight at Morgan Stanley; Price Target: $16.40
De Grey Mining (DEG)
Retained at buy at UBS; Price Target: $2.20
DigiCo REIT (DGT)
Initiated at accumulate at Goldman Sachs; Price Target: $5.80
Deterra Royalties (DRR)
Retained at buy at UBS; Price Target: $4.90 from $4.95
Evolution Mining (EVN)
Retained at neutral at UBS; Price Target: $5.40
Fortescue (FMG)
Retained at sell at UBS; Price Target: $17.50 from $17.60
Genesis Minerals (GMD)
Retained at buy at UBS; Price Target: $2.80
Gold Road Resources (GOR)
Retained at buy at UBS; Price Target: $2.30
HMC Capital (HMC)
Retained at buy at Goldman Sachs; Price Target: $9.86 from $8.94
IGO (IGO)
Retained at outperform at Macquarie; Price Target: $5.90
Retained at neutral at UBS; Price Target: $5.45
Iluka Resources (ILU)
Retained at outperform at Macquarie; Price Target: $7.10
Retained at neutral at UBS; Price Target: $6.70
Imdex (IMd)
Retained at hold at Bell Potter; Price Target: $2.25
Integrated Research (IRI)
Retained at buy at Bell Potter; Price Target: $0.75 from $0.87
James Hardie Industries (JHX)
Retained at accumulate at Ord Minnett; Price Target: $58.00 from $57.00
Karoon Energy (KAR)
Retained at buy at Citi; Price Target: $2.00
Retained at buy at Goldman Sachs; Price Target: $2.04 from $2.15
Arcadium Lithium (LTM)
Retained at neutral at UBS; Price Target: $8.75
Liontown Resources (LTR)
Retained at sell at UBS; Price Target: $0.50
Lynas Rare Earths (LYC)
Retained at neutral at Macquarie; Price Target: $7.30
Retained at buy at UBS; Price Target: $7.95
Mineral Resources (MIN)
Retained at neutral at Macquarie; Price Target: $37.00
Retained at sell at UBS; Price Target: $34.00
Monadelphous Group (MND)
Downgraded to neutral from outperform at Macquarie; Price Target: $14.80 from $14.44
Newmont Corporation (NEM)
Retained at neutral at UBS; Price Target: $82.00
Nickel Industries (NIC)
Retained at buy at UBS; Price Target: $1.10
Northern Star Resources (NST)
Retained at buy at UBS; Price Target: $19.05
Origin Energy (ORG)
Retained at buy at Citi; Price Target: $12.50 from $11.00
Downgraded to neutral from buy at Goldman Sachs; Price Target: $10.40 from $10.30
Retained at neutral at Jarden; Price Target: $9.90
Paladin Energy (PDN)
Retained at buy at UBS; Price Target: $9.90
Pilbara Minerals (PLS)
Retained at neutral at Macquarie; Price Target: $3.25
Retained at sell at UBS; Price Target: $2.40
Patriot Battery Metals (PMT)
Retained at buy at UBS; Price Target: $0.60
Premier Investments (PMV)
Retained at neutral at Macquarie; Price Target: $29.00 from $34.20
Perseus Mining (PRU)
Retained at buy at UBS; Price Target: $3.35
Rubix Resources (RBC)
Retained at sector perform at RBC Capital Markets; Price Target: $1.60
Ramsay Health Care (RHC)
Retained at hold at Ord Minnett; Price Target: $41.45 from $42.40
Rio Tinto (RIO)
Retained at neutral at UBS; Price Target: $124.00
Resmed Inc (RMD)
Upgraded to buy from hold at Ord Minnett; Price Target: $43.90 from $40.05
Ramelius Resources (RMS)
Retained at outperform at Macquarie; Price Target: $2.60
Regis Resources (RRL)
Retained at outperform at Macquarie; Price Target: $3.40 from $3.30
Retained at sell at UBS; Price Target: $2.10
South32 (S32)
Retained at buy at UBS; Price Target: $4.00 from $4.30
Steadfast Group (SDF)
Initiated at outperform at CLSA; Price Target: $6.60
Seek (SEK)
Retained at outperform at Macquarie; Price Target: $25.00 from $28.00
Sandfire Resources (SFR)
Retained at sell at UBS; Price Target: $9.85
Sonic Healthcare (SHL)
Retained at lighten at Ord Minnett; Price Target: $25.45 from $23.85
Superloop (SLC)
Retained at buy at Jarden; Price Target: $2.50
Santos (STO)
Retained at buy at Citi; Price Target: $7.60
Retained at buy at Goldman Sachs; Price Target: $7.75 from $7.90
Strike Energy (STX)
Retained at buy at Goldman Sachs; Price Target: $0.25 from $0.26
Talga Group (TLG)
Retained at buy at UBS; Price Target: $1.70
Telstra Group (TLS)
Retained at overweight at Jarden; Price Target: $4.20
TPG Telecom (TPG)
Retained at overweight at Jarden; Price Target: $5.25
Viva Energy Group (VEA)
Retained at buy at Goldman Sachs; Price Target: $3.35 from $3.30
West African Resources (WAF)
Retained at outperform at Macquarie; Price Target: $2.20
Woodside Energy Group (WDS)
Retained at sell at Citi; Price Target: $23.50 from $21.50
Retained at neutral at Goldman Sachs; Price Target: $25.90 from $26.90
Whitehaven Coal (WHC)
Retained at buy at Bell Potter; Price Target: $9.00
Worley (WOR)
Retained at buy at Citi; Price Target: $18.00
Scans
Top Gainers
Code | Company | Last | % Chg |
|---|---|---|---|
| CND | Condor Energy Ltd | $0.027 | +42.11% |
| KLI | Killi Resources Ltd | $0.081 | +35.00% |
| GLL | Galilee Energy Ltd | $0.013 | +30.00% |
| SCP | Scalare Partners Holdings Ltd | $0.20 | +29.03% |
| AI1 | Adisyn Ltd | $0.105 | +23.53% |
Top Fallers
Code | Company | Last | % Chg |
|---|---|---|---|
| BTC | BTC Health Ltd | $0.051 | -31.08% |
| SNX | Sierra Nevada Gold Inc | $0.033 | -23.26% |
| ASE | Astute Metals NL | $0.021 | -22.22% |
| WGR | Western Gold Resources Ltd | $0.054 | -21.74% |
| TM1 | Terra Metals Ltd | $0.03 | -18.92% |
52 Week Highs
Code | Company | Last | % Chg |
|---|---|---|---|
| AI1 | Adisyn Ltd | $0.105 | +23.53% |
| HCT | Holista Colltech Ltd | $0.027 | +22.73% |
| TVN | Tivan Ltd | $0.13 | +18.18% |
| AYA | ARTRYA Ltd | $0.96 | +15.66% |
| MEK | Meeka Metals Ltd | $0.11 | +12.25% |
52 Week Lows
Code | Company | Last | % Chg |
|---|---|---|---|
| ASE | Astute Metals NL | $0.021 | -22.22% |
| AZL | Arizona Lithium Ltd | $0.011 | -15.39% |
| BGT | Bio-Gene Technology Ltd | $0.035 | -14.63% |
| RLT | Renergen Ltd | $0.345 | -13.75% |
| BIT | Biotron Ltd | $0.015 | -11.77% |
Near Highs
Code | Company | Last | % Chg |
|---|---|---|---|
| PCI | Perpetual Credit Income Trust | $1.175 | 0.00% |
| WVOL | Ishares MSCI World Ex Aust Minimum Volatility ETF | $42.25 | +0.64% |
| IAGPF | Insurance Australia Group Ltd | $104.18 | +0.17% |
| GCI | Gryphon Capital Income Trust | $2.06 | +0.49% |
| VVLU | Vanguard Global Value Equity Active ETF | $75.32 | +1.67% |
Relative Strength Index (RSI) Oversold
Code | Company | Last | % Chg |
|---|---|---|---|
| AVH | Avita Medical Inc | $2.86 | 0.00% |
| RFG | Retail Food Group Ltd | $2.19 | 0.00% |
| JIN | Jumbo Interactive Ltd | $12.52 | -1.42% |
| PPE | Peoplein Ltd | $0.85 | -1.16% |
| FDV | Frontier Digital Ventures Ltd | $0.30 | -3.23% |
