News | Market Wraps
Evening Wrap: ASX 200 slips despite iron ore price boosting Fortescue, Mineral Resources, gold stocks still sublime
The S&P/ASX 200 closed 46.1 points lower, down 0.52%.

Mentioned
The S&P/ASX 200 closed 46.1 points lower, down 0.52%.
Energy, Real Estate, Healthcare, Financials, Resources… they all struggled today, and it meant it was largely one way traffic for the ASX 200 in what was a dour trading session with few highlights.
Unless of course, your entire portfolio is in gold stocks. In that case, you had a fantastic day! But that would be totally irresponsible, wouldn’t it? Or would it!? 😜
Be sure to click/scroll through for the usual reporting of the major sector and stock-specific moves, the broker responses to them, as well as all the key economic data in tonight's Evening Wrap.
Also, I have detailed technical analysis on the Nasdaq Composite and the S&P/ASX 200 in today's ChartWatch.
Let's dive in!
Today in Review
Tue 09 Sep 25, 4:55pm (AEST)
Name | Value | % Chg |
|---|---|---|
Major Indices | ||
| ASX 200 | 8,803.5 | -0.52% |
| All Ords | 9,080.7 | -0.51% |
| Small Ords | 3,636.3 | -0.08% |
| All Tech | 4,214.1 | -0.12% |
| Emerging Companies | 2,697.5 | -0.52% |
Currency | ||
| AUD/USD | 0.6609 | +0.26% |
US Futures | ||
| S&P 500 | 6,516.5 | +0.16% |
| Dow Jones | 45,636.0 | +0.13% |
| Nasdaq | 23,846.0 | +0.19% |
Name | Value | % Chg |
|---|---|---|
Sector | ||
| Information Technology | 2,934.8 | +0.41% |
| Consumer Discretionary | 4,545.4 | +0.27% |
| Utilities | 9,853.4 | +0.06% |
| Consumer Staples | 12,134.4 | -0.19% |
| Materials | 17,789.8 | -0.35% |
| Communication Services | 1,874.8 | -0.64% |
| Financials | 9,500.9 | -0.68% |
| Industrials | 8,547.9 | -0.74% |
| Health Care | 38,928.8 | -0.88% |
| Real Estate | 4,093.5 | -0.89% |
| Energy | 8,898.0 | -0.99% |
Markets
%20intraday%20chart_9%20Sep.png)
ASX 200 Session Chart
The S&P/ASX 200 (XJO) finished 46.1 points lower at 8,803.5, 0.52% from its session high and 0.23% from its low. In the broader-based S&P/ASX 300 (XKO) advancers lagged decliners by rather dismal 108 to 170.
Weren’t we making record highs just a couple of weeks ago? 🤔
What gives… Now we just can’t seem to find that winning feeling anymore. It’s probably not as bad as it feels. Firstly, consider that it is September, so that means plenty of price sapping dividends (don’t worry, those cheques are in the mail!). Secondly, it's September – a month that has a long tradition of being the worst performing month of the year for global stock markets – and that includes Australia.
So, perhaps we just need to muddle through and get to the end of it. And muddle we did today…😭
If you weren’t in Gold (XGD) (+1.3%) stocks (the gold price just keeps on keeping on!), then you probably saw plenty of red across your portfolio when you checked your preferred broking platform this evening.
%20chart%209%20August%202025.png)
Gold Futures (Front month, back-adjusted) COMEX
On a one way train to Struggle Town today, were Energy (XEJ) (-1.0%), Real Estate (XPJ) (-0.9%), Healthcare (XHJ) (-0.9%), and Financials (-0.7%).
Resources (XJR) (-0.4%) probably looked worse than it was given the drag from majors BHP Group (BHP) (-1.0%), Rio Tinto (-1.0%). Not even a rising iron ore price – which tipped its highest level since October 8 last year – was enough stoke them. I do note however, that Fortescue (1.5%) and Mineral Resources (MIN) (+0.9%) did manage a decent gain.

Iron Ore 62% (Front month, back-adjusted) SGX
Lithium was generally softer, with Pilbara Minerals (PLS) (-3.2%) and Liontown Resources (LTR) (-2.0%) easing, while uranium was mixed – Boss Energy (BOE) (-2.4%) lost ground while Paladin (PDN) (+0.2%) and Deep Yellow (DYL) (+0.8%) and Nexgen Energy (NXG) (+0.4%) added to yesterday's gains.
Lynas Rare Earths (LYC) (+2.8%) and Sandfire Resources (SFR) (+1.9%) capped a strong energy transition metals sector.
Today's best blue chip gainers
Company | Last Price | Change $ | Change % | 1mo % | 1yr % |
|---|---|---|---|---|---|
IDP Education (IEL) | $5.55 | +$0.24 | +4.5% | +21.7% | -64.4% |
Reliance Worldwide Corporation (RWC) | $4.24 | +$0.12 | +2.9% | -3.2% | -20.6% |
Lynas Rare Earths (LYC) | $14.81 | +$0.4 | +2.8% | +17.4% | +119.7% |
Life360 (360) | $49.85 | +$1.34 | +2.8% | +31.8% | +171.8% |
Evolution Mining (EVN) | $9.12 | +$0.19 | +2.1% | +18.9% | +130.9% |
Technology One (TNE) | $38.42 | +$0.77 | +2.0% | -1.9% | +68.1% |
Sandfire Resources (SFR) | $12.53 | +$0.23 | +1.9% | +7.6% | +53.7% |
Telix Pharmaceuticals (TLX) | $13.82 | +$0.22 | +1.6% | -18.2% | -20.8% |
Nextdc (NXT) | $16.84 | +$0.26 | +1.6% | +15.4% | -3.3% |
Bendigo and Adelaide Bank (BEN) | $12.67 | +$0.19 | +1.5% | +0.9% | +7.2% |
Fortescue (FMG) | $19.09 | +$0.28 | +1.5% | -1.7% | +18.4% |
Challenger (CGF) | $8.49 | +$0.08 | +1.0% | +3.4% | +36.3% |
Mineral Resources (MIN) | $38.15 | +$0.35 | +0.9% | +0.1% | +18.5% |
Washington H Soul Pattinson & Company (SOL) | $44.30 | +$0.4 | +0.9% | +4.9% | +30.6% |
Insurance Australia Group (IAG) | $8.57 | +$0.06 | +0.7% | +4.8% | +11.3% |
Resmed Inc (RMD) | $42.20 | +$0.28 | +0.7% | -3.0% | +16.5% |
JB HI-FI (JBH) | $116.20 | +$0.69 | +0.6% | +8.7% | +45.4% |
Northern Star Resources (NST) | $20.22 | +$0.12 | +0.6% | +13.9% | +39.3% |
ALS (ALQ) | $18.88 | +$0.11 | +0.6% | +1.8% | +24.4% |
Wesfarmers (WES) | $92.29 | +$0.5 | +0.5% | +4.2% | +33.3% |
Today's worst blue chip losers
Company | Last Price | Change $ | Change % | 1mo % | 1yr % |
|---|---|---|---|---|---|
Pilbara Minerals (PLS) | $2.40 | -$0.08 | -3.2% | +3.9% | -7.0% |
Pinnacle Investment Management Group (PNI) | $18.66 | -$0.6 | -3.1% | -20.0% | +13.1% |
IGO (IGO) | $4.79 | -$0.14 | -2.8% | -11.8% | -9.1% |
James Hardie Industries (JHX) | $30.20 | -$0.72 | -2.3% | -30.9% | -45.1% |
Goodman Group (GMG) | $32.81 | -$0.66 | -2.0% | -7.3% | +0.4% |
Orora (ORA) | $2.01 | -$0.04 | -2.0% | -5.2% | -22.4% |
Bluescope Steel (BSL) | $22.38 | -$0.44 | -1.9% | -6.8% | +12.1% |
Brambles (BXB) | $25.90 | -$0.48 | -1.8% | +10.9% | +41.0% |
Light & Wonder (LNW) | $135.58 | -$2.33 | -1.7% | +10.2% | -15.2% |
CSL (CSL) | $209.94 | -$3.43 | -1.6% | -20.4% | -30.7% |
Amcor (AMC) | $12.40 | -$0.2 | -1.6% | -16.7% | -25.9% |
South32 (S32) | $2.61 | -$0.04 | -1.5% | -15.0% | -14.1% |
Cleanaway Waste Management (CWY) | $2.70 | -$0.04 | -1.5% | -6.9% | -5.3% |
Computershare (CPU) | $36.16 | -$0.52 | -1.4% | -12.9% | +29.0% |
Ampol (ALD) | $30.05 | -$0.42 | -1.4% | +10.9% | +4.4% |
Hub24 (HUB) | $100.84 | -$1.4 | -1.4% | -6.3% | +83.4% |
Endeavour Group (EDV) | $3.64 | -$0.05 | -1.4% | -11.7% | -27.1% |
Dyno Nobel (DNL) | $2.92 | -$0.04 | -1.4% | -1.4% | -3.9% |
Commonwealth Bank of Australia (CBA) | $166.08 | -$2.16 | -1.3% | -7.0% | +17.5% |
Woodside Energy Group (WDS) | $24.68 | -$0.3 | -1.2% | -8.7% | -1.3% |
ChartWatch
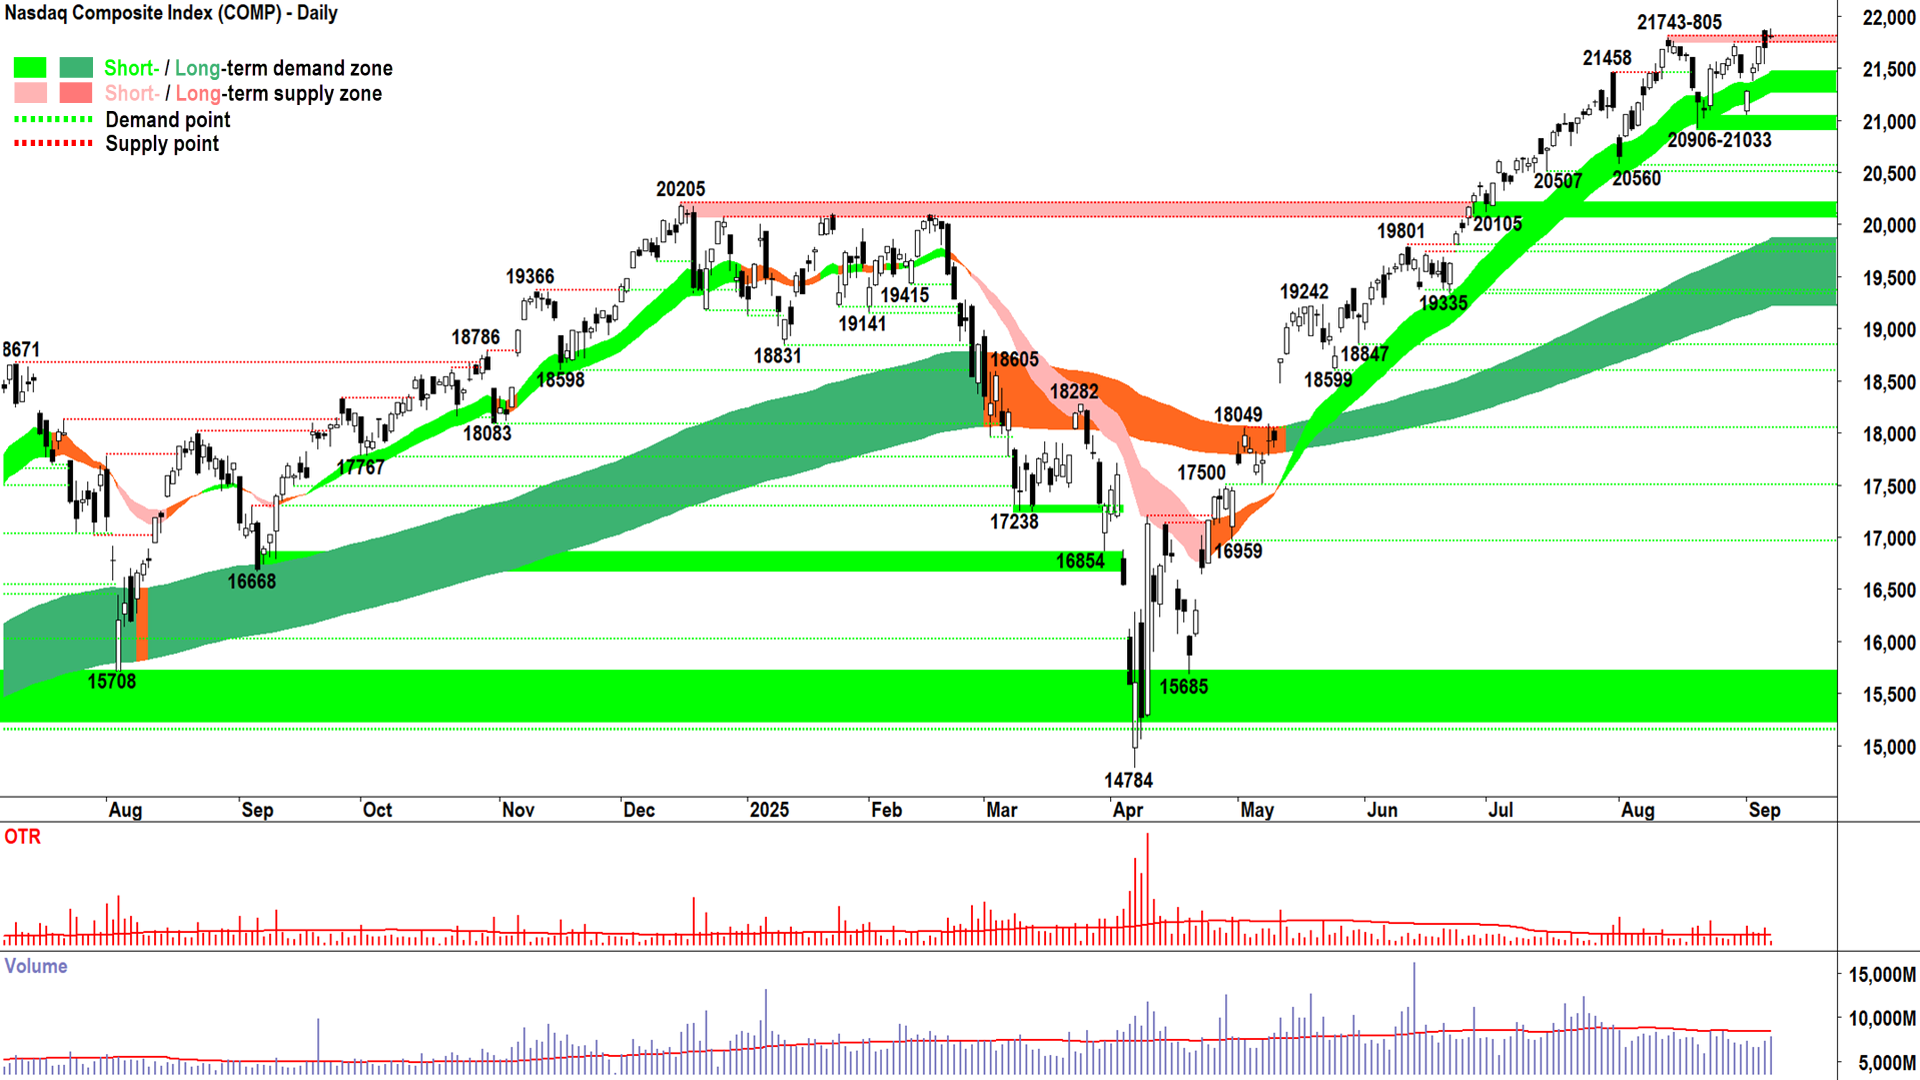
Nasdaq Composite Index

Nasdaq Composite Index chart (click here for full size image)
A couple of interesting candles since our last update. Friday was a null candle for me – black body, downward pointing shadow – of equal parts… with a marginally higher high and higher low to the previous candle = Dead heat.
Monday’s candle (i.e. the last on the screen), is a similar, nothing affair. 🥱
So, really, not a great deal has changed in terms of demand-vs-supply-side control for the Comp… except for one important item which we had anticipated.
That item is of course, the latent supply we were expecting at the 21743-805 zone of supply. If anything, we would have been more surprised if we didn’t see some degree of trepidation among investors here.
The demand-side is clearly in control, but their demand is bashing up against modestly increased supply (check the volume up over last couple of sessions – its rising, but it remains below average). The colour and shape of those last two candles is exactly symptomatic of this interaction.
This trepidation, this inability to push straight through an old peak is what regular technical analysts refer to as “resistance”.
Personally, I don’t like that term, because resistance to push straight through an old trough is somehow called “support”. They’re both resistance, though… correct? 🤔
For everyone out there who ever wondered why I don't use the terms support and resistance in my technical analysis – there’s your answer – it's because they are inherently faulty terms and concepts.
However, one cannot argue when I on the other hands say that a particular area will likely act as a point or zone of excess supply (aka, resistance!) or that a particular area will likely act as a point or zone of excess demand (aka, support!).
But this reflects my experience in technical analysis… There’s plenty of blah blah blah blah… and not enough D +S = P.
As I step down from my soap box, can I leave you with these thoughts on the Comp:
Short & long term uptrends intact, trend ribbons acting as zones of dynamic excess demand = accumulation, buy the dip
Price action is rising peaks and rising troughs (i.e., supply removal and demand reinforcement) = buy the dip
Candles are predominantly demand-side in nature (i.e., white-bodied and or downward pointing shadows) = buy the dip, pervasive programmed buy orders
Short term uptrend remains intact until a close below the short term uptrend ribbon (presently 21270-21460).
We don’t want to see strong supply-side candles (i.e., long black-bodied and or long upward pointing shadows), or a lower peak (i.e., supply reinforcement).
Conclusion: Stay the course = FRP.
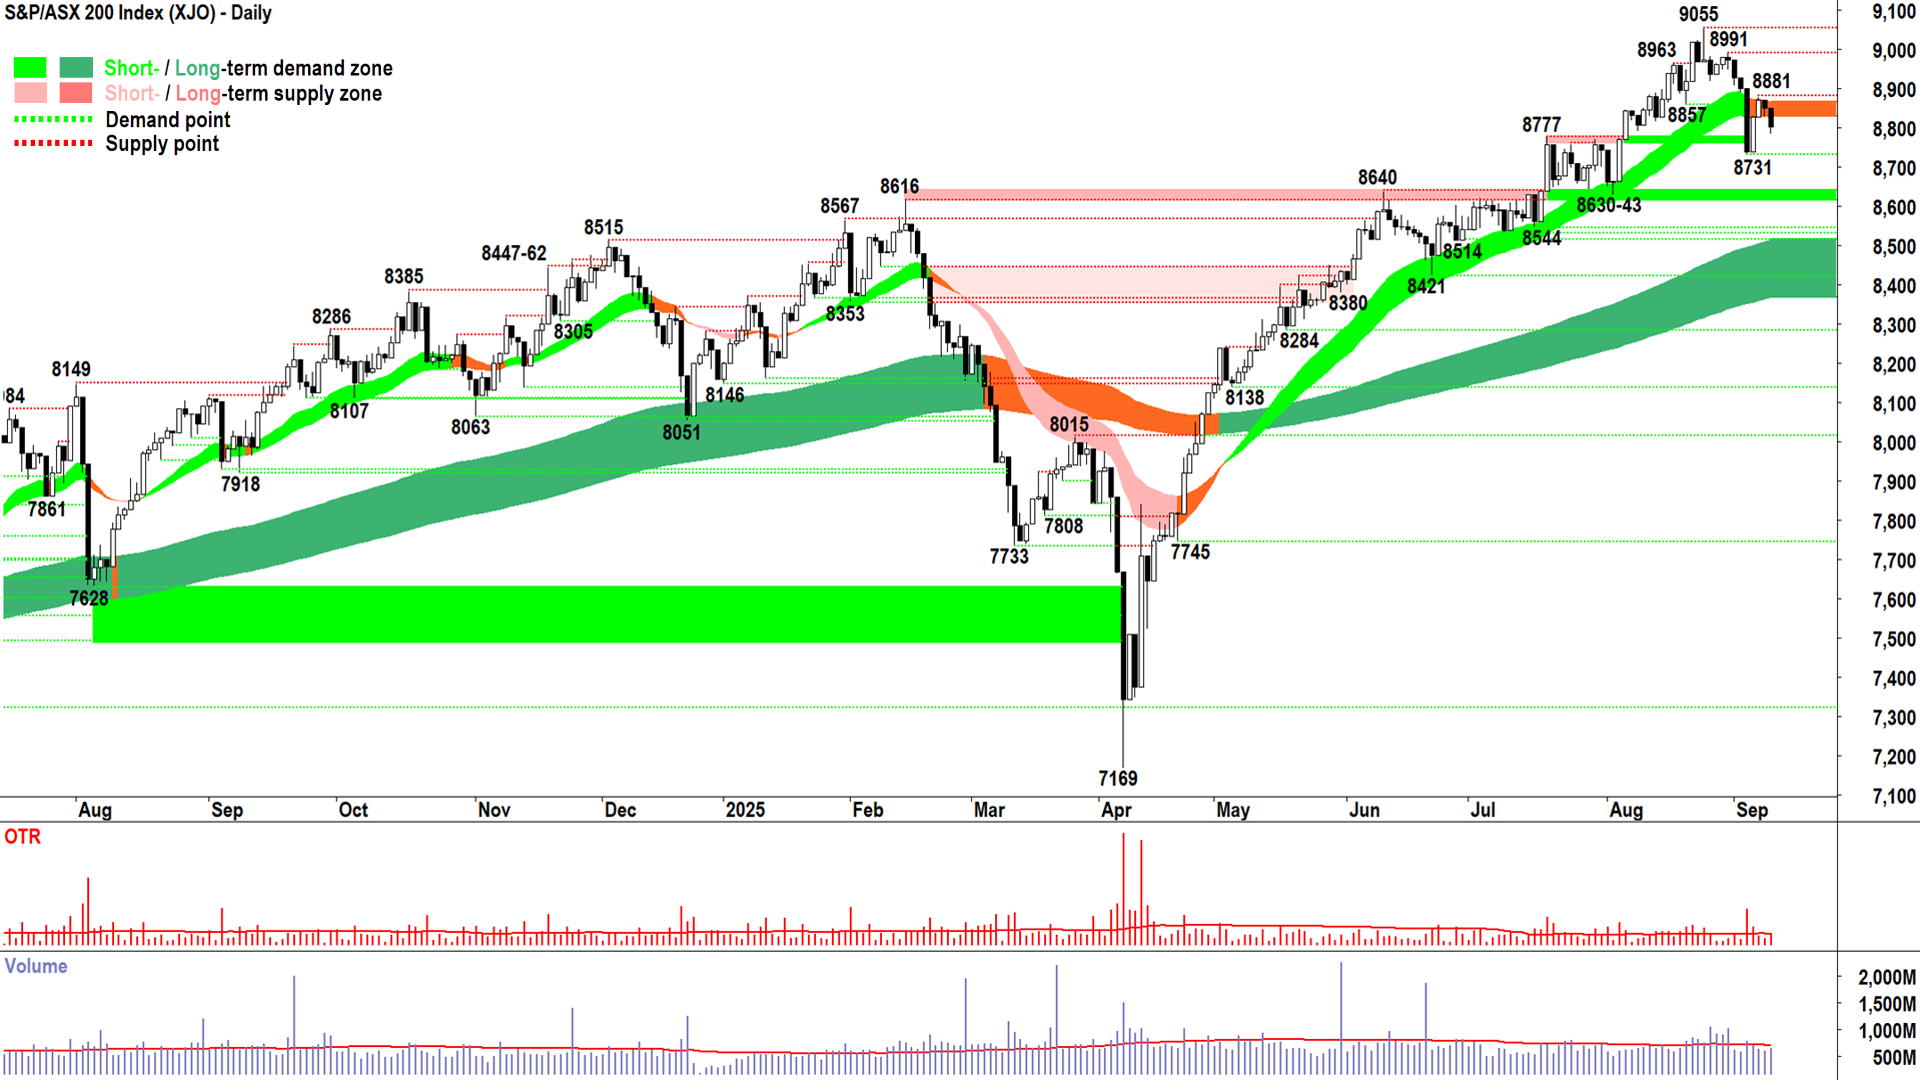
S&P/ASX 200 (XJO)
%20chart_9%20Sep.png)
S&P/ASX 200 chart (click here for full size image)
Talk about “resistance”! 😉
We’ve seen some clear resistance to continuing Thursday and Friday’s two-day gain – those gains of course coming post Wednesday’s wipe out.
That wipe out – that long black candle with close at the low of the session – remains the dominant and most important candle on the XJO’s chart for the immediate future.
It’s literally and figuratively a dark shadow hanging over the demand-supply environment for Australian shares.
Today’s candle shows a lower high and lower low, which is the trigger to set 8881 as a new, lower peak (to 8991 and 9055). We are still lower troughs = the price action is decidedly supply-side in nature (supply reinforcement and demand removal).
Today’s supply-side candle merely confirms what we already knew – or at least what I told you on Wednesday and Thursday last week: In the absence of a quick and strong response to Wednesday’s candle – the XJO is more likely to languish rather than thrive.
The other thing which disturbs me here, is that the short term uptrend ribbon appears to be beginning to act as a zone of dynamic supply – the opposite of what we want. One hundred percent we want to see the XJO price bouncing up from above the short term uptrend ribbon and not bouncing down from below it = ⚠️.
All is not lost… You know the next sentence I usually type when the chart above looks like it does: Don’t write off the long term uptrend.
This is still very much a bull market, and therefore we should expect the short term uptrend to revert back to up rather than the long term trend move to match its short term counterpart.
8731 is an important hold now to maintain the faith among the faithful (!!!). Below it is a slippery slope back to what I think is the “big one” in terms of zones of demand (okay…”support”!) – i.e., the original breakout level of 8616-40. Close below that, and the bull market is going to be looking very, very sick.
That’s the stuff we don’t want to see… what do we want to see? 🤔
You already know the answer to that one, too! White candles. Big ones. Preferably one that closes above 8881 ASAP (as in tomorrow would be ideal). Then a few more, just to reset investor expectations back to a more bull market aligned phase!
Based on the two candles since our last chat, I see no reason to change my personal portfolio risk setting here: 2/3RP.
Economy
Today
Westpac Consumer Sentiment September
-3.1% to 95.4 (readings below 100 indicate pessimism vs above 100 indicate optimism)
From WBC:
Finances continue to improve but renewed concern about economic outlook.
Consumers a little less confident about further rate cuts.
Unemployment expectations back around long run averages.
Risk aversion eases a little but still elevated. • House price expectations hit 15- year high.

Westpac Consumer Sentiment Index. Sources: Westpac Economics, Melbourne Institute
NAB Business Confidence Survey August
Confidence: -3 index points to +4 index points (July revised +1 point)
Strongest was construction and transport & utilities vs weakest was mining and wholesale remained the weakest industries.
Conditions: +2 index points to +7 index points
Driven by moderate gains in profitability and employment.

NAB Business Confidence Survey. Source: National Australia Bank Limited
Later this week
Wednesday
11:30 CHN Inflation data August
Consumer Price Index (CPI): -0.2% p.a. forecast vs +0.0% p.a. in July
Producer Price Index (PPI): -2.9% p.a. forecast vs -3.6% p.a. in July
22:30 USA Core PPI August (+0.3% m/m forecast vs +0.9% m/m in July)
Thursday
22:15 EUR European Central Bank (ECB) meeting
Main Refinancing Rate: No change at 2.15% p.a.
Monetary Policy Statement & Press Conference (at 22:45)
22:30 USA Core CPI August (+0.3% m/m forecast vs +0.3% m/m in July)
Friday
00:00 30-year Bond Auction
Saturday
00:00 Prelim UoM Consumer Sentiment & Inflation Expectations September
Consumer Sentiment: 58.2 forecast unchanged from August
Latest News
Interesting Movers
Trading higher
+17.2% Imricor Medical Systems (IMR) - No news 🤔.
+16.7% Boab Metals (BML) - No news, general strength across the broader Precious Metals sector today, rise is consistent with prevailing short and long term uptrends, a regular in ChartWatch ASX Scans Uptrends list 🔎📈
+16.3% Echoiq (EIQ) - No news 🤔.
+14.3% Dreadnought Resources (DRE) - No news since 08-Sep Star of Mangaroon Daylights with [email protected] g/t Au fr Surface, general strength across the broader Precious Metals sector today, rise is consistent with prevailing short term uptrend and long term trend is transitioning from down to up 🔎📈
+13.3% Polymetals Resources (POL) - Endeavor Silver Zinc Mine-September Update, general strength across the broader Precious Metals sector today, rise is consistent with prevailing short and long term uptrends 🔎📈
+12.0% Golden Horse Minerals (GHM) - No news, general strength across the broader Critical Minerals sector today, rise is consistent with prevailing short and long term uptrends, a recent regular in ChartWatch ASX Scans Uptrends list 🔎📈
Trading lower
-27.5% 4DMEDICAL (4DX) - No news since 08-Sep 4DX signs agreements with national lung screening sites, pulled back in the wake of recent sharp rally.
-17.6% Kaili Resources (KLR) - Drilling Commenced for REEs in South Australia, today's move is consistent with recent volatility.
-10.5% Zeotech (ZEO) - Application for quotation of securities, pulled back in the wake of recent sharp rally.
-10.0% Iperionx (IPX) - Change of Director's Interest Notice x3 .
-8.3% EQ Resources (EQR) - No news since 05-Sep EQR Investor Presentation, fall is consistent with prevailing short and long term downtrends 🔎📉
Broker Moves
29Metals (29M)
Retained at neutral at Barrenjoey; Price Target: $0.30
Alcoa Corporation (AAI)
Initiated at overweight at Barrenjoey; Price Target: $63.00
Initiated at buy at Ord Minnett; Price Target: $63.00
AMP (AMP)
Retained at buy at Citi; Price Target: $2.00
Arena REIT (ARF)
Downgraded to neutral from outperform at Macquarie; Price Target: $4.01
ASX (ASX)
Retained at neutral at Citi; Price Target: $67.10
Bega Cheese (BGA)
Retained at outperform at Macquarie; Price Target: $6.60
Bellevue Gold (BGL)
Retained at neutral at Barrenjoey; Price Target: $1.10
BHP Group (BHP)
Retained at neutral at Barrenjoey; Price Target: $42.50
Boss Energy (BOE)
Retained at underweight at Barrenjoey; Price Target: $2.00
Upgraded to neutral from sell at UBS; Price Target: $2.00 from $3.50
Challenger (CGF)
Retained at buy at Citi; Price Target: $9.20
Chalice Mining (CHN)
Retained at underweight at Barrenjoey; Price Target: $0.90
Collins Foods (CKF)
Retained at neutral at Macquarie; Price Target: $8.50
Charter Hall Long Wale REIT (CLW)
Downgraded to underweight from neutral at JPMorgan; Price Target: $4.30
Capricorn Metals (CMM)
Retained at overweight at Barrenjoey; Price Target: $11.00
Coles Group (COL)
Retained at outperform at Macquarie; Price Target: $25.40
Computershare (CPU)
Retained at neutral at Citi; Price Target: $40.40
Coronado Global Resources Inc (CRN)
Retained at underweight at Barrenjoey; Price Target: $0.25
Capstone Copper Corp. (CSC)
Retained at overweight at Barrenjoey; Price Target: $12.00
Centaurus Metals (CTM)
Retained at overweight at Barrenjoey; Price Target: $0.55
Core Lithium (CXO)
Retained at neutral at Barrenjoey; Price Target: $0.11
Delta Lithium (DLI)
Retained at neutral at Barrenjoey; Price Target: $0.17
Deterra Royalties (DRR)
Retained at neutral at Barrenjoey; Price Target: $4.40
Deep Yellow (DYL)
Retained at neutral at Barrenjoey; Price Target: $1.80
EBOS Group (EBO)
Retained at accumulate at Ord Minnett; Price Target: $33.00 from $37.80
Endeavour Group (EDV)
Retained at underperform at Macquarie; Price Target: $3.60
Emerald Resources NL (EMR)
Retained at underweight at Barrenjoey; Price Target: $3.65
Evolution Mining (EVN)
Retained at neutral at Barrenjoey; Price Target: $8.10
FireFly Metals (FFM)
Retained at overweight at Barrenjoey; Price Target: $1.60
Fortescue (FMG)
Retained at neutral at Barrenjoey; Price Target: $20.00
Greatland Resources (GGP)
Retained at overweight at Barrenjoey; Price Target: $10.00
Global Lithium Resources (GL1)
Retained at neutral at Barrenjoey; Price Target: $0.20
Genesis Minerals (GMD)
Retained at underweight at Barrenjoey; Price Target: $3.95
Gold Road Resources (GOR)
Retained at underweight at Barrenjoey; Price Target: $3.37
Growthpoint Properties Australia (GOZ)
Upgraded to outperform from neutral at Macquarie; Price Target: $2.58 from $2.38
GPT Group (GPT)
Upgraded to outperform from neutral at Macquarie; Price Target: $5.77 from $5.29
HomeCo Daily Needs REIT (HDN)
Downgraded to neutral from overweight at JPMorgan; Price Target: $1.40
Harvey Norman Holdings (HVN)
Retained at outperform at Macquarie; Price Target: $7.40
IGO (IGO)
Retained at overweight at Barrenjoey; Price Target: $5.25
Inghams Group (ING)
Retained at neutral at Macquarie; Price Target: $2.70
Retained at neutral at Shaw and Partners; Price Target: $2.80 from $3.65
JB Hi-Fi (JBH)
Retained at outperform at Macquarie; Price Target: $118.00
James Hardie Industries Plc (JHX)
Retained at outperform at Macquarie; Price Target: $37.20 from $36.90
Liberty Financial Group (LFG)
Retained at neutral at Citi; Price Target: $4.50
LendLease Group (LLC)
Upgraded to overweight from neutral at JPMorgan; Price Target: $6.50
Liontown Resources (LTR)
Retained at underweight at Barrenjoey; Price Target: $0.70
Lynas Rare Earths (LYC)
Retained at overweight at Barrenjoey; Price Target: $17.50
Meteoric Resources NL (MEI)
Retained at overweight at Barrenjoey; Price Target: $0.30
Minerals 260 (MI6)
Initiated at overweight at Barrenjoey; Price Target: $0.30
Mineral Resources (MIN)
Retained at overweight at Barrenjoey; Price Target: $40.00
Metro Mining (MMI)
Retained at buy at Shaw and Partners; Price Target: $0.17
Metcash (MTS)
Retained at neutral at Macquarie; Price Target: $4.00
Nick Scali (NCK)
Retained at outperform at Macquarie; Price Target: $21.90
Newmont Corporation (NEM)
Retained at overweight at Barrenjoey; Price Target: $115.00
Nickel Industries (NIC)
Retained at overweight at Barrenjoey; Price Target: $1.80
Northern Star Resources (NST)
Retained at neutral at Barrenjoey; Price Target: $20.00
Ora Banda Mining (OBM)
Initiated at overweight at Barrenjoey; Price Target: $1.20
Orica (ORI)
Retained at buy at Citi; Price Target: $24.05 from $20.65
Retained at buy at Ord Minnett; Price Target: $23.00
Predictive Discovery (PDI)
Retained at overweight at Barrenjoey; Price Target: $0.45
Paladin Energy (PDN)
Retained at neutral at Barrenjoey; Price Target: $7.45
Pilbara Minerals (PLS)
Retained at underweight at Barrenjoey; Price Target: $1.25
Premier Investments (PMV)
Retained at neutral at Macquarie; Price Target: $21.80
Pepper Money (PPM)
Retained at buy at Citi; Price Target: $2.40
Perpetual (PPT)
Retained at neutral at Citi; Price Target: $20.50
Perseus Mining (PRU)
Retained at neutral at Barrenjoey; Price Target: $3.75
PYC Therapeutics (PYC)
Retained at buy at Bell Potter; Price Target: $2.30
Region Group (RGN)
Upgraded to neutral from underperform at Macquarie; Price Target: $2.32 from $2.21
Rio Tinto (RIO)
Retained at overweight at Barrenjoey; Price Target: $121.00
Resimac Group (RMC)
Retained at neutral at Citi; Price Target: $1.00
Ramelius Resources (RMS)
Retained at overweight at Barrenjoey; Price Target: $3.70
Regis Resources (RRL)
Retained at underweight at Barrenjoey; Price Target: $3.10
Resolute Mining (RSG)
Retained at neutral at Barrenjoey; Price Target: $0.80
Retained at buy at Canaccord Genuity; Price Target: $1.60 from $1.50
South32 (S32)
Retained at overweight at Barrenjoey; Price Target: $3.95
SiteMinder (SDR)
Retained at buy at Citi; Price Target: $8.00 from $6.45
Sandfire Resources (SFR)
Retained at overweight at Barrenjoey; Price Target: $13.00
Sigma Healthcare (SIG)
Retained at underperform at Macquarie; Price Target: $2.50
Santana Minerals (SMI)
Retained at outperform at RBC Capital Markets; Price Target: $0.80
Stanmore Resources (SMR)
Retained at neutral at Barrenjoey; Price Target: $2.20
Super Retail Group (SUL)
Retained at neutral at Macquarie; Price Target: $19.40
Solvar (SVR)
Retained at hold at Bell Potter; Price Target: $1.70 from $1.60
Treasury Wine Estates (TWE)
Retained at neutral at Macquarie; Price Target: $8.00
Universal Store Holdings (UNI)
Retained at outperform at Macquarie; Price Target: $10.20
Vault Minerals (VAU)
Retained at overweight at Barrenjoey; Price Target: $0.68
West African Resources (WAF)
Retained at overweight at Barrenjoey; Price Target: $3.40
Westpac Banking Corporation (WBC)
Retained at underweight at Morgan Stanley; Price Target: $31.60 from $32.10
Wildcat Resources (WC8)
Retained at overweight at Barrenjoey; Price Target: $0.30
Wesfarmers (WES)
Retained at neutral at Macquarie; Price Target: $86.00
Whitehaven Coal (WHC)
Retained at neutral at Barrenjoey; Price Target: $6.50
Woolworths Group (WOW)
Retained at neutral at Macquarie; Price Target: $30.30
Zip Co (ZIP)
Retained at buy at Citi; Price Target: $4.50
Scans
Top Gainers
Code | Company | Last | % Chg |
|---|---|---|---|
| T3D | 333D Ltd | $0.25 | +525.00% |
| JLL | Jindalee Lithium Ltd | $0.56 | +40.00% |
| GUM | Gumtree Australia Markets Ltd | $0.18 | +38.46% |
| AGN | Argenica Therapeutics Ltd | $0.33 | +32.00% |
| OSL | Oncosil Medical Ltd | $1.60 | +29.03% |
Top Fallers
Code | Company | Last | % Chg |
|---|---|---|---|
| MPP | Metro Performance Glass Ltd | $0.03 | -33.33% |
| IFG | Infocus Group Holdings Ltd | $0.021 | -30.00% |
| 4DX | 4DMEDICAL Ltd | $1.675 | -27.49% |
| ZEU | ZEUS Resources Ltd | $0.017 | -19.05% |
| EQS | Equity Story Group Ltd | $0.018 | -18.18% |
52 Week Highs
Code | Company | Last | % Chg |
|---|---|---|---|
| T3D | 333D Ltd | $0.25 | +525.00% |
| JLL | Jindalee Lithium Ltd | $0.56 | +40.00% |
| LEX | Lefroy Exploration Ltd | $0.16 | +23.08% |
| GL1 | Global Lithium Resources Ltd | $0.37 | +18.40% |
| BML | Boab Metals Ltd | $0.245 | +16.67% |
52 Week Lows
Code | Company | Last | % Chg |
|---|---|---|---|
| MPP | Metro Performance Glass Ltd | $0.03 | -33.33% |
| PRO | Prophecy International Holdings Ltd | $0.26 | -13.33% |
| MAY | Melbana Energy Ltd | $0.016 | -11.11% |
| RHT | Resonance Health Ltd | $0.033 | -5.71% |
| SKO | Serko Ltd | $2.20 | -5.58% |
Near Highs
Code | Company | Last | % Chg |
|---|---|---|---|
| WVOL | Ishares MSCI World Ex Aust Minimum Volatility ETF | $44.07 | -0.38% |
| GCI | Gryphon Capital Income Trust | $2.07 | +0.49% |
| VVLU | Vanguard Global Value Equity Active ETF | $77.00 | -0.65% |
| IHD | Ishares S&P/ASX DIV Opportunities Esg Screened ETF | $16.01 | -0.37% |
| HVN | Harvey Norman Holdings Ltd | $7.33 | -0.41% |
Relative Strength Index (RSI) Oversold
Code | Company | Last | % Chg |
|---|---|---|---|
| PEN | Peninsula Energy Ltd | $0.305 | 0.00% |
| PNI | Pinnacle Investment Management Group Ltd | $18.66 | -3.12% |
| NWL | Netwealth Group Ltd | $31.38 | -1.17% |
| RIIF | Resolution GBL Listed Infra Fund - Active ETF | $1.07 | -0.93% |
| EBO | Ebos Group Ltd | $26.88 | -2.54% |
