News | Market Wraps
Evening Wrap: ASX 200 slides on Santos, Woodside Energy carnage, uranium stocks rebound
The S&P/ASX 200 closed 73.3 points lower, down 0.83%.

Mentioned
The S&P/ASX 200 closed 73.3 points lower, down 0.83%.
Banks down, Resources down, Energy down (for a very specific reason, but down nonetheless). The S&P/ASX 200 never stood a chance today...😭 But there's one metric – which no doubt every other Evening Wrap will miss – that suggests it wasn't all that bad on the Australian share market today!
Be sure to click/scroll through for the usual reporting of the major sector and stock-specific moves, the broker responses to them, as well as all the key economic data in tonight's Evening Wrap.
Also, I have detailed technical analysis on the Nasdaq Composite and the S&P/ASX 200 in today's ChartWatch.
Let's dive in!
Today in Review
Thu 18 Sep 25, 4:54pm (AEST)
Name | Value | % Chg |
|---|---|---|
Major Indices | ||
| ASX 200 | 8,745.2 | -0.83% |
| All Ords | 9,030.9 | -0.70% |
| Small Ords | 3,665.0 | +0.49% |
| All Tech | 4,271.7 | +0.40% |
| Emerging Companies | 2,757.0 | +0.68% |
Currency | ||
| AUD/USD | 0.6619 | -0.50% |
US Futures | ||
| S&P 500 | 6,684.75 | +0.39% |
| Dow Jones | 46,470.0 | +0.23% |
| Nasdaq | 24,602.25 | +0.56% |
Name | Value | % Chg |
|---|---|---|
Sector | ||
| Information Technology | 2,979.7 | +0.20% |
| Consumer Discretionary | 4,517.8 | -0.11% |
| Real Estate | 4,134.3 | -0.12% |
| Communication Services | 1,886.4 | -0.18% |
| Materials | 17,603.2 | -0.51% |
| Consumer Staples | 12,003.2 | -0.66% |
| Health Care | 37,610.1 | -0.70% |
| Financials | 9,514.8 | -0.88% |
| Industrials | 8,449.3 | -1.25% |
| Utilities | 9,946.3 | -1.41% |
| Energy | 8,387.6 | -5.90% |
ChartWatch *LIVE* Webinar
ChartWatch *LIVE* Webinars – WEEKLY Wednesday's @ 12pm AEDT
Learn more about technical analysis and trend following through real case studies on ASX stocks. Australia's premier technical analyst, Carl Capolingua, shares his unique insights on stocks as requested by viewers. Ask about a company in your portfolio or anything related to trading and investing and get Carl's expert opinion.
Places are limited so >REGISTER NOW!<
Markets
%20intraday%20chart_18%20Sep.png)
ASX 200 Session Chart
The S&P/ASX 200 (XJO) finished 73.3 points lower at 8,745.2, 0.84% from its session high and just 0.09% from its low. However, in the broader-based S&P/ASX 300 (XKO) advancers managed to beat decliners by a modest 145 to 121.
Oh Old Tin Pot – what a dud of a day you gave us! Outside of the absolute carnage that occurred in the Energy (XEJ) (-5.8%) sector, we were treated to a hotch-potch of bad with just a twist of mediocre 🍹.
Let’s start with the positives, i.e., the mediocre gains in Information Technology (XIJ) (+0.2%), which enjoyed some relief from last night's interest rate decision in the US. Nuix (NXL) (+9.5%), Catapult Sports (CAT) (+2.2%), and Bravura Solutions (BVS) (+1.7%) notables there…
Then there was just one other sector (technically a sub-sector) that scraped into the black, Gold (XGD) (+0.33%)… but from there, everything else was a variation on bad.
Commonwealth Bank of Australia (CBA) (+%) took a decent chunk out of Financials (XFJ) (-0.9%) (but also out of the index), and AMP (AMP) (-2.8%) was also an underperformer.
In Resources (XJR) (-1.4%) the iron ore majors of BHP Group (BHP) (-0.8%), Fortescue (FMG) (-0.7% ), and Rio Tinto (RIO) (-0.7%) weighed on the sector due to a slightly weaker iron ore price in Singapore today, but base metals stocks weren’t much chop either – even as most base metals prices rose on the London Metals Exchange overnight (particularly aluminium, copper, and zinc). In light of this, South32 (S32) (-1.9%) and Sandfire Resources (SFR) (+1.3%) were disappointing.
So, that's kind of "there you have it": Banks down, Resources down, Energy down (for a very specific reason, but down nonetheless). The Old Tin Pot never stood a chance today... but, if I can offer one silver lining today, the market breadth across the ASX 300 was still positive. So, despite the big end of town weighing down the index, in the broader market, gainers narrowly led decliners 🤞.
Back to Energy’s woes, because they were without doubt the standout story of today’s trade. If you’ve missed the biggest news story this month, check out this article I wrote on it. Funnily enough, or not so funnily if you happen to own Woodside Energy (WDS) (-6.3%) it got belted too.
No news for WDS today, and the oil price was neither here nor there overnight – so it wasn’t that either – it just got tarred with the same STO brush. Possibly, XRG’s decision to walk away from its takeover highlights just how hard it would be for an international to swallow either one of our two energy majors – so investors adjusted down any takeover premium previously built into WDS’s price… Or, and this one is more (comically) likely… Investors now feel WDS might reconsider it’s own ambitions for STO. Not that old chestnut again 🤦!
Either way, WDS copped it, but so too did other stocks in the sector like Karoon Energy (KAR) (-3.5%) and Beach Energy (BPT) (-4.5%). Hey, it wasn’t all bad in the XEJ – because in another perverse twist of why the heck is that happening? – uranium stocks staged a solid recovery today. So, that’s Monday 🚀 | Tuesday 💥 | Thursday 🚀. I can’t wait for tomorrow 💥!
Today's best blue chip gainers
Company | Last Price | Change $ | Change % | 1mo % | 1yr % |
|---|---|---|---|---|---|
Hub24 (HUB) | $104.16 | +$2.86 | +2.8% | -0.6% | +82.1% |
Pinnacle Investment Group (PNI) | $18.90 | +$0.5 | +2.7% | -10.0% | +11.9% |
Block (XYZ) | $115.27 | +$2.62 | +2.3% | +0.4% | +21.0% |
Dyno Nobel (DNL) | $2.98 | +$0.06 | +2.1% | -2.0% | -2.0% |
IDP Education (IEL) | $5.56 | +$0.09 | +1.6% | +16.3% | -65.5% |
Lynas Rare Earths (LYC) | $14.61 | +$0.22 | +1.5% | -3.2% | +111.1% |
Life360 (360) | $50.26 | +$0.69 | +1.4% | +14.9% | +196.5% |
Nextdc (NXT) | $17.99 | +$0.24 | +1.4% | +26.7% | +5.8% |
Pro Medicus (PME) | $298.81 | +$3.93 | +1.3% | -2.8% | +84.3% |
Pilbara Minerals (PLS) | $2.29 | +$0.03 | +1.3% | +9.0% | -20.5% |
Bendigo and Adelaide Bank (BEN) | $12.88 | +$0.12 | +0.9% | +1.3% | +6.3% |
Newmont Corporation (NEM) | $118.42 | +$1. | +0.9% | +12.5% | +48.7% |
ALS (ALQ) | $19.63 | +$0.16 | +0.8% | +3.9% | +30.4% |
Vicinity Centres (VCX) | $2.51 | +$0.02 | +0.8% | -3.8% | +7.7% |
Car Group (CAR) | $38.42 | +$0.3 | +0.8% | -6.9% | +4.3% |
AGL Energy (AGL) | $8.70 | +$0.06 | +0.7% | +0.5% | -23.6% |
Technology One (TNE) | $37.52 | +$0.22 | +0.6% | -3.2% | +62.0% |
Endeavour Group (EDV) | $3.67 | +$0.02 | +0.5% | -12.6% | -27.3% |
ASX (ASX) | $60.81 | +$0.26 | +0.4% | -5.1% | -5.0% |
Charter Hall Group (CHC) | $22.96 | +$0.09 | +0.4% | +0.6% | +44.7% |
Today's worst blue chip losers
Company | Last Price | Change $ | Change % | 1mo % | 1yr % |
|---|---|---|---|---|---|
Santos (STO) | $6.74 | -$0.91 | -11.9% | -10.8% | -3.7% |
Woodside Energy (WDS) | $23.06 | -$1.54 | -6.3% | -11.9% | -4.3% |
Washington H Soul Pattinson (SOL) | $39.42 | -$1.88 | -4.6% | -7.3% | +17.8% |
AMP (AMP) | $1.740 | -$0.05 | -2.8% | -1.7% | +31.3% |
James Hardie (JHX) | $28.84 | -$0.79 | -2.7% | -9.9% | -45.8% |
Origin Energy (ORG) | $12.41 | -$0.33 | -2.6% | -3.9% | +29.9% |
The A2 Milk Company (A2M) | $8.75 | -$0.21 | -2.3% | +3.1% | +60.3% |
Transurban Group (TCL) | $14.14 | -$0.33 | -2.3% | -1.1% | +1.8% |
Commonwealth Bank (CBA) | $164.33 | -$3.82 | -2.3% | -4.7% | +14.9% |
Cleanaway Waste (CWY) | $2.74 | -$0.06 | -2.1% | -2.5% | -2.1% |
Worley (WOR) | $13.98 | -$0.29 | -2.0% | +9.6% | -5.0% |
Challenger (CGF) | $8.59 | -$0.17 | -1.9% | +0.7% | +32.8% |
South32 (S32) | $2.58 | -$0.05 | -1.9% | -10.1% | -18.6% |
Telix Pharmaceuticals (TLX) | $13.66 | -$0.26 | -1.9% | -19.3% | -23.3% |
Ramsay Health (RHC) | $32.95 | -$0.62 | -1.8% | -13.3% | -18.3% |
Computershare (CPU) | $36.96 | -$0.63 | -1.7% | -4.6% | +33.3% |
Brambles (BXB) | $24.50 | -$0.4 | -1.6% | +5.5% | +32.1% |
Suncorp Group (SUN) | $20.31 | -$0.31 | -1.5% | -5.0% | +12.9% |
Insurance Australia (IAG) | $8.33 | -$0.12 | -1.4% | -8.5% | +7.5% |
CSL (CSL) | $198.34 | -$2.73 | -1.4% | -10.1% | -33.1% |
ChartWatch
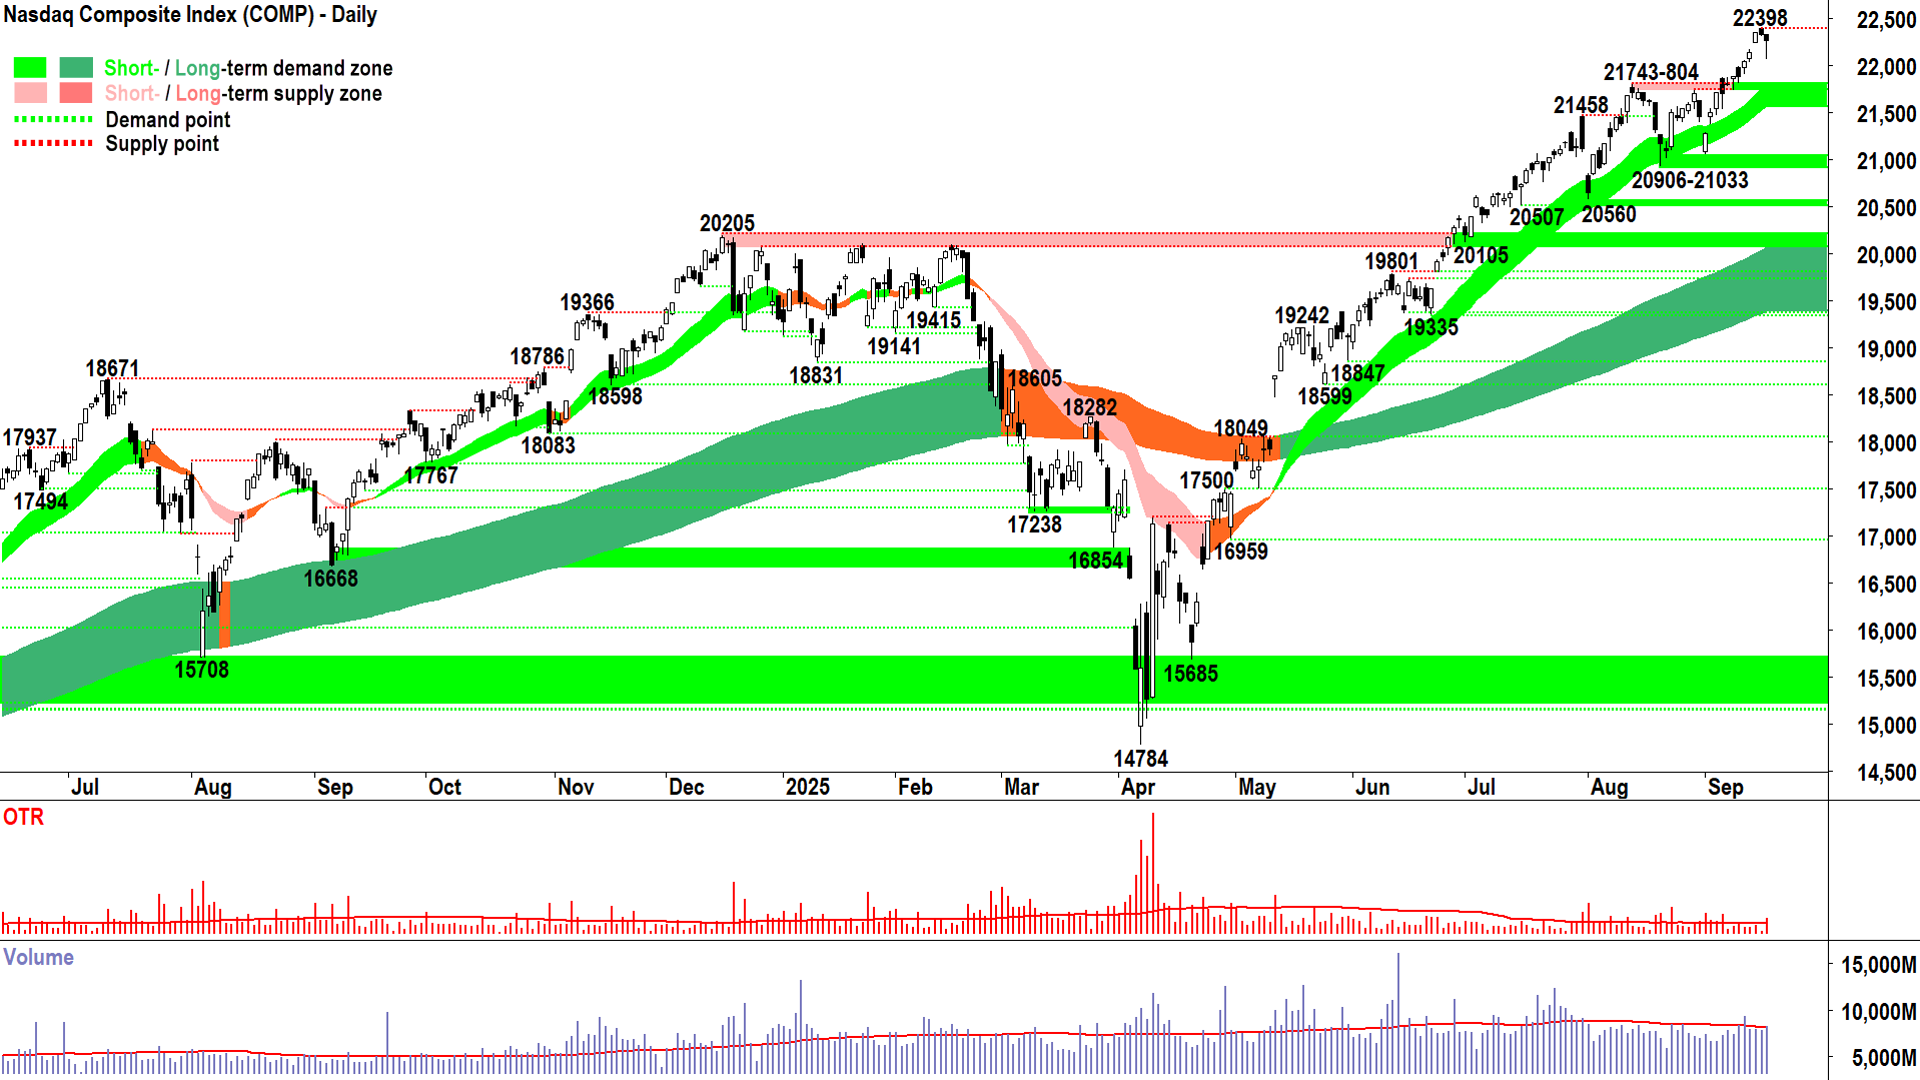
Nasdaq Composite Index

Nasdaq Composite Index chart (click here for full size image)
All that fuss about nothing! 😅
We got our Fed rate cut, and based upon Chairman Powell’s post-meeting presser rhetoric, the committee is give-or-take seeing a couple more cuts in this cycle. The market was gunning for 3 more… so we’re not far off… hey – at least there’s movement at the station! 🚂
So, I suggest last night’s candle is about right – it makes perfect sense. There was some disappointment immediately after the decision (causing that long downward pointing shadow) and then there was a solid rally into the close as investors realised they got the vast majority of what they wanted out of that major risk event.
It wasn’t a “hit the sell button and rest a brick on it because we’re off to the pub” moment. Or “bar” if you’re in New York. It was considered, controlled, and by the end of the candle – dare I say “moot”?
We both know what long downward pointing shadows mean: They mean latent demand in the system waiting to buy the dip.
I wanna say, given Wednesday’s candle and the rest of the technicals considered (ST & LT uptrends, price action and candles demonstrating demand-side control), it’s pretty much business as usual for this bull market.
And as I’ve said many times here before, until I see something really nasty, or at least resembling nasty (i.e., big black candles or candles with long upward pointing shadows, a lower peak and/or a lower trough, a close below the short term uptrend ribbon) – I’m going to stay the course here. No change to my personal risk setting of FRP.
S&P/ASX 200 (XJO)
%20chart_18%20Sep.png)
S&P/ASX 200 chart (click here for full size image)
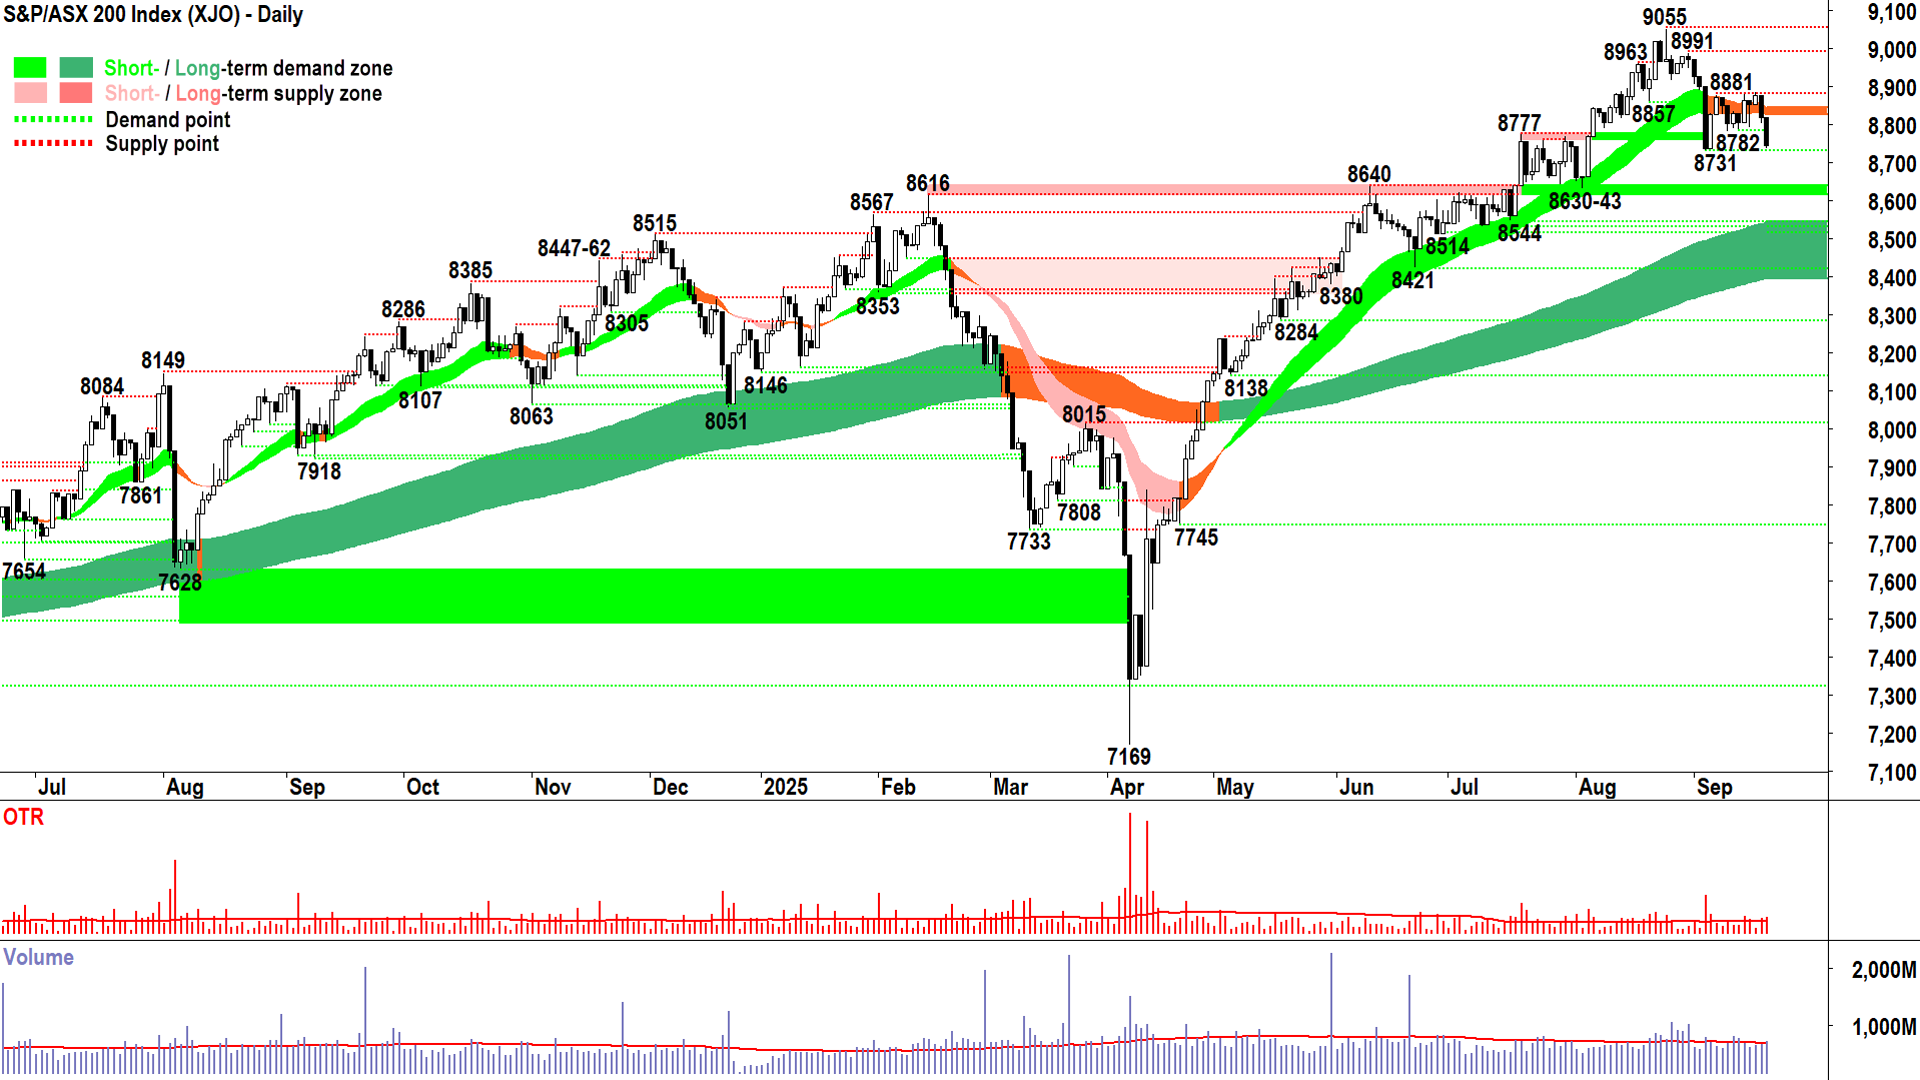
The folks who monitor the [email protected] inbox love me: Reader is asking what's MOTN? What's FRP? What's 2/3RP? What's The Old Tin Pot?
MOTN = More Often Than Not = The trend followers best friend (i.e., work out what's likely to occur MOTN and trade in that direction... Hint: It's usually with the trend!)
FRP = Full Risk Position = My personal way of managing my total portfolio risk. FRP = 100% invested (yep, hay and sunshine etc.). If I see something sinister in the XJO's technicals (i.e., my benchmark index for my ASX capital allocation), then I may reduce the amount of capital I have at risk to say 2/3RP, or 1/2RP, or 1/3RP. You, of course, can do it any which way you want!
The Old Tin Pot / Golden Le Creuset 🍲 = These are just my pet names for the XJO! When it's a limp lettuce leaf, belligerently lagging positive leads from global markets, it's referred to as the Old Tin Pot... you know an irrelevant backwater of few banks, a few resources, Telstra and Wesfarmers... But when it's firing, when it's the world beating hot pot it was back in July and August – then it gets promoted to Golden Le Creuset status 💪! That doesn't happen very often, though, I'm afraid...
Today's XJO analysis? Old... Tin... bloody... Pot 😭. There are some issues here – positive market breadth or not.
Today's candle is disturbing – is should not occur in a healthy, demand-side controlled bull market. 8881 is now looking very solid as a serious point of supply to contend with, and perhaps it marks the critical go-no-go point for this bull to continue.
8731 really needs to hold now, and ideally with one ore more emphatic demand-side candles (i.e., long white-bodied and or long downward pointing shadow with close very near the high of the session).
I feel my move to 2/3RP back on Sep 3 is looking increasingly vindicated and prudent. The next notch will be to 1/2RP if we close below 8731 with a convincing supply-side showing (i.e., long black bodied-candle and or long upward pointing shadow either with close very near the low of the session).
Economy
Today
11:30 AUS Employment Data August
Employment Change: -5,400 m/m vs +21,200 m/m forecast and +24,500 m/m in July
Unemployment Rate: 4.2% as forecast and as in 4.2% July
Insights: A big miss, particularly considering the 41,000 fewer full-time positions (offset by a 36,000 increase part-time). Overall, there was a 0.4% fall in hours worked.
Expert take: My Bui, Economist at AMP said: "As a result, we continue to see the RBA cutting at a quarterly pace in November 2025 as well as February and May 2026, taking the cash rate to 2.85%."
Later this week
Thursday
21:00 UK Bank of England Monetary Official Bank Rate & Monetary Policy Summary
Friday
TBA JPN BOJ Policy Rate, Monetary Policy Statement, Press Conference
Policy Rate: no change to present <0.50% forecast
Latest News
Interesting Movers
Trading higher
+500.0% Stakk (SKK) - Robinhood selects Stakk as vendor for new banking solution, 🤯
+24.4% Felix Gold (FXG) - No news, rise is consistent with prevailing short and long term uptrends, a regular in ChartWatch ASX Scans Uptrends list 🔎📈
+19.2% LTR Pharma (LTP) - No news, rise is consistent with prevailing short term uptrend and long term trend is transitioning from down to up, a recent regular in ChartWatch ASX Scans Uptrends list 🔎📈
+16.7% Silex Systems (SLX) - Continued positive response to 17-Sep GLE Completes Large-Scale Enrichment Demonstration Testing, rise is consistent with prevailing short term uptrend and long term trend is transitioning from down to up 🔎📈
+15.4% Peninsula Energy (PEN) - Becoming a substantial holder (Barrenjoey), general strength across the broader Uranium sector today.
+13.5% Astral Resources (AAR) - Resource Rising Stars Gold Coast Conference Presentation, rise is consistent with prevailing short and long term uptrends, a regular in ChartWatch ASX Scans Uptrends list 🔎📈
+13.5% GBM Resources (GBZ) - No news, rise is consistent with prevailing short and long term uptrends, a regular in ChartWatch ASX Scans Uptrends list 🔎📈
+11.1% Forrestania Resources (FRS) - Forrestania Resources - British Hill Acquisition Completed, rise is consistent with prevailing short and long term uptrends, a regular in ChartWatch ASX Scans Uptrends list 🔎📈
+10.0% Andromeda Metals (ADN) - Annual Report to shareholders, rise is consistent with prevailing short and long term uptrends, a recent regular in ChartWatch ASX Scans Uptrends list 🔎📈
+9.9% Falcon Metals (FAL) - Change in substantial holding (Jupiter Asset Management 8% to 9%), rise is consistent with prevailing short and long term uptrends, a regular in ChartWatch ASX Scans Uptrends list 🔎📈
+9.8% Wildcat Resources (WC8) - No news 🤔.
+9.4% Vertex Minerals (VTX) - Corporate Presentation Mining Forum Americas, rise is consistent with prevailing short and long term uptrends, a recent regular in ChartWatch ASX Scans Uptrends list 🔎📈
+8.3% Alligator Energy (AGE) - No news, general strength across the broader Uranium sector today.
+8.1% Lotus Resources (LOT) - No news, general strength across the broader Uranium sector today.
+7.0% BCI Minerals (BCI) - No news, rise is consistent with prevailing short and long term uptrends, a regular in ChartWatch ASX Scans Uptrends list 🔎📈
+7.0% Catalyst Metals (CYL) - No news, rise is consistent with prevailing short and long term uptrends, a regular in ChartWatch ASX Scans Uptrends list 🔎📈
+6.5% Fleetpartners Group (FPR) - Mitsubishi Motors Corporation Increases Minority Investment.
+6.4% Ballard Mining (BM1) - No news 🤔.
+6.2% Sayona Mining (SYA) - No news 🤔.
+5.9% AIC Mines (A1M) - No news 🤔.
+5.8% Bannerman Energy (BMN) - No news, general strength across the broader Uranium sector today, rise is consistent with prevailing short and long term uptrends, a recent regular in ChartWatch ASX Scans Uptrends list 🔎📈
+5.7% Medallion Metals (MM8) - No news, rise is consistent with prevailing short and long term uptrends, a regular in ChartWatch ASX Scans Uptrends list 🔎📈
Trading lower
-20.2% Sunrise Energy Metals (SRL) - No news, pulled back in the wake of recent sharp rally.
-15.0% Resolution Minerals (RML) - Successful Heavily Supported Placement to Raise $25 Million.
-11.9% Santos (STO) - XRG Consortium Withdraws Indicative Proposal, general weakness across the broader Energy sector today.
-7.8% Locksley Resources (LKY) - No news, pulled back in the wake of recent sharp rally.
-6.3% Woodside Energy Group (WDS) - No news (got tagged by STO takeover falling through), general weakness across the broader Energy sector today.
-5.4% Lakes Blue Energy (LKO) - Wombat-5 Well, Gippsland Basin, Victoria, Drilling Update.
-5.1% 4DMEDICAL (4DX) - No news, pulled back in the wake of recent sharp rally.
Broker Moves
Adore Beauty Group (ABY)
Initiated at hold at Bell Potter; Price Target: $1.25
Audinate Group (AD8)
Downgraded to equal-weight from overweight at Morgan Stanley; Price Target: $5.00 from $11.00
Brazilian Rare Earths (BRE)
Retained at speculative buy at Canaccord Genuity; Price Target: $5.65
Retained at speculative buy at Ord Minnett; Price Target: $6.30
Charter Hall Group (CHC)
Retained at overweight at Morgan Stanley; Price Target: $26.35
Cygnus Metals (CY5)
Retained at speculative buy at Canaccord Genuity; Price Target: $0.30
HUB24 (HUB)
Initiated at buy at Bank of America; Price Target: $124.00
Iluka Resources (ILU)
Retained at neutral at Macquarie; Price Target: $5.80 from $6.30
James Hardie Industries Plc (JHX)
Retained at sector perform at RBC Capital Markets; Price Target: $35.00
Magellan Financial Group (MFG)
Downgraded to underperform from neutral at Macquarie; Price Target: $8.65 from $8.37
Myer Holdings (MYR)
Retained at overweight at Morgan Stanley; Price Target: $1.00 from $1.05
Northern Minerals (NTU)
Downgraded to hold from speculative buy at Ord Minnett; Price Target: $0.04 from $0.04
PYC Therapeutics (PYC)
Downgraded to neutral from speculative buy at E&P; Price Target: $4.80
ResMed Inc. (RMD)
Retained at buy at Ord Minnett; Price Target: $48.80
SiteMinder (SDR)
Retained at buy at Citi; Price Target: $8.00
Retained at buy at Ord Minnett; Price Target: $7.97 from $7.44
SEEK (SEK)
Retained at buy at Citi; Price Target: $31.65
Santos (STO)
Retained at buy at Citi; Price Target: $8.70
Retained at neutral at E&P; Price Target: $8.10
Downgraded to underweight from overweight at Jarden; Price Target: $7.05 from $8.40
Downgraded to trim from accumulate at Morgans; Price Target: $7.20 from $8.65
Sayona Mining (SYA)
Retained at outperform at Macquarie; Price Target: $5.50 from $0.03
Scans
Top Gainers
Code | Company | Last | % Chg |
|---|---|---|---|
| SKK | Stakk Ltd | $0.036 | +500.00% |
| CCE | Carnegie Clean Energy Ltd | $0.19 | +80.95% |
| PUR | Pursuit Minerals Ltd | $0.115 | +33.72% |
| HTG | Harvest Technology Group Ltd | $0.026 | +30.00% |
| TRI | Trivarx Ltd | $0.014 | +27.27% |
Top Fallers
Code | Company | Last | % Chg |
|---|---|---|---|
| IRX | Inhalerx Ltd | $0.028 | -22.22% |
| SRL | Sunrise Energy Metals Ltd | $4.02 | -20.24% |
| IXC | INVEX Therapeutics Ltd | $0.105 | -19.23% |
| COY | Coppermoly Ltd | $0.013 | -18.75% |
| RIM | Rimfire Pacific Mining Ltd | $0.013 | -18.75% |
52 Week Highs
Code | Company | Last | % Chg |
|---|---|---|---|
| SKK | Stakk Ltd | $0.036 | +500.00% |
| CCE | Carnegie Clean Energy Ltd | $0.19 | +80.95% |
| KGD | Kula Gold Ltd | $0.015 | +25.00% |
| FXG | FELIX Gold Ltd | $0.485 | +24.36% |
| NNL | Nordic Resources Ltd | $0.155 | +19.23% |
52 Week Lows
Code | Company | Last | % Chg |
|---|---|---|---|
| HAL | Halo Technologies Holdings Ltd | $0.021 | -8.70% |
| CYG | Coventry Group Ltd | $0.61 | -8.27% |
| KNO | Knosys Ltd | $0.029 | -6.45% |
| OPPT | Magellan Global Opportunities Fund - Active ETF | $1.765 | -5.36% |
| GEN | Genmin Ltd | $0.019 | -5.00% |
Near Highs
Code | Company | Last | % Chg |
|---|---|---|---|
| PCI | Perpetual Credit Income Trust | $1.225 | +0.41% |
| WVOL | Ishares MSCI World Ex Aust Minimum Volatility ETF | $44.07 | +1.26% |
| GCI | Gryphon Capital Income Trust | $2.05 | 0.00% |
| VVLU | Vanguard Global Value Equity Active ETF | $77.14 | +1.26% |
| IHD | Ishares S&P/ASX DIV Opportunities Esg Screened ETF | $16.01 | -0.50% |
Relative Strength Index (RSI) Oversold
Code | Company | Last | % Chg |
|---|---|---|---|
| WDS | Woodside Energy Group Ltd | $23.06 | -6.26% |
| PGC | Paragon Care Ltd | $0.305 | -3.18% |
| EBO | Ebos Group Ltd | $25.39 | -0.82% |
| BWF | Blackwall Ltd | $0.295 | -1.67% |
| BAP | Bapcor Ltd | $3.31 | -0.60% |
