
The ASX 200 fell as surging US bond yields and weaker commodity prices drove investors out of growth and cyclical stocks and into defensives. Gold miners, base metals, uranium and property stocks led losses, while utilities and telcos gained.
Be sure to click/scroll through for the usual reporting of the major sector and stock-specific moves, the broker responses to them, as well as all the key economic data in tonight's Evening Wrap. Also, I have detailed technical analysis on the Nasdaq Composite and the S&P/ASX 200 in today's ChartWatch.
Let’s dive in!
Today in Review
Name | Value | % Chg |
|---|---|---|
Major Indices | ||
| ASX 200 | 9,082.2 | -0.71% |
| All Ords | 9,204.5 | -0.75% |
| Small Ords | 3,231.7 | -1.75% |
| All Tech | 3,046.1 | -0.46% |
| Emerging Companies | 2,791.2 | -1.11% |
Currency | ||
| AUD/USD | 0.6795 | -0.20% |
US Futures | ||
| S&P 500 | 7,609.0 | -0.08% |
| Dow Jones | 52,378.0 | -0.02% |
| Nasdaq | 28,304.25 | -0.28% |
Name | Value | % Chg |
|---|---|---|
Sector | ||
| Utilities | 10,782.4 | +1.28% |
| Communication Services | 1,655.6 | +0.19% |
| Consumer Discretionary | 3,817.1 | +0.02% |
| Industrials | 8,591.3 | -0.35% |
| Consumer Staples | 13,695.7 | -0.37% |
| Financials | 9,837.8 | -0.44% |
| Health Care | 35,315.7 | -0.45% |
| Energy | 10,390.4 | -0.51% |
| Information Technology | 1,822.3 | -0.78% |
| Real Estate | 3,507.3 | -1.34% |
| Materials | 22,911.1 | -1.61% |
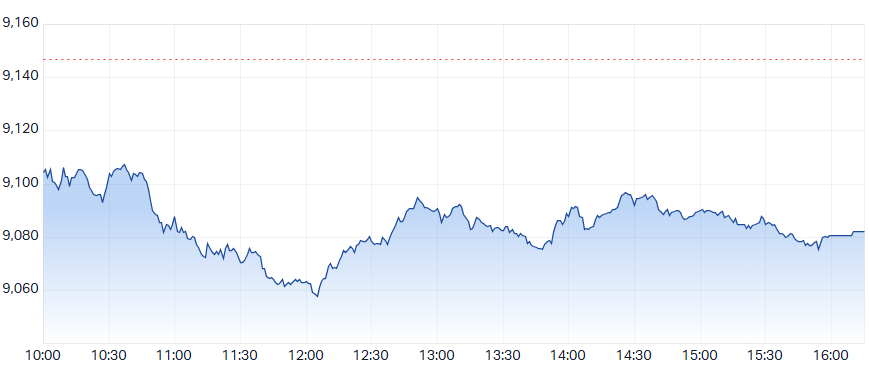
ASX 200 Intraday Chart
Markets
The S&P/ASX 200 (XJO) finished 64.6 points lower at 9,082.2, 0.7% from its session high and 0.3% from its low. Arguably, the performance at benchmark level understated a far poorer performance in the broader-based S&P/ASX 300 (XKO), where advancers lagged decliners by a miserable 47 to 236.
For the week, the XJO finished up 61.4 points or 0.7% higher, 0.9% from its intraweek high and 1.3% from its intraweek low.
Bond yields ⬆️
Commodity prices ⬇️
Just look at that terrible market breadth... it was always going to be a tough day for Aussie stocks... ☹️
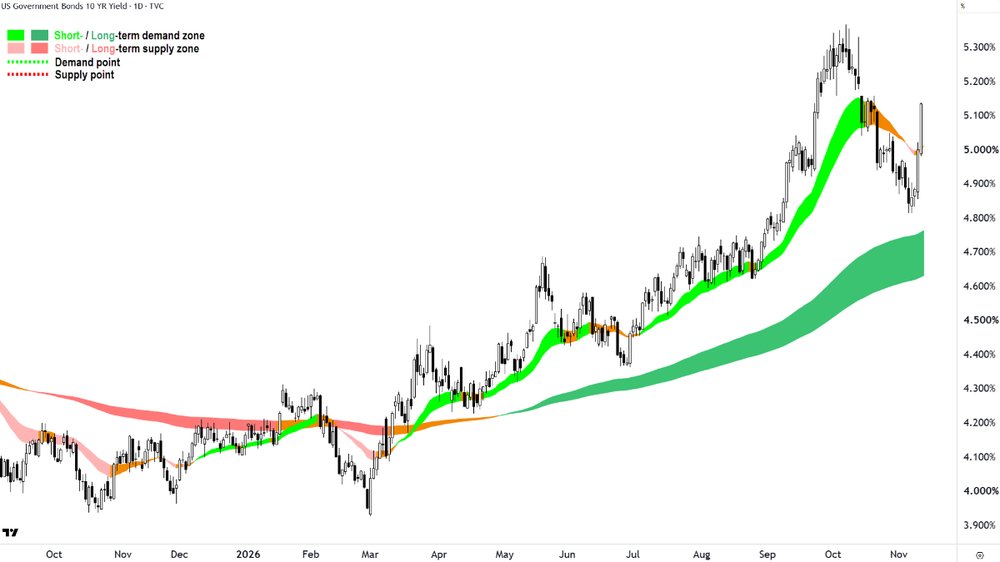
US 10-Year T-Bond Yield chart — 25 basis points in 2 sessions = 😱
The Utilities (XUJ) (+1.3%) sector was the standout as investors rotated into defence amid global uncertainty and a higher oil price. Defensive sectors are those whose earnings hold up regardless of the economic cycle – whatever happens to growth, we’ve still got to keep the lights on! APA Group (APA) (+1.6%) and Origin Energy (ORG) (+1.2%) led the way, with AGL Energy (AGL) (+0.9%) also higher.
The utility-like telcos gained modestly, lifting Communication Services (XTJ) (+0.2%). The cat videos must keep flowing, after all! Telstra Group (TLS) (+0.2%) and TPG Telecom (TPG) (+0.2%) both edged higher.
Consumer Staples (XSJ) (-0.4%) slipped but still beat the broader market. And look what gained – agricultural stocks — because we’ve still got to eat! Graincorp (GNC) (+5.3%) jumped and The A2 Milk Company (A2M) (+1.0%) also rose.
Financials (XFJ) (-0.4%) played their typical anchor role, gaining ground steadily through the session to narrow their loss by the close. The sector then popped in the closing price auction, likely reflecting compulsory flows, such as superannuation guarantee contributions. 🧃 Commonwealth Bank of Australia (CBA) (-0.5%) weighed as the sector’s biggest component, but still closed out the week 2% higher. National Australia Bank (NAB) (+0.2%) edged up and ANZ Group Holdings (ANZ) (0.0%) finished flat.
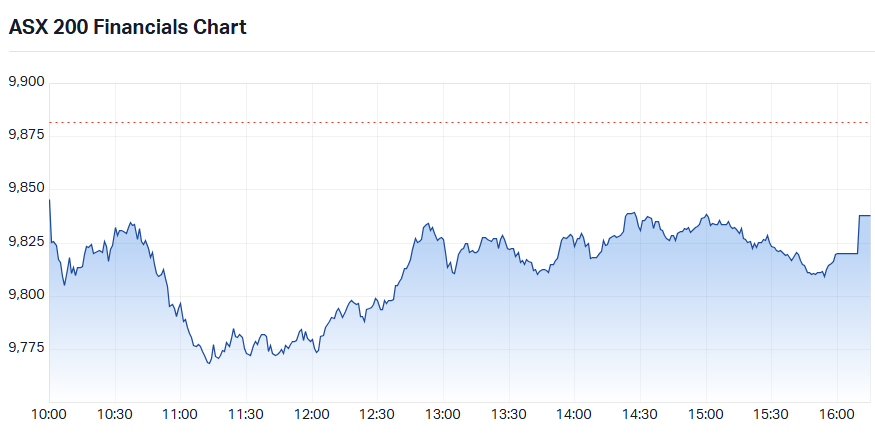
S&P/ASX 200 Financials Sector Index (XFJ) intraday chart
Health Care (XHJ) (-0.5%) also held up better than the broader market — because we’re still going to get sick! Healius (HLS) (+6.5%) and Resmed (RMD) (+1.4%) were solid, but ultimately the sector was weighed by pullbacks in CSL (CSL) (-0.8%) and Cochlear (COH) (-1.1%), both of which have run hard in recent weeks.
The Gold Sub-Index (XGD) (-2.5%) bore the brunt as US bond yields surged again overnight, fallout from hotter-than-expected inflation data that has markets pricing a certain 0.25% Fed rate hike in December.
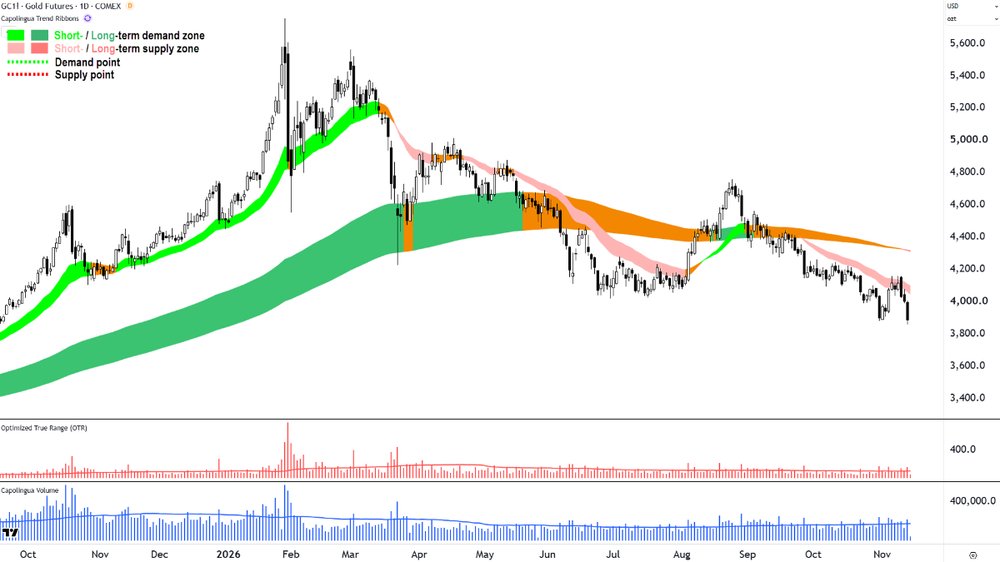
Bond yields up = a nightmare outcome for gold! 😭
Gold pays no yield, so higher bond yields raise the opportunity cost of holding it. COMEX gold futures dropped 2.9% overnight and, despite steadying in Asian trade, up 0.5% to US$3,906/oz, the damage was done. Resolute Mining (RSG) (-4.8%) and Black Cat Syndicate (BC8) (-4.8%) led losses, with Genesis Minerals (GMD) (-4.7%) and Evolution Mining (EVN) (-2.9%) also lower.
Materials (XMJ) (-1.6%) copped the other side of the yield surge. Higher yields crimp global growth expectations, which generally hits commodity prices, and base metals duly slid on the London Metal Exchange overnight, with aluminium down 2.1%, tin 1.2% and zinc 0.9%. BHP Group (BHP) (-1.3%) dragged the broader market lower, while South32 (S32) (-2.0%) also fell. Tin producer Metals X (MLX) (-4.1%) and Nickel Industries (NIC) (-3.0%) also retreated.
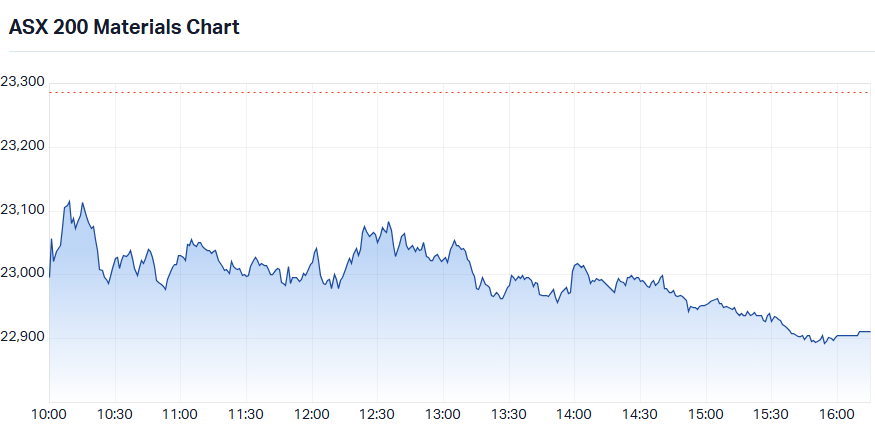
S&P/ASX 200 Materials Sector Index (XMJ) intraday chart
Copper stocks, which often trade as an AI proxy given the metal’s use in electronics, were also hit. Copper fell 1.2% on the LME, while COMEX copper futures – Dr Copper, so called for its knack of diagnosing the health of the global economy – fell 1.5% overnight and kept ebbing in Asian trade, down 0.4% to US$6.17/lb. Sandfire Resources (SFR) (-3.9%) fell, while Capstone Copper (CSC) (-5.4%) was hit harder after downgrading production guidance on maintenance delays and Chilean industrial action.
Lithium stocks were softer despite benchmark GFEX lithium carbonate futures extending their rebound into a second day, up 3.0% to CNY 91,780/t in Asian trade. Core Lithium (CXO) (-3.9%) and Elevra Lithium (ELV) (-1.1%) fell, though PLS Group (PLS) (+0.4%) notched a small gain.
Uranium stocks tracked their benchmark, the Sprott Uranium Miners ETF (URNM), which tumbled 5% overnight in New York, even as COMEX uranium futures edged 0.2% higher to US$90.70/lb in Asian trade. Paladin Energy (PDN) (-17.6%) fared worst after completing a $525 million equity raising. Deep Yellow (DYL) (-4.9%) and Boss Energy (BOE) (-4.7%) also fell, along with Bannerman Energy (BMN) (-3.4%). Enrichment technology play Silex Systems (SLX) (-5.2%) was caught in the sell-off too.
The A-REIT (XPJ) (-1.3%) sector was the other area to substantially falter. Real estate stocks are bond proxies, prized for steady, bond-like income, so they lose appeal when yields rise. Lendlease Group (LLC) (-8.4%) dived after the developer announced it had started a bond redemption process. Data centre developer Goodman Group (GMG) (-2.0%) and GPT Group (GPT) (-2.3%) also fell, while Charter Hall Group (CHC) (-1.3%) slipped after its remuneration report received a first strike at its annual general meeting.
Today's best ASX Top 300 gainers
Company | Last Price | Change $ | Change % | 1mo % | 1yr % |
|---|---|---|---|---|---|
| Graincorp (GNC) | $7.37 | +$0.37 | +5.3% | +10.0% | -7.6% |
| Latitude Group Holdings (LFS) | $0.865 | +$0.035 | +4.2% | +8.1% | -23.1% |
| WAM Capital (WAM) | $1.02 | +$0.03 | +3.0% | +1.5% | -42.9% |
| BCI Minerals (BCI) | $0.56 | +$0.015 | +2.8% | -0.9% | +49.3% |
| Summerset Group Holdings (SNZ) | $5.35 | +$0.14 | +2.7% | -2.7% | -49.7% |
| Xero (XRO) | $76.93 | +$1.76 | +2.3% | +25.1% | -39.6% |
| Computershare (CPU) | $44.73 | +$0.92 | +2.1% | +11.6% | +24.4% |
| Aristocrat Leisure (ALL) | $66.34 | +$1.32 | +2.0% | +8.5% | +11.3% |
| APA Group (APA) | $11.33 | +$0.18 | +1.6% | +2.6% | +21.2% |
| Plato Income Maximiser (PL8) | $1.40 | +$0.02 | +1.4% | -0.4% | -1.8% |
| ResMed Inc. (RMD) | $34.96 | +$0.49 | +1.4% | +6.1% | -9.4% |
| Mader Group (MAD) | $5.83 | +$0.08 | +1.4% | -7.8% | -33.7% |
| Origin Energy (ORG) | $12.28 | +$0.14 | +1.2% | +9.3% | +1.2% |
| Pepper Money (PPM) | $1.805 | +$0.02 | +1.1% | +4.6% | -24.5% |
| Viva Energy Group (VEA) | $2.75 | +$0.03 | +1.1% | -13.5% | +46.3% |
| Zimplats Holdings (ZIM) | $13.89 | +$0.14 | +1.0% | -1.6% | -27.4% |
| The a2 Milk Company (A2M) | $7.26 | +$0.07 | +1.0% | +9.8% | -22.8% |
| Pantoro Gold (PNR) | $3.20 | +$0.03 | +0.9% | +6.3% | -38.5% |
| Technology One (TNE) | $32.45 | +$0.29 | +0.9% | +4.3% | -6.5% |
| AGL Energy (AGL) | $9.08 | +$0.08 | +0.9% | +6.2% | -1.4% |
Today's worst ASX Top 300 losers
Company | Last Price | Change $ | Change % | 1mo % | 1yr % |
|---|---|---|---|---|---|
| Paladin Energy (PDN) | $7.17 | -$1.53 | -17.6% | -15.0% | -11.6% |
| Regal Partners (RPL) | $1.98 | -$0.23 | -10.4% | -9.2% | -29.8% |
| LendLease Group (LLC) | $2.28 | -$0.21 | -8.4% | -8.1% | -57.9% |
| McMillan Shakespeare (MMS) | $17.26 | -$1.56 | -8.3% | -6.2% | +7.6% |
| Meridian Energy (MEZ) | $4.42 | -$0.28 | -6.0% | -1.6% | -12.1% |
| The Star Entertainment Group (SGR) | $0.165 | -$0.01 | -5.7% | +32.0% | +91.9% |
| Smartgroup Corporation (SIQ) | $10.73 | -$0.65 | -5.7% | -5.8% | +28.5% |
| Capstone Copper Corp. (CSC) | $10.97 | -$0.63 | -5.4% | -21.1% | -20.1% |
| Silex Systems (SLX) | $3.08 | -$0.17 | -5.2% | -23.8% | -66.7% |
| DroneShield (DRO) | $1.18 | -$0.065 | -5.2% | -22.9% | -47.6% |
| EQ Resources (EQR) | $0.275 | -$0.015 | -5.2% | -8.3% | +439.2% |
| Electro Optic Systems Holdings (EOS) | $7.34 | -$0.39 | -5.0% | -24.6% | +54.5% |
| Resolute Mining (RSG) | $1.195 | -$0.06 | -4.8% | +4.4% | +17.2% |
| Genesis Minerals (GMD) | $7.05 | -$0.35 | -4.7% | -5.0% | +11.2% |
| Austal (ASB) | $4.28 | -$0.20 | -4.5% | +12.3% | -35.1% |
| Wagners Holding Company (WGN) | $4.53 | -$0.21 | -4.4% | -1.1% | +35.2% |
| Brightstar Resources (BTR) | $0.655 | -$0.03 | -4.4% | -3.0% | +37.9% |
| PYC Therapeutics (PYC) | $1.835 | -$0.08 | -4.2% | -23.2% | +42.3% |
| Metals X (MLX) | $1.62 | -$0.07 | -4.1% | -20.2% | +82.0% |
| Macmahon Holdings (MAH) | $0.93 | -$0.04 | -4.1% | -19.8% | +73.8% |
Chartwatch
Nasdaq Composite Index
Nasdaq Composite Index chart
Analysis
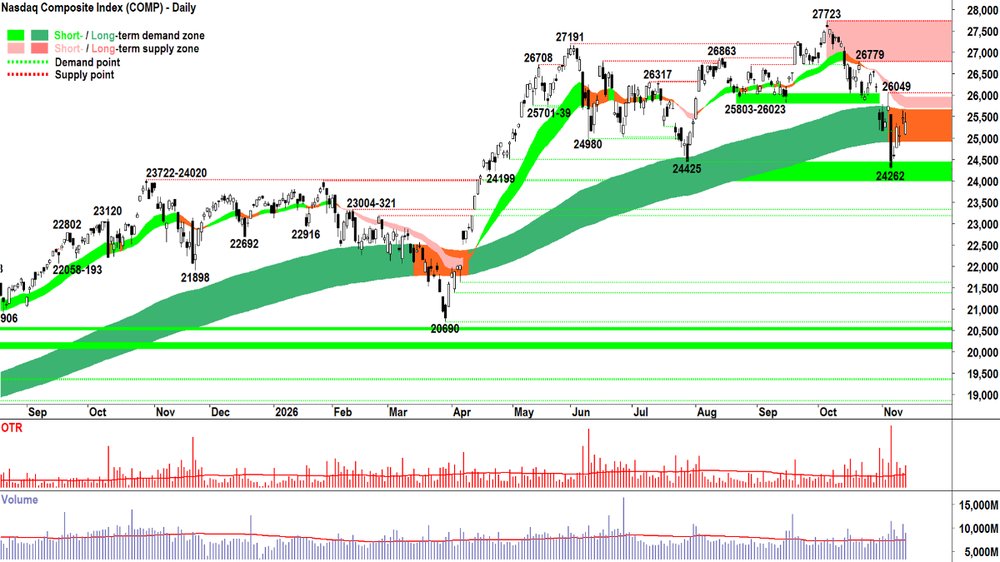
The last 3 candles we've had: down but not convincing, up but not convincing, and down but not convincing.
For example, that last one... close-to-open gap down as the supply side took control on the open... but then look at that white body = BTD!
It's symptomatic of a market that doesn't know where it wants to go, that is full of investors who have very different views of where prices are going to be in the short term... and judging by the long term trend ribbon — they're growing increasingly uncertain about the long term, also.
As trend followers, this is the worst possible market for us, i.e., a total lack of consensus. It creates choppy, volatile conditions that are far from conducive to confidently determining the state of D vs S = P. ⚠️🪓
We love consensus. 🤗
Demand thinks prices are going to be higher both in the short and long term = They're BTD and FOMO'ing in ✅✅
Supply agrees with them = They're HOFU ✅
I'm quite certain we're not there. The analysis of the trends, price action, candles, volatility and volume does not support it. Therefore I Accept that MOTN the P is just as likely to ⬆️, ⬇️, or ➡️.
View
Which makes my Act straightforward. I'm at 1/3RP on US stocks (RP = Risk Position – it reflects my personal allowable capital allocation limit for my investments in US stocks. So 1/2RP is 50%, 2/3RP is 67% and FRP is 100%).
Key Levels
The long term trend ribbon is the closest (dynamic) zone of supply (presently 24919-25675) but the short term trend ribbon (presently 25708-25958) is likely the critical go-no-go for the current short term downtrend. There appears to be a substantial zone of potential latent demand between 23722-24425.
S&P/ASX 200 (XJO)
S&P/ASX 200 (XJO) chart
Analysis
Bond market blues... ☹️
Commodity prices weak... ☹️
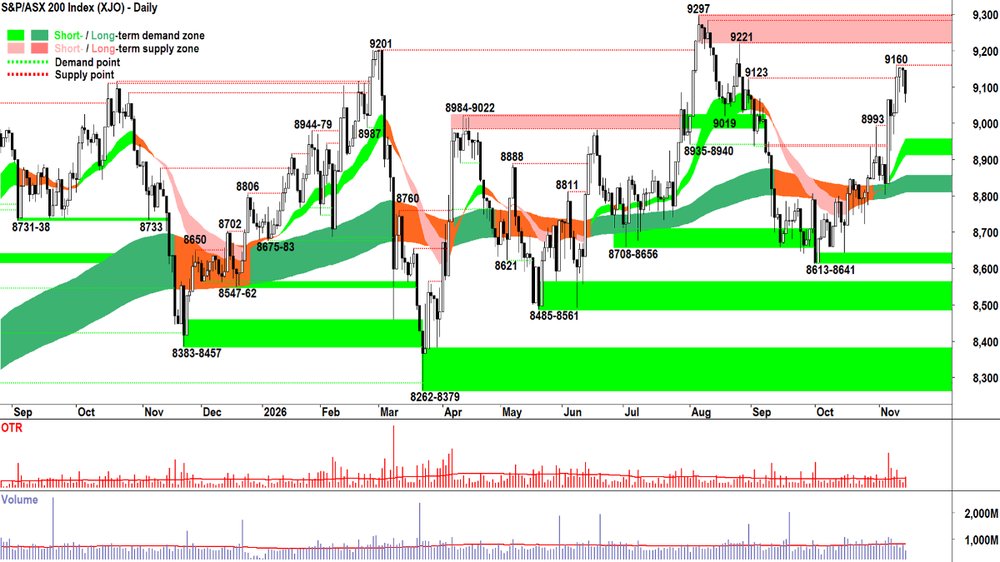
It was always going to be a BIG ASK for the OTP to come back from a lower open today. The reliability of it to draw in BTD support and close near its session-high — demonstrated over several weeks now — simply wasn't there today.
To be fair though, there was a bit of an attempt to rally mid-session, and it is Friday...
Excuses aside, we must still call a spade a spade — or a black candle a black candle, as it is in this case! But consider that today's candle is modest within the context of the demand side showing from 8613-8641 that preceded it.
It has our attention, but not our alarm. Because the checklist hasn't changed here:
Trends: ST/LT Trend ⬆️/⬆️ ✅
Price action: Rising peaks & rising troughs (BTD, FOMO, HOFU) ✅
Candles: Predominantly demand side in nature (white bodies and or downward pointing shadows) ✅
Volatility: Low downside vs high upside ✅
Volume: Above average on recent demand side bars suggests supply removal ✅
✅✅✅✅✅ = MOTN P⬆️
Clearly, we don't want the black candles (nor upward pointing shadows) to grow in either their number nor their size — for that would imply greater supply side control / lesser demand side control. So we must watch them closely. 🧐
The short term trend ribbon will also be critical going forward. As long as it continues to act as a zone of dynamic demand, then we can be confident the demand side has the goods to prevail. Until then, steady as she goes. 🐛
View
I am at 2/3RP on Australian shares (i.e., 67% invested vs 33% cash, with some of the invested portion allocated to shorts). Happy to use the full risk allocation if I can find suitable setups.
Key Levels
9221-9297 is the closest zone of supply. The short term trend ribbon is the closest zone of (dynamic) demand (presently 8901-8943).
(Glossary of acronyms! Old Tin Pot (OTP): S&P/ASX 200 | MOTN: More Often Than Not | FOMO: Fear Of Missing Out | HOFU: Holding On For Upside | BTD: Buy The Dip | NUTE: No Urgency To Enter | FOHO: Fear Of Holding On | STR: Sell The Rally | RP: Risk Position | FFS: Fund Flow Shenanigans!)
***CHARTWATCH LIVE — BUY STOCKS NOW OR SELL THE RALLY? 📺***
ChartWatch LIVE Webinars – WEEKLY Wednesday's @ 12pm AEDT
Learn more about technical analysis and trend following through real case studies on ASX stocks. Australia's premier technical analyst, Carl Capolingua, shares his unique insights on stocks as requested by viewers. Ask about a company in your portfolio or anything related to trading and investing and get Carl's expert opinion.
Places are limited so >REGISTER NOW!<
Economy
TODAY
There weren't any major economic news announcements in our time zone today.
LATER THIS WEEK
SATURDAY
00:30 USA October Core PPI (+0.3% m/m forecast vs +0.7% m/m in September)
Interesting Movers
Trading higher
- Big River Industries (BRI) $1.56+40.5%
Announced that it is being fully acquired by CTL Australia for $1.62 per share in cash. CTL already owned 59.5%. The BRI board unanimously approved the offer.
- Healius (HLS) $0.58+6.5%
No news today. HLS has recently been added to the ChartWatch ASX Scans Uptrends List. 📈
- Graincorp (GNC) $7.37+5.3%
No news today. Continued positive response to yesterday's FY 26 results. XRO has recently been added to the ChartWatch ASX Scans Uptrends List. 📈
- PLS Group (PLS) $2.91+2.1%
ASX filing today disclosing that director Robert Nicholson purchased 40,000 shares on market on 6 November for $108,400.
- Xero (XRO) $76.68+2.0%
No news today. Continued positive response to yesterday's well received trading update. XRO has recently been added to the ChartWatch ASX Scans Uptrends List. 📈
Trading Lower
- Paladin Energy (PDN) $7.17-17.6%
Announced the successful completion of its fully underwritten A$525 million equity raising at A$7.80 (to raise ~A$499 million) and C$7.62 (to raise ~A$26 million).
- Smart Parking (SPZ) $0.68-13.9%
Issued a trading update at its AGM held today. Management said first quarter performance was 'in line' with expectations and reaffirmed FY27 guidance provided in August.
- Clarity Pharmaceuticals (CU6) $1.82-11.5%
No news today. Pulling back hard after rising 23.5% yesterday following the announcement that its Cu-64 SAR-bisPSMA therapy had been granted Breakthrough Therapy designation in PSMA PET imaging by the US FDA.
- Regal Partners (RPL) $1.98-10.4%
No news today. Continued negative response to yesterday's trading update and fund performance fee review. RPL is a regular in the ChartWatch ASX Scans Downtrends List. 📉
- LendLease Group (LLC) $2.28-8.4%
Announced it has commenced a process to redeem ~$1.22 billion of outstanding bonds. LLC is a regular in the ChartWatch ASX Scans Downtrends List. 📉
- Weebit Nano (WBT) $2.35-7.8%
No news. WBT is a regular in the ChartWatch ASX Scans Downtrends List. 📉
- Artrya (AYA) $3.19-7.3%
Announced a five-year commercial agreement with US-based HonorHealth. Minimum contracted value US$500,000. Management said the deal was the company's first 'inbound customer' secured outside its foundation customers. Also held its AGM today. AYA is a regular in the ChartWatch ASX Scans Downtrends List. 📉
- Capstone Copper Corp. (CSC) $11.06-4.7%
Provided an operations update. Management cut the bottom end of 2026 copper production guidance from 200,000 tonnes to 195,000 tonnes, blaming maintenance delays impacting the Pinto Valley primary crusher restart. Now expecting mid-December full restart with temporary mobile crushers allowing a partial restart up to 40,000 tonnes per day in mid-November. Labour strikes in Chile also creating risks to shipments. Mantoverde and Mantos Blancos operations remain unaffected so far.
- Actinogen Medical (ACW) $0.05-4.3%
Filed a request for a trading halt with the ASX to allow review of clinical trial results for the XanaMIA phase 2b/3 trial. Halt required until the earlier of the release of a material announcement or no later than 10.00 am AEDT on 17 November.
- SGH (SGH) $42.26-2.7%
Provided details on CFO succession at the company's AGM held today. Boral CFO Stefan Camphausen named next group CFO, replacing Richard Richards after more than 13 years. Camphausen starts 1 December 2026, with Richards staying on to help Ryan Stokes reshape SGH’s portfolio.
Broker Moves
Company | Broker | Action | Rating | Price Target |
|---|---|---|---|---|
ALDAmpol | Citi | Initiated | Buy | $41.00 |
ALLAristocrat Leisure | Citi | Retained | Buy | $74.00(from $61.00) |
| Macquarie | Retained | Outperform | $71.00(from $67.00) | |
AUBAUB Group | Macquarie | Retained | Outperform | $35.05(from $35.14) |
BHMBroken Hill Mines | Petra Capital | Retained | Buy | $1.48 |
BRGBreville Group | Macquarie | Retained | Outperform | $36.90(from $37.10) |
CPUComputershare | Citi | Retained | Neutral | $44.80(from $43.20) |
| Macquarie | Retained | Neutral | $38.00 | |
EVNEvolution Mining | Macquarie | Retained | Neutral | $13.20(from $12.94) |
GNCGraincorp | Macquarie | Upgraded | Outperform(from Neutral) | $7.70(from $6.75) |
GYGGuzman Y Gomez | Citi | Retained | Neutral | $27.25 |
INGInghams Group | Macquarie | Retained | Underperform | $2.00(from $1.90) |
OD6OD6 Metals | Petra Capital | Retained | Buy | $0.24 |
ORIOrica | Citi | Retained | Buy | $26.95(from $25.40) |
| Macquarie | Retained | Outperform | $26.60(from $26.10) | |
QALQualitas | Citi | Retained | Buy | $4.30 |
TLSTelstra Group | Citi | Retained | Buy | $5.25 |
VEAViva Energy Group | Citi | Initiated | Buy | $3.10 |
XROXero | Citi | Retained | Buy | $95.40(from $91.55) |
| Macquarie | Retained | Outperform | $161.80(from $158.50) |
Scans
Top Gainers
Code | Company | Last | % Chg |
|---|---|---|---|
| BRI | Big River Industries Ltd | $1.56 | +40.54% |
| AXI | Axtec Ltd | $0.015 | +25.00% |
| VAN | Vantage Metals Ltd | $0.026 | +23.81% |
| FGH | Foresta Group Holdings Ltd | $0.012 | +20.00% |
| CYV | Ceryvyn Therapeutics Ltd | $0.011 | +15.79% |
Top Fallers
Code | Company | Last | % Chg |
|---|---|---|---|
| T88 | Taiton Resources Ltd | $0.038 | -22.45% |
| PDN | Paladin Energy Ltd | $7.17 | -17.59% |
| DAL | Dalaroo Metals Ltd | $0.10 | -16.67% |
| GBM | GBM Resources Ltd | $0.016 | -15.79% |
| WLC | Whiterock Lithium Corp | $2.30 | -14.82% |
52 Week Highs
Code | Company | Last | % Chg |
|---|---|---|---|
| BRI | Big River Industries Ltd | $1.56 | +40.54% |
| SKT | Sky Network Television Ltd | $3.30 | +10.00% |
| HYTDC | Hyterra Ltd | $0.07 | +7.69% |
| GRS | Gwardar Resources Ltd | $0.72 | +7.46% |
| EMB | Embelton Ltd | $13.47 | +4.58% |
52 Week Lows
Code | Company | Last | % Chg |
|---|---|---|---|
| PXX | Polarx Ltd | $0.013 | -13.33% |
| TER | Terracom Ltd | $0.022 | -12.00% |
| GRE | Greentech Metals Ltd | $0.025 | -10.71% |
| DLY | Daly Resources Ltd | $0.095 | -9.52% |
| EPX | EPX Ltd | $0.145 | -9.38% |
Near Highs
Code | Company | Last | % Chg |
|---|---|---|---|
| RHC | Ramsay Health Care Ltd | $55.03 | -0.70% |
| OZBD | Betashares Australian Composite Bond ETF | $43.16 | -0.58% |
| AN3PI | Australia and New Zealand Banking Group Ltd | $102.65 | 0.00% |
| PCI | Perpetual Credit Income Trust | $1.085 | 0.00% |
| WVOL | iShares MSCI World Ex Aust Minimum Volatility ETF | $49.25 | +0.22% |
Relative Strength Index (RSI) Oversold
Code | Company | Last | % Chg |
|---|---|---|---|
| WHI | Whitefield Income Ltd | $1.15 | -1.29% |
| BTXX | Digitalx Bitcoin ETF | $21.82 | -7.39% |
| GQG | GQG Partners Inc | $0.705 | -0.70% |
| SCP | Scalare Partners Holdings Ltd | $3.40 | -10.53% |
| SPL | Starpharma Holdings Ltd | $0.425 | 0.00% |