
The ASX 200 fell as Wall Street’s AI unwind and stubbornly high bond yields kept investors firmly risk-off. Gold miners and tech stocks bore the brunt, while energy and utilities were the only sectors to finish higher.
Be sure to click/scroll through for the usual reporting of the major sector and stock-specific moves, the broker responses to them, as well as all the key economic data in tonight's Evening Wrap. Also, I have detailed technical analysis on the Nasdaq Composite and the S&P/ASX 200 in today's ChartWatch.
Let’s dive in!
Today in Review
Name | Value | % Chg |
|---|---|---|
Major Indices | ||
| ASX 200 | 8,821.8 | -0.69% |
| All Ords | 8,932.4 | -0.72% |
| Small Ords | 3,097.4 | -1.48% |
| All Tech | 2,978.0 | -1.73% |
| Emerging Companies | 2,716.7 | -0.64% |
Currency | ||
| AUD/USD | 0.6721 | -0.20% |
US Futures | ||
| S&P 500 | 7,375.25 | +0.22% |
| Dow Jones | 50,854.0 | +0.08% |
| Nasdaq | 27,219.5 | +0.53% |
Name | Value | % Chg |
|---|---|---|
Sector | ||
| Energy | 10,208.0 | +0.46% |
| Utilities | 10,973.0 | +0.12% |
| Communication Services | 1,641.8 | -0.16% |
| Health Care | 34,897.0 | -0.36% |
| Industrials | 8,525.1 | -0.37% |
| Consumer Staples | 13,650.1 | -0.42% |
| Real Estate | 3,480.9 | -0.61% |
| Financials | 9,645.5 | -0.66% |
| Consumer Discretionary | 3,704.4 | -1.05% |
| Materials | 21,315.5 | -1.08% |
| Information Technology | 1,793.7 | -2.31% |
ASX 200 Intraday Chart
Markets
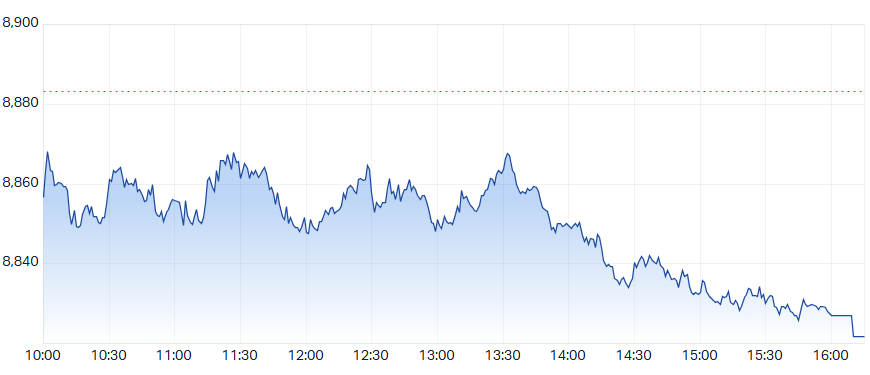
The S&P/ASX 200 (XJO) finished 61.4 points lower at 8,821.8, 0.7% from its session high and smack–bang at the session's low. The move was broad based, too, given that in the broader-based S&P/ASX 300 (XKO) advancers lagged decliners by a miserable 57 to 222.
S&P/ASX 200 Energy (XEJ) (+0.5%) was the odd one out on a defensive day, with coal producers riding higher coal prices. globalCoal Newcastle coal futures rose 1.3% to US$145.95/t in Asian trade, while SGX Australian premium coking coal futures edged up 0.2% to US$252.50/t. Whitehaven Coal (WHC) (+2.8%) and Yancoal Australia (YAL) (+2.0%) led the charge.
Oil and gas giant Woodside Energy Group (WDS) (+1.2%) tracked an overnight 0.8% gain in ICE Brent crude futures, though Brent gave back 0.9% to US$92.31/bbl in Asian trade. Uranium stocks rebounded after days of heavy selling, with Boss Energy (BOE) (+2.6%) higher.
Otherwise, it was a defensive roll-call, though S&P/ASX 200 Utilities (XUJ) (+0.1%) was the only one of the bunch to eke out a gain. Contact Energy (CEN) (+1.3%) and Genesis Energy (GNE) (+1.0%) led, while Origin Energy (ORG) (+0.4%) also edged higher. (Note the closing price auction pop... indeed in all of the defensive plays! 🧃)
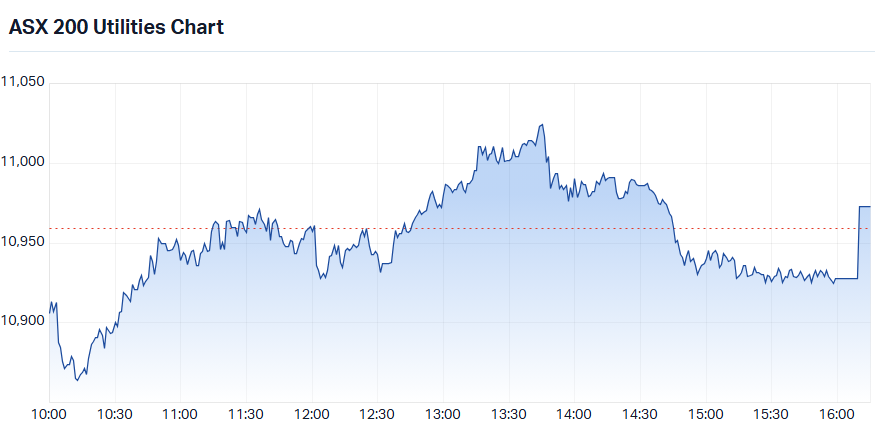
S&P/ASX 200 Utilities Sector Index (XUJ) intraday chart
S&P/ASX 200 Communication Services (XTJ) (-0.2%) slipped but comfortably outperformed the benchmark. Telstra Group (TLS) (+0.2%) and TPG Telecom (TPG) (+0.2%) edged higher, while Chorus (CNU) (+0.3%) also gained.
S&P/ASX 200 Health Care (XHJ) (-0.4%) also held up better than the broader market. Avita Medical (AVH) (+4.9%) jumped, while Cochlear (COH) (+0.4%) edged higher.
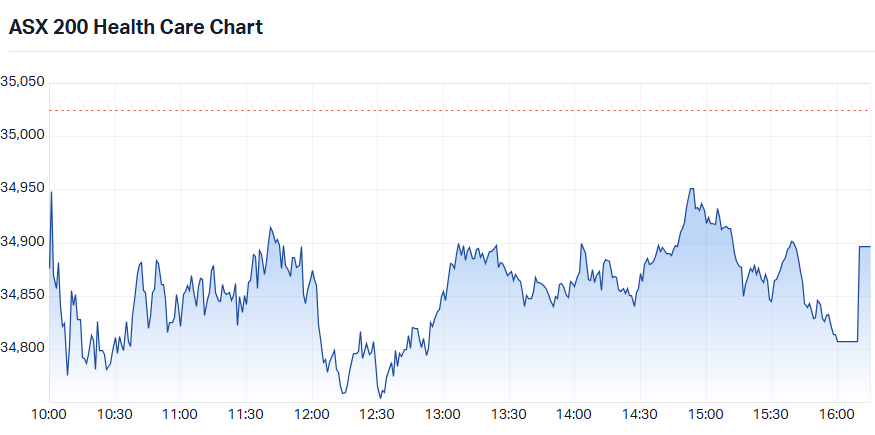
S&P/ASX 200 Health Care Sector Index (XHJ) intraday chart
S&P/ASX 200 Consumer Staples (XSJ) (-0.4%) rounded out the defensive cohort. Elders (ELD) (+0.6%) gained and Metcash (MTS) (0.0%) was flat, while supermarket majors Woolworths Group (WOW) (-0.1%) and Coles Group (COL) (-0.5%) slipped.
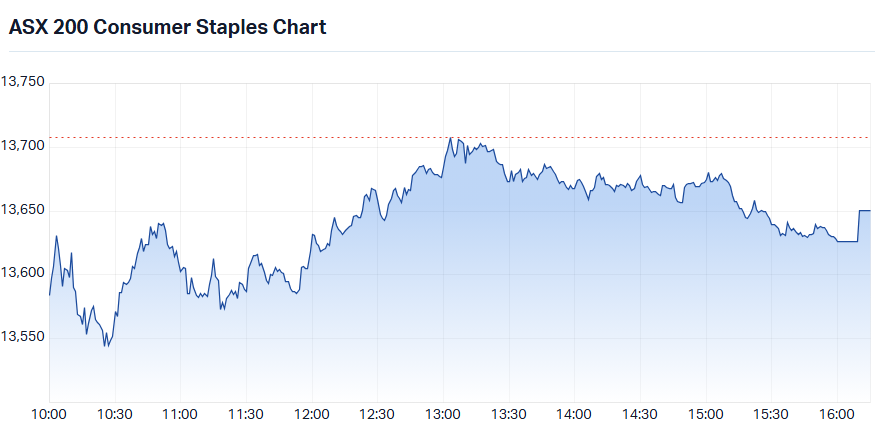
S&P/ASX 200 Consumer Staples Sector Index (XSJ) intraday chart
The Gold Sub-Index (XGD) (-2.8%) was the day’s worst performer as miners followed sharply lower precious metals prices. COMEX gold futures fell 2.2% to US$3,780/oz in Asian trade, while COMEX silver futures slid 2.9% to US$45.98/oz. Ora Banda Mining (OBM) (-9.7%) and Evolution Mining (EVN) (-5.3%) led the losses. Catalyst Metals (CYL) (-4.3%) and Resolute Mining (RSG) (-4.3%) were also hit hard.
S&P/ASX 200 Materials (XMJ) (-1.1%) started the day stronger, but that was simply an invitation for the big funds who’ve been bashing the sector for weeks to sell the rally. It closed on its intraday low as gold miners tumbled and COMEX copper futures spiked 2.4% lower to US$5.834/lb in Asian trade.
The lack of a broader commodities bounce was telling, the whole affair smelling like a classic dead cat bounce: a brief rebound that quickly fizzles. Rio Tinto (RIO) (-1.7%) fell, while BHP Group (BHP) (-0.1%) was a standout, if only because it was largely flat.
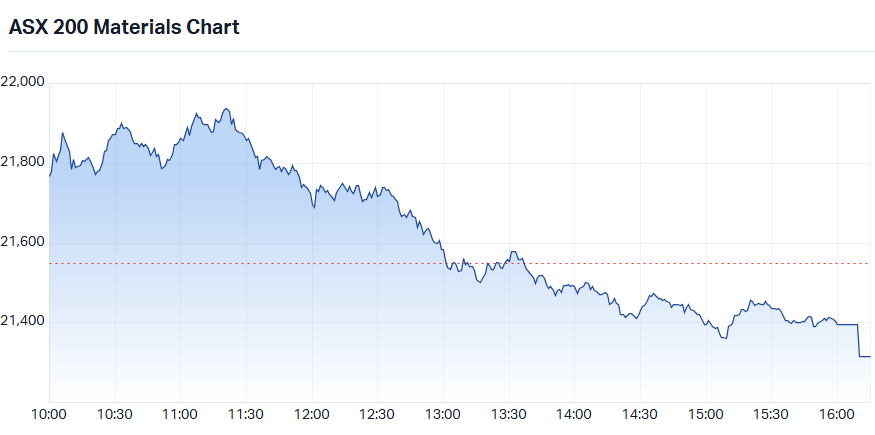
S&P/ASX 200 Materials Sector Index (XMJ) intraday chart (one way traffic from the open!!! STR!!! 📉)
A higher iron ore price didn’t help local producers, with SGX iron ore futures up 0.6% to US$87.65/t in Asian trade. Champion Iron (CIA) (-4.1%) and Mineral Resources (MIN) (-3.4%) were the heaviest hit, while Fortescue (FMG) (-1.0%) also slid.
S&P/ASX 200 Information Technology (XIJ) (-2.3%) followed its US counterparts lower as the AI trade unwind rolled on and benchmark bond yields stayed stubbornly high. Tech valuations lean heavily on profits expected years down the track, and those future earnings are worth less today when safe returns from bonds are high. TechnologyOne (TNE) (-6.1%) led the losses, handing back some of Tuesday’s gains amid broker downgrades and debt concerns. Xero (XRO) (-3.8%) and WiseTech Global (WTC) (-0.7%) also fell.
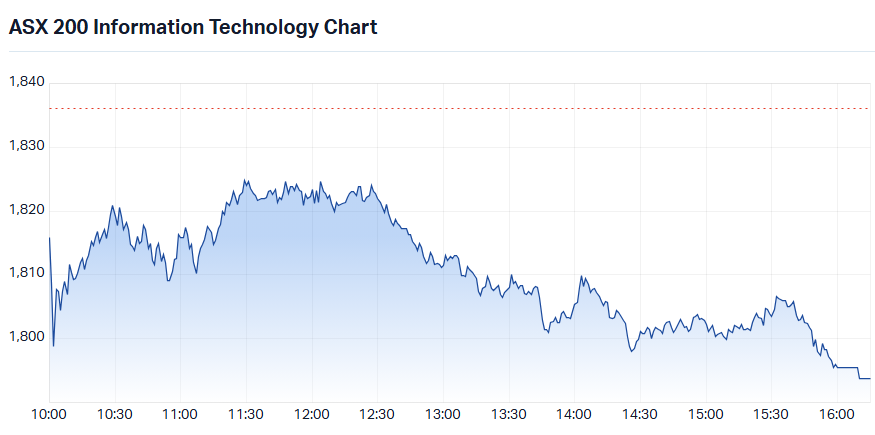
S&P/ASX 200 Information Technology Sector Index (XIJ) intraday chart
S&P/ASX 200 Consumer Discretionary (XDJ) (-1.1%) was sunk by those higher yields, broader risk-off sentiment and hotter-than-expected wages data. The wage price index rose 1.0% in the September quarter, faster than June’s 0.8% pace and ahead of the 0.9% economists had forecast. Annualising at 4.0%, it will likely worry the RBA that higher wages are stoking inflation, and that high inflation expectations are embedded in wage negotiations. Bapcor (BAP) (-3.3%) and Lovisa Holdings (LOV) (-2.8%) were among the decliners.
Travel stocks were hit hardest, with Corporate Travel Management (CTD) (-5.9%) and Flight Centre Travel Group (FLT) (-3.9%) leading the losses. Webbeds Group (WEB) (-3.3%) also fell.
S&P/ASX 200 Financials (XFJ) (-0.7%) fell as the same wages-driven rates worry likely weighed on interest rate-sensitive stocks. Fund managers were the clear-worst performers for the second session running, led by AMP (AMP) (-3.6%). GQG Partners (GQG) (-3.3%) and Pinnacle Investment Management Group (PNI) (-3.3%) also fell.
The big banks, typically the anchors of the ASX, also lost ground, led by National Australia Bank (NAB) (-1.9%). ANZ Group Holdings (ANZ) (-1.2%) and Westpac Banking Corporation (WBC) (-1.1%) followed, while Commonwealth Bank of Australia (CBA) (+0.3%) bucked the trend to outperform for a second straight day.
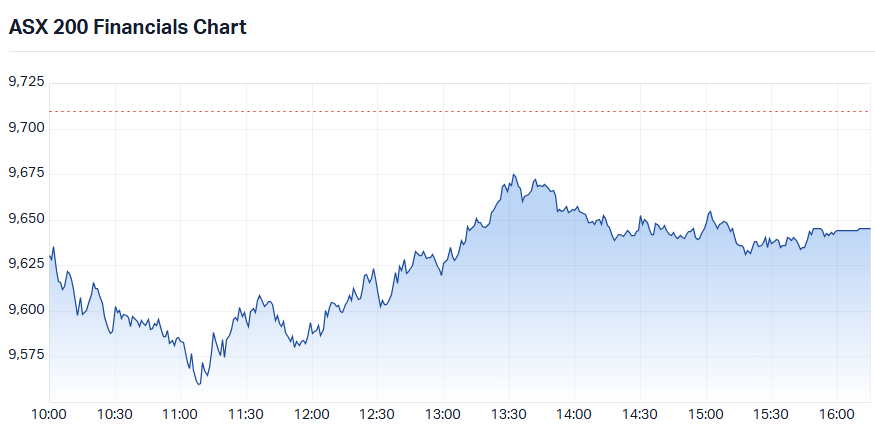
S&P/ASX 200 Financials Sector Index (XFJ) intraday chart
Today's best ASX Top 300 gainers
Company | Last Price | Change $ | Change % | 1mo % | 1yr % |
|---|---|---|---|---|---|
| Nuix (NXL) | $2.31 | +$0.72 | +45.3% | +30.9% | +24.2% |
| MA Financial Group (MAF) | $4.37 | +$0.15 | +3.6% | -6.4% | -53.2% |
| Infratil (IFT) | $11.11 | +$0.33 | +3.1% | +6.6% | +11.0% |
| Whitehaven Coal (WHC) | $6.87 | +$0.19 | +2.8% | -8.9% | -1.4% |
| Lynas Rare Earths (LYC) | $12.37 | +$0.34 | +2.8% | +11.7% | -15.4% |
| Metals X (MLX) | $1.54 | +$0.035 | +2.3% | -9.4% | +96.2% |
| Bellevue Gold (BGL) | $1.44 | +$0.03 | +2.1% | -1.0% | +20.5% |
| Yancoal Australia (YAL) | $5.50 | +$0.11 | +2.0% | -7.6% | +0.2% |
| EQ Resources (EQR) | $0.265 | +$0.005 | +1.9% | -5.4% | +440.8% |
| HMC Capital (HMC) | $3.53 | +$0.06 | +1.7% | +29.3% | +19.7% |
| Stanmore Resources (SMR) | $2.36 | +$0.04 | +1.7% | -12.9% | +10.8% |
| Cromwell Property Group (CMW) | $0.35 | +$0.005 | +1.4% | +9.4% | -21.3% |
| Nanosonics (NAN) | $2.96 | +$0.04 | +1.4% | +3.5% | -23.7% |
| Djerriwarrh Investments (DJW) | $3.05 | +$0.04 | +1.3% | +2.7% | +0.3% |
| Region Group (RGN) | $2.39 | +$0.03 | +1.3% | +8.6% | +0.4% |
| Suncorp Group (SUN) | $20.73 | +$0.26 | +1.3% | +5.9% | +9.5% |
| Contact Energy (CEN) | $7.19 | +$0.09 | +1.3% | +2.1% | -12.8% |
| Woodside Energy Group (WDS) | $30.79 | +$0.35 | +1.2% | -7.1% | +18.6% |
| BSP Financial Group (BFL) | $7.99 | +$0.09 | +1.1% | +4.3% | +0.9% |
| Plato Income Maximiser (PL8) | $1.385 | +$0.015 | +1.1% | -0.4% | -3.1% |
Today's worst ASX Top 300 losers
Company | Last Price | Change $ | Change % | 1mo % | 1yr % |
|---|---|---|---|---|---|
| LendLease Group (LLC) | $1.72 | -$0.35 | -16.9% | -28.0% | -67.0% |
| Ora Banda Mining (OBM) | $1.31 | -$0.14 | -9.7% | -6.8% | +13.9% |
| Tasmea (TEA) | $8.87 | -$0.93 | -9.5% | -11.3% | +74.6% |
| IPH (IPH) | $3.16 | -$0.26 | -7.6% | -8.9% | -12.0% |
| Perenti (PRN) | $1.96 | -$0.15 | -7.1% | -4.4% | -25.8% |
| PDI Gold (PDI) | $4.09 | -$0.31 | -7.0% | -6.6% | +39.8% |
| Benz Mining Corp (BNZ) | $3.84 | -$0.28 | -6.8% | -5.4% | +184.4% |
| Technology One (TNE) | $33.00 | -$2.15 | -6.1% | +3.4% | +12.8% |
| Sunrise Energy Metals (SRL) | $10.12 | -$0.64 | -5.9% | -35.7% | +132.6% |
| Evolution Mining (EVN) | $11.74 | -$0.66 | -5.3% | -6.8% | +8.5% |
| Macmahon Holdings (MAH) | $0.87 | -$0.045 | -4.9% | -19.4% | +58.2% |
| Forrestania Resources (FRS) | $0.30 | -$0.015 | -4.8% | -13.0% | +42.9% |
| Catapult Sports (CAT) | $2.89 | -$0.13 | -4.3% | -10.0% | -40.0% |
| Catalyst Metals (CYL) | $4.01 | -$0.18 | -4.3% | -28.3% | -42.3% |
| Resolute Mining (RSG) | $1.12 | -$0.05 | -4.3% | +0.4% | +11.4% |
| Regis Resources (RRL) | $6.39 | -$0.28 | -4.2% | -10.0% | -3.9% |
| Champion Iron (CIA) | $1.75 | -$0.075 | -4.1% | -26.5% | -65.4% |
| Superloop (SLC) | $2.34 | -$0.10 | -4.1% | -9.3% | -3.3% |
| Pro Medicus (PME) | $193.39 | -$8.26 | -4.1% | +10.1% | -23.0% |
| Kingsgate Consolidated (KCN) | $3.87 | -$0.16 | -4.0% | -18.2% | -10.0% |
Chartwatch
Nasdaq Composite Index
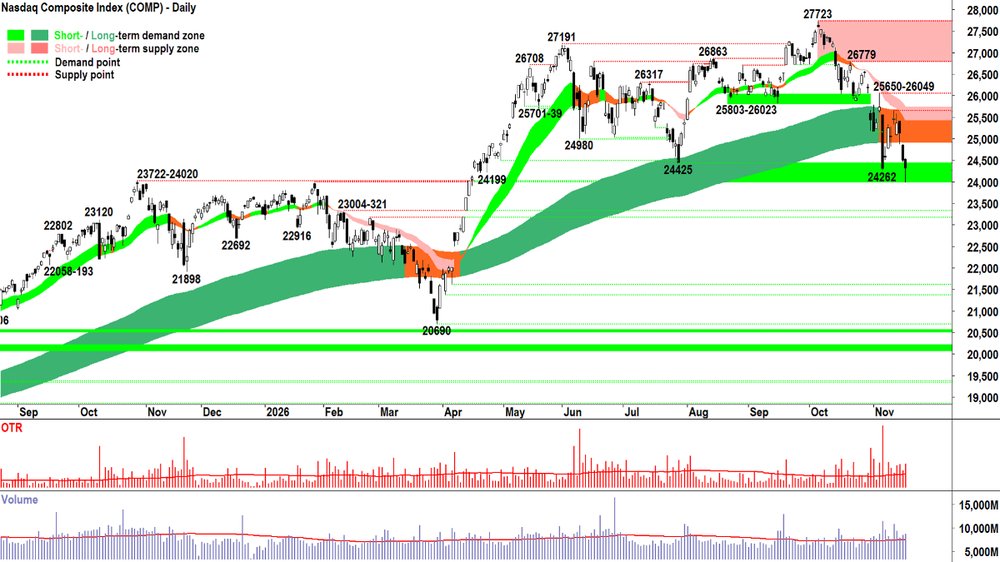
Nasdaq Composite Index chart
Analysis
We did the bulk of the analysis in today’s webinar (link below 👇), so I’ll simply note here that everything appears to be tracking in line with short and (developing) long term trends. I.e.:
The short term trend is down ⚠️
The long term trend is very arguably also down ⚠️
The price action is falling peaks and falling troughs (i.e., lack of FOMO, HOFU & BTD — but plenty of NUTE, FOHO & STR) ⚠️
The candles appear to be reflecting the prevailing supply side controlled environment (i.e., black bodied and or with upward pointing shadows*) ⚠️
There appears to be greater volatility on supply-controlled days than demand-controlled days ⚠️
Nothing in the volume suggests that the demand side has swept in to dislodge panicked supply and BTD* ⚠️
“Ahem… what about those two *’s in there, Carl?”, I hear you say!
Tuesday’s candle does have a downward pointing shadow (i.e., the first ), and it did occur on above average volatility and volume (the second ). It’s low, and therefore the demand that caused the downward pointing shadow — also occurred smack-bang at a critical point of demand (23989, sorry, I had this incorrectly labelled as 23722… not sure why… but you can check it yourself!).
Is it enough to signal the turning of the tide? 🤔
It’s very interesting. But for me, no… at least not yet. Confirmation. That’s what’s required from here. A mighty big white-bodied candle reaching back up into the long term trend ribbon on substantially above average volume. Then we’ll start talking about “the low is in!”
View
Analyse = ⚠️⚠️⚠️⚠️⚠️⚠️
Accept = S > D = P⬇️
Act = I'm at 1/3RP on US stocks (RP = Risk Position – it reflects my personal allowable capital allocation limit for my investments in US stocks. So, 1/3RP is 33%, 1/2RP is 50%, 2/3RP is 67% and FRP is 100%).
Key Levels
The long term trend ribbon is the closest (dynamic) zone of supply (presently 24913-25633) but the short term trend ribbon (presently 25441-25745) is likely the critical go-no-go for the current short term downtrend. There appears to be a substantial zone of potential latent demand between 23989-24425. If it goes... 20690?
S&P/ASX 200 (XJO)
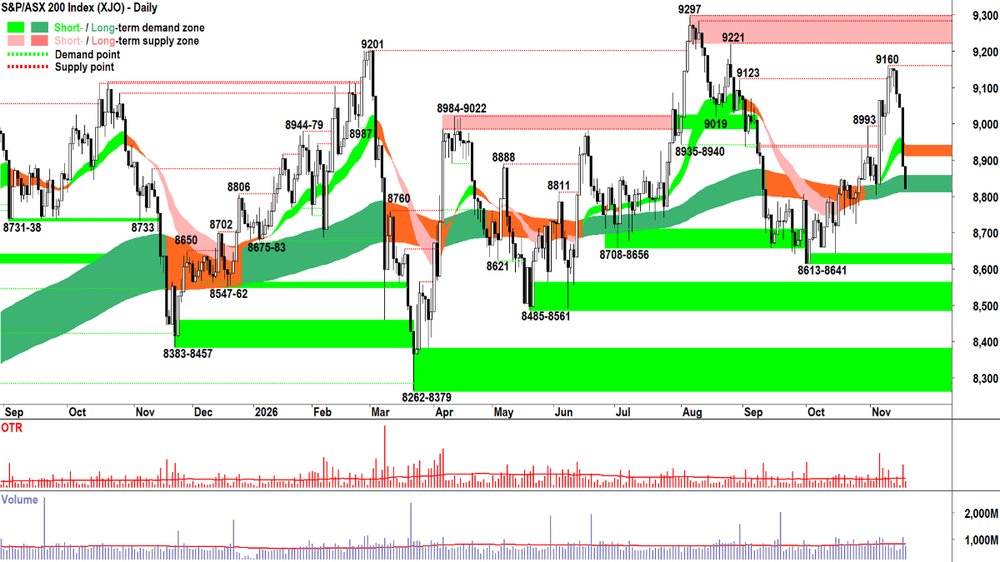
S&P/ASX 200 (XJO) chart
Analysis
Again, full analysis in today's webinar recording below 👇
But you also wanna watch this video for the bit right at the end.
I don't want to over promise and underdeliver here... but: It will properly blow your mind! 🤯
Or at the very least confirm something that you've suspected for about as long as you've been suffering through my rantings here in ChartWatch each day! 😉
View
No change to the Analysis and Accept here... therefore my Act remains: I am at 1/2RP on Australian shares (i.e., 50% invested vs 50% cash, with some of the invested portion allocated to shorts). As usual, moves between RP levels is a walk, not a run. Ideally they're enacted within the next week, but often, one will find that these things take care of themselves!
Key Levels
9160 is the closest point of supply. The long term trend ribbon is the closest zone of (dynamic) demand (presently 8813-8858). Below 8813, the next critical zone of demand is 8613-8641.
(Glossary of acronyms! Old Tin Pot (OTP): S&P/ASX 200 | MOTN: More Often Than Not | FOMO: Fear Of Missing Out | HOFU: Holding On For Upside | BTD: Buy The Dip | NUTE: No Urgency To Enter | FOHO: Fear Of Holding On | STR: Sell The Rally | RP: Risk Position | FFS: Fund Flow Shenanigans!)
***CHARTWATCH LIVE — NEW VIDEO DROPPED!!! 📺***
ChartWatch LIVE Webinars – WEEKLY Wednesday's @ 12pm AEDT
Learn more about technical analysis and trend following through real case studies on ASX stocks. Australia's premier technical analyst, Carl Capolingua, shares his unique insights on stocks as requested by viewers. Ask about a company in your portfolio or anything related to trading and investing and get Carl's expert opinion.
Places are limited so >REGISTER NOW!<
Economy
TODAY
AUS September Quarter Wage Price Index:
Result: +1.0% q/q vs +0.9% q/q forecast and +0.8% q/q in June quarte
Reader: Hotter than expected, and annualising at 4.0% p.a. — higher than the current underlying inflation rate — suggesting wages likely still bleeding into inflation... Won't be well received at the RBA!
LATER THIS WEEK
THURSDAY
06:00 USA FOMC November Meeting Minutes
11:30 AUS October Employment Data
Change: +25,200 forecast vs -39,300 in September
Rate: 4.7% forecast, unchanged vs September
FRIDAY
12:00 People's Bank of China ("PBOC") Loan Prime Rate ("LPR")
1-year LPR: 3.00% p.a. forecast, unchanged
5-year LPR: 3.50% p.a. forecast, unchanged
Interesting Movers
Trading higher
- Nuix (NXL) $2.31+45.3%
Entered a Process Deed with Haveli Investments Software Fund I, L.P. on an unsolicited, conditional, non-binding indicative proposal to acquire all Nuix ordinary shares by way of a scheme for $2.75 cash per share. Official bid follows earlier proposals. The Nuix board has stated that it supports the proposal, which is subject to due diligence.
- Gorilla Gold Mines (GG8) $0.38+43.4%
Announced it has received firm commitments to raise approximately $60 million following a binding agreement to acquire the Cosmos Project from IGO (IGO). Tembo Capital to cornerstone $30 million (expected to hold ~9.9% post-Tranche 1) of the raise. GG8 directors will subscribe for $2.4 million (including A$1 million from Executive Chairman Simon Lawson), subject to shareholder approval.
- Larvotto Resources (LRV) $0.74+7.3%
Announced that its offtake partners Glencore and Wogen Resources provided a combined US$30 million prepayment (US$15m each) to support working capital for the commissioning phase of the company's Hillgrove Mine, which is expected to be finalised by the end of December.
- Metallium (MTM) $0.25+6.5%
Commissioned an upgraded Flash Joule Heating reactor at Gator Point, Texas. First MXene campaign scheduled, work being carried out for Environmental Clean Technologies under a 12‑month R&D and engineering services agreement.
- Investigator Silver (IVR) $0.05+6.0%
No news. No real commodity price lead to speak of either. Just a bounce in the broader precious metals sector...
- Arafura Rare Earths (ARU) $0.15+5.4%
No news. No real commodity price lead to speak of either. Just a bounce in the broader rare earths sector...
- AVITA Medical, Inc. (AVH) $4.72+4.9%
No news. Monster uptrend... not a surprising result! 📈
- Brazilian Rare Earths (BRE) $1.77+4.1%
Announced that drilling at the company's Pelé South project has identified extensive, high-grade rare earth mineralisation across a corridor exceeding 2.5 km with additional targets to the north, south and east. Notable results included 6 m at 13.2% TREO, 14.3 m at 11.2%, 6 m at 11.4%, and 12 m at 10.9%.
- Silver Mines (SVL) $0.14+3.9%
No news. No real commodity price lead to speak of either. Just a bounce in the broader precious metals sector...
Trading Lower
- EML Payments (EML) $0.26-23.5%
Issued FY27 trading update at its AGM held today. FY27 underlying EBITDA guidance reaffirmed at $50–54 million. Q1 trading in line with management expectations. Q1 revenue down 3% vs pcp, gross profit down 4%, net overheads down 6%, resulting in underlying EBITDA up 6%. Management said that Project Arlo is on track, it's seeing strong contract renewal activity, and the mobility solution pipeline is growing.
- LendLease Group (LLC) $1.72-16.9%
Received a 'please explain' from the ASX about its share price plunge. The ASX asked if the company was aware of any undisclosed information that could explain recent trading — the company responded: 'No'. 🤔 Morgan Stanley downgraded its rating on the stock to underweight today probably also didn't help... LLC is one of the most featured downtrends in the history of the ChartWatch ASX Scans Downtrends List! 📉
- Webjet Group (WJL) $0.27-14.3%
Released its first half FY27 results. TTV was flat, revenue was down 12% to $60.0 million, underlying EBITDA declined to $7.0 million, and statutory NPAT -$2.7 million. OTA segment's underlying EBITDA was down 32%.
- Cettire (CTT) $0.28-12.7%
Issued a trading update at its AGM held today. For the four months to 31 Oct 2026: gross revenue $331.0 million (+18%), sales revenue $246.2 million (+15%), delivered margin $42.2 million, adjusted EBITDA $6.9 million, cash position $27 million, and zero financial debt.
- Ora Banda Mining (OBM) $1.31-9.7%
Issued a FY27 guidance at its AGM held today. Growth capital expenditure expected to be $425 million, production guidance 125,000–140,000 oz gold, and all‑in sustaining costs (AISC) $3,400–3,600/oz.
- Tasmea (TEA) $8.87-9.5%
Provided a trading update at its AGM held today. FY27 guidance upgraded to Underlying EBITA A$210–215 million (from $205–210 million) and Underlying NPATA A$133–136 million (from A$130–133 million). Reported record first quarter FY27 performance with organic growth well above management's 15% target. Management also noted that recent acquisitions Maxim Group and JPS Group are performing above expectations, noting "High demand for specialist services and strong operating conditions are continuing across our diversified portfolio."
- Ion Video (IOV) $0.79-8.7%
No news. Pulled back from yesterday's massive spike due to positive AWS video trial.
- Artrya (AYA) $2.68-7.6%
No news. AYA is a regular in the ChartWatch ASX Scans Downtrends List. 📉
- Saturn Metals (STN) $0.34-6.8%
No news. STN is a regular in the ChartWatch ASX Scans Downtrends List. 📉
- WA1 Resources (WA1) $7.04-4.0%
Held its AGM and released Luni Project PFS confirming potential for a strategic long-life niobium project. Ore Reserve 20.3 Mt at 2.75% Nb2O5, initial mine life 17 years, pre-tax NPV (real) $2.5 billion (IRR 29%) and $3.0 billion at current spot prices. WA1 is a regular in the ChartWatch ASX Scans Downtrends List. 📉
Broker Moves
Company | Broker | Action | Rating | Price Target |
|---|---|---|---|---|
ALKAlkane Resources | UBS | Retained | Buy | $2.65 |
APEEagers Automotive | Macquarie | Retained | Outperform | $22.20 |
BGLBellevue Gold | Barrenjoey | Retained | Overweight | $2.00 |
| Macquarie | Retained | Outperform | $1.80 | |
BM1Ballard Mining | Canaccord Genuity | Retained | Speculative Buy | $1.65 |
CHNChalice Mining | UBS | Retained | Buy | $2.10 |
CMMCapricorn Metals | UBS | Retained | Buy | $24.00 |
CYLCatalyst Metals | UBS | Retained | Buy | $6.25 |
DMPDomino's Pizza Enterprises | UBS | Retained | Neutral | $24.00 |
DUGDUG Technology | Shaw and Partners | Retained | Buy | $3.10(from $3.00) |
EMREmerald Resources NL | UBS | Retained | Buy | $9.50 |
GYGGuzman Y Gomez | UBS | Retained | Neutral | $29.00 |
IPHIPH | Macquarie | Retained | Neutral | $3.37(from $3.65) |
LLCLendLease Group | Morgan Stanley | Downgraded | Underweight(from Equal Weight) | $2.24(from $3.21) |
LOVLovisa Holdings | UBS | Retained | Buy | $28.00 |
PDIPDI Gold | Barrenjoey | Retained | Overweight | $6.25 |
QANQantas Airways | UBS | Retained | Buy | $11.10(from $11.40) |
RDYReadyTech Holdings | Shaw and Partners | Retained | Buy | $2.90(from $2.80) |
REGRegis Healthcare | Macquarie | Retained | Outperform | $5.70(from $5.90) |
RHCRamsay Health Care | Morgan Stanley | Retained | Underweight | $41.90 |
RRLRegis Resources | UBS | Retained | Buy | $9.20 |
SX2Southern Cross Gold Consolidated | UBS | Retained | Buy | $16.00 |
TGNTungsten Mining NL | Canaccord Genuity | Retained | Speculative Buy | $0.45 |
TNETechnology One | Macquarie | Retained | Outperform | $38.70(from $30.50) |
| UBS | Retained | Neutral | $35.80(from $32.70) | |
TUATuas | Morgan Stanley | Retained | Overweight | $3.70 |
UNIUniversal Store Holdings | UBS | Retained | Buy | $9.00 |
VGNVirgin Australia Holdings | UBS | Retained | Buy | $4.10 |
WGXWestgold Resources | UBS | Retained | Buy | $9.75 |
Scans
Top Gainers
Code | Company | Last | % Chg |
|---|---|---|---|
| NXL | NUIX Ltd | $2.31 | +45.28% |
| GG8 | Gorilla Gold Mines Ltd | $0.38 | +43.40% |
| IDT | IDT Australia Ltd | $0.046 | +35.29% |
| HOR | Horseshoe Metals Ltd | $0.018 | +28.57% |
| BHL | Black Horse Mining Ltd | $0.225 | +25.00% |
Top Fallers
Code | Company | Last | % Chg |
|---|---|---|---|
| NGY | Nuenergy Gas Ltd | $0.019 | -26.92% |
| EML | EML Payments Ltd | $0.255 | -25.00% |
| VAN | Vantage Metals Ltd | $0.02 | -23.08% |
| BTC | BTC Health Ltd | $0.037 | -22.92% |
| EMT | Emetals Ltd | $0.027 | -22.86% |
52 Week Highs
Code | Company | Last | % Chg |
|---|---|---|---|
| NXL | NUIX Ltd | $2.31 | +45.28% |
| CLG | Close the Loop Ltd | $0.045 | +3.45% |
| GRS | Gwardar Resources Ltd | $0.78 | +2.63% |
| SUN | Suncorp Group Ltd | $20.73 | +1.27% |
| MYX | Mayne Pharma Group Ltd | $6.06 | +0.83% |
52 Week Lows
Code | Company | Last | % Chg |
|---|---|---|---|
| NGY | Nuenergy Gas Ltd | $0.019 | -26.92% |
| BTC | BTC Health Ltd | $0.037 | -22.92% |
| EMT | Emetals Ltd | $0.027 | -22.86% |
| LGM | Legacy Minerals Holdings Ltd | $0.072 | -21.74% |
| TSK | Tusker Minerals Ltd | $0.04 | -20.00% |
Near Highs
Code | Company | Last | % Chg |
|---|---|---|---|
| BEAR | Betashares Australian Equities Bear Complex ETF | $7.39 | +1.79% |
| OZBD | Betashares Australian Composite Bond ETF | $43.12 | -0.07% |
| AN3PI | Australia and New Zealand Banking Group Ltd | $102.97 | +0.15% |
| PCI | Perpetual Credit Income Trust | $1.08 | -0.46% |
| WVOL | iShares MSCI World Ex Aust Minimum Volatility ETF | $49.34 | -0.46% |
Relative Strength Index (RSI) Oversold
Code | Company | Last | % Chg |
|---|---|---|---|
| CSC | Capstone Copper Corp | $9.73 | -6.80% |
| INN | Innovaero Technologies Ltd | $0.22 | -21.43% |
| BTXX | Digitalx Bitcoin ETF | $20.80 | -0.29% |
| BCA | Black Canyon Ltd | $0.24 | -5.88% |
| GQG | GQG Partners Inc | $0.61 | -7.58% |