News | Market Wraps
Evening Wrap: ASX 200 slides as CBA and Big Banks shellacking frees up cash for surging BHP, FMG, RIO and mining stocks
The S&P/ASX 200 closed 36.6 points lower, down 0.43%.

The S&P/ASX 200 closed 36.6 points lower, down 0.43%.
Finally something to cheer for investors in our big mining stocks! It's been nearly one-way traffic for their share prices over the last 12-months, and not in the direction we'd prefer! But today, they came storming back, with 3, 4, and even 5% gains in many of the majors like BHP, Fortescue, Sandfire Resources, and Rio Tinto...
But, us Aussie investors have become accustomed to getting a slice of cake and not being allowed to eat it 🍰☹️! For every winner on the ASX, there's usually a loser, and today it was the Big Banks. That means substantial losses for the likes of CBA, ANZ, NAB and WBC.
To make sense of all the above, I have detailed technical analysis on the Nasdaq Composite and the S&P/ASX 200 in today's ChartWatch.
Be sure to click/scroll through for the usual reporting of the major sector and stock-specific moves, the broker responses to them, as well as all the key economic data in tonight's Evening Wrap.
Let's dive in!
Today in Review
Fri 27 Jun 25, 5:15pm (AEST)
Name | Value | % Chg |
|---|---|---|
Major Indices | ||
| ASX 200 | 8,514.2 | -0.43% |
| All Ords | 8,743.7 | -0.34% |
| Small Ords | 3,236.1 | +0.28% |
| All Tech | 4,015.6 | +0.97% |
| Emerging Companies | 2,281.3 | +1.30% |
Currency | ||
| AUD/USD | 0.6551 | +0.07% |
US Futures | ||
| S&P 500 | 6,209.75 | +0.24% |
| Dow Jones | 43,850.0 | +0.30% |
| Nasdaq | 22,728.75 | +0.26% |
Name | Value | % Chg |
|---|---|---|
Sector | ||
| Materials | 15,982.0 | +2.27% |
| Information Technology | 2,897.2 | +0.55% |
| Communication Services | 1,844.8 | +0.54% |
| Energy | 8,678.9 | -0.04% |
| Consumer Discretionary | 4,103.0 | -0.16% |
| Industrials | 8,236.5 | -0.73% |
| Consumer Staples | 12,112.0 | -0.87% |
| Utilities | 9,167.6 | -0.97% |
| Real Estate | 3,903.8 | -1.18% |
| Health Care | 40,958.1 | -1.42% |
| Financials | 9,484.0 | -1.51% |
Markets
%20intraday%20chart%2026%20Jun%202025.png)
ASX 200 Session Chart
The S&P/ASX 200 (XJO) finished 36.6 points lower at 8514.2, 1.07% from its session high and smack–bang on its session low. But, as bad as it all looked on the benchmark, there was a glimmer of positivity in the broader-based S&P/ASX 300 (XKO) where advancers managed to beat decliners by a slender 147 to 132.
For the week, the XJO finished up 8.7 points or just 0.1% higher, roughly in the middle of its weekly trading range, 0.61% from its intraweek low and 0.76% from its intraweek high.
Basically, add up today's and this week's performance and it suggests an environment of great indecision. Some see a path higher for Aussie stocks – given we were up nicely during the week and just a stone's throw from a new all-time high – yet looking at today's dismal capitulation... there are clearly also many who are thinking "um... not so much"!
But just how terrible was today's performance? 🤔 You can see from the above stats that in the XKO advancers beat decliners. If you look at the even broader All Ordinaries (XAO) which contains roughly 500 stocks, the stat skewed further towards gainers at 253 to 191.
So, it wasn't that bad a day at all. Just that the stocks that were "bad" held more clout than the outnumbering stocks that were "good". Your honour, I present Exhibit A, Commonwealth Bank of Australia (CBA) (-2.8%) 🧑⚖️:
%20intraday%20chart%2026%20Jun%202025.png)
Commonwealth Bank of Australia (CBA) intraday chart 26 Jun 2025
I won't show you the intraday charts of CBA's 3 best buddies, but they were nearly identical. The funds switched the Ryobi blower-vac from suck to blow on the big banks today.
But in true tinpot style, they didn't take that money out of the market and stick it in cash, or under the mattress etc. They still saw fit to keep that money at risk in Aussie stocks, just in different Aussie stocks – and that's a good thing.
Which stocks? Resources (XJR) (+2.0%), more specifically big resources (because ironically these are the most liquid and therefore least risk options in the space), like BHP Group (BHP) (+3.9%), Fortescue (FMG) (+3.6%), and Rio Tinto (RIO) (+4.6%).
%20intraday%20chart%2026%20Jun%202025.png)
BHP Group (BHP) intraday chart 26 Jun 2025
It's the yin and yang of the Aussie market ☯️! Rarely to we get to have the proverbial slice of cake and eat it with all of the sectors going up in unison!
Today's seemingly horrific candle (we'll talk about that in ChartWatch below) is more due to the weighting of the banks having grown so large lately, that their modest losses (Financials (XFJ) (-1.5%)) had a larger impact in terms of index points than the solid gains we saw in Resources.
The rest was a bit of a sideshow, really, but again, it's encouraging the market breadth in the broader-based indices fell on the right side of demand-side control. The big question of course, is whether today's move is the opening of the floodgates for the much mooted by value investors rotation out of "expensive" banks into "cheap" resources.
That's an answer that will be played out in the charts over the next few days and weeks. I'm looking at the CBA chart after today's close, and the candle does speak of supply arriving to meet the prevailing environment of excess demand – if only for a transitory period. Unfortunately, I probably won't be around to call the next phase because of the note below... but I have every confidence you have all the tools to do just that yourself 🧐!
Ciao, au revoir, auf wiedersehen 👋!
Very early tomorrow morning I'll be jumping on a plane to Europe for 4 weeks. Wining, dining, exclusive beachside clubs on the Amalfi Coast? A bit of that, but probably a lot more of shuffling two teenagers around the major attractions through the crowds in the stifling heat! 😁
While I'm away, you'll be in good hands on two fronts. Firstly, the Evening Wrap is going to be picked up by my colleagues Kerry Sun and Chris Conway. They'll alternate through and make sure you have all the usual news, data, and insights from the trading day that was.
The other set of good hands I have no doubt you'll be in is your own. Assuming you've been suffering through my rantings here for long enough to read the letters: D vs S = P... I'm confident you'll be able to do the work, read the trends, price action, and candles, and determine which side (the demand-side or the supply-side) is in control of the price.
Trust what you've learned. Trust the trend. Trust in MOTN. You'll never be able to predict the future, because that's impossible, but if you manage your risk according to the first three items, you'll be able to appropriately navigate with safety any outcome the market throws at you.
Good luck, and I'll chat with you very soon! 👋
ChartWatch
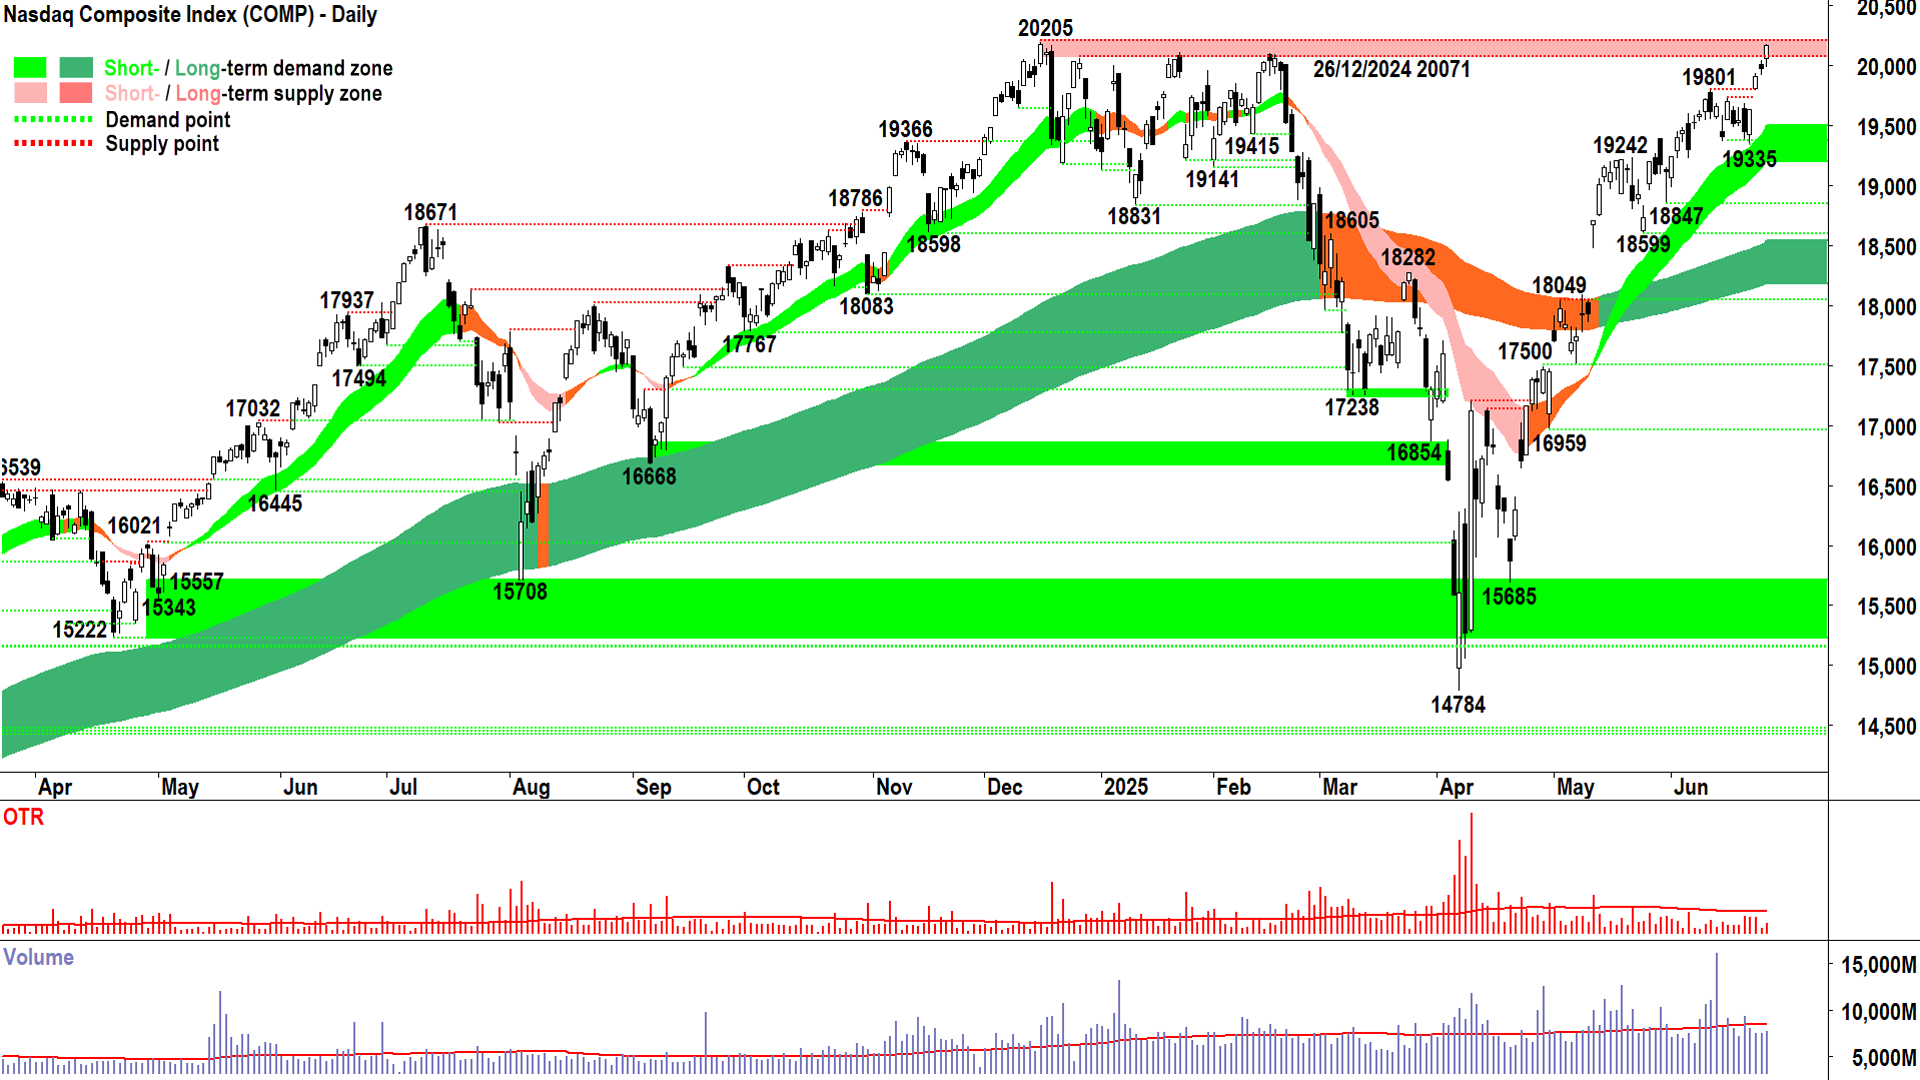
NASDAQ Composite Index

An interesting chart (click here for full size image)
Sublime. Gotta love the Comp! More often than not (MOTN) it fulfils its promise, nay, it’s destiny 💪💪💪!
Now take a look at our tinpot little market (chart and its lousy candle below 👇). What do we get? A failure to launch and dashed hopes and dreams 😭!
Okay, perhaps I’m getting a little dramatic and emotional here…but just as terrible our performance was today, the Comp’s was excellent.
The candle: Just about a closing high, white-bodied, and with a downward pointing shadow = A credible demand-side showing that's consistent with the prevailing demand-side technicals of:
✅ Rising trend ribbons
✅ Trend ribbons acting as zones of dynamic demand
✅ Rising peaks and rising troughs
✅ Predominance of demand-side candles
As I often note here, if we push into an old supply zone with a confident demand-side showing, then there’s probably not very much supply up there.
And given circumstances, i.e., given how long 20205 has been in place – and the craziness that transpired to get us from there down to 14784 and all the way back again – well, that really is quite incredible 🤯.
There’s not a single thing I don’t like about this chart (in terms of how demand-side control is manifesting itself). Ordinarily, as in MOTN, that means the price of such a chart would tend to rise. Therefore, I remain FRP.
Now, I know many will scream of overvaluations, uncertainty, and impending doom and gloom... but words mean nothing! All that matters is D vs S = P – and right now D >> S = P ⬆️
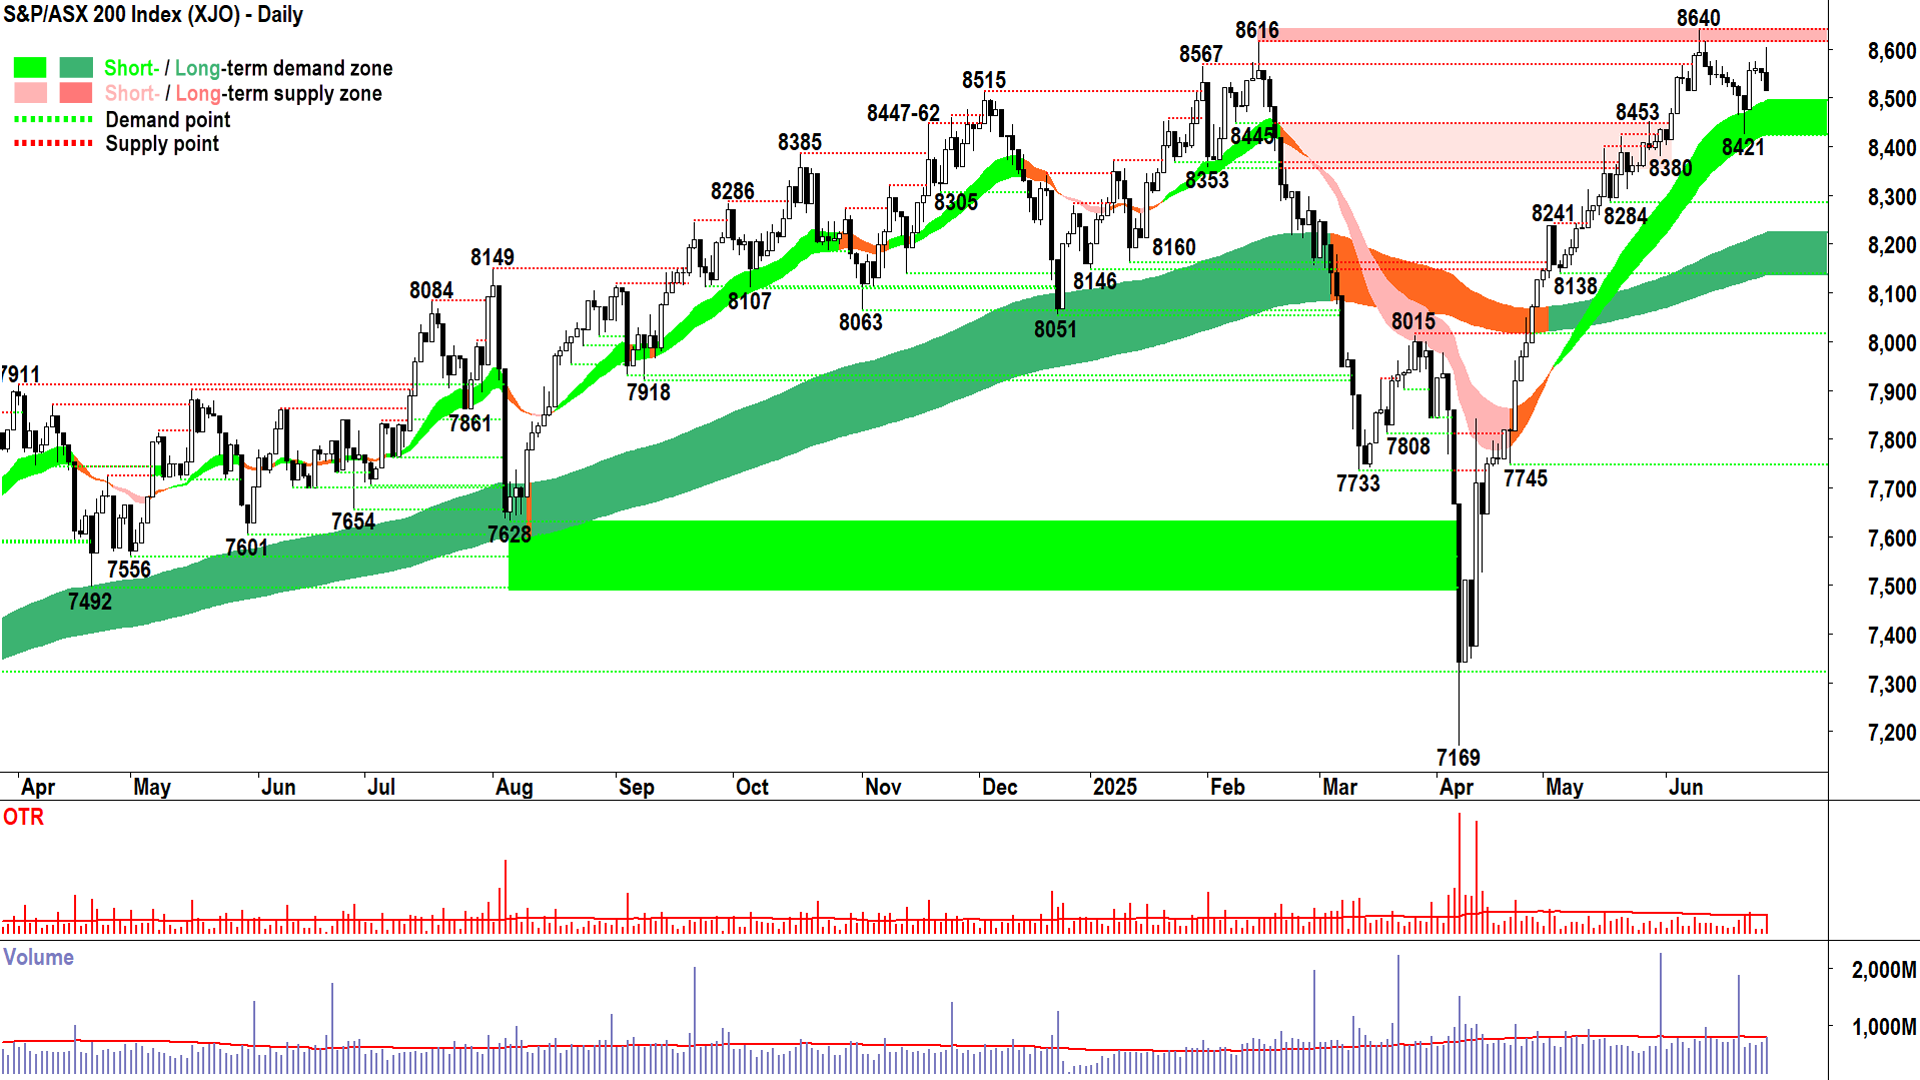
S&P/ASX 200 (XJO)
%20chart%2026%20Jun%202025.png)
An interesting chart (click here for full size image)
I'm not sure I can even summon the will to write about this one today. Booooo! Bloody pathetic 👎👎!
What exactly is our problem? Is it (again to quote) "overvaluations, uncertainty, and impending doom and gloom"? Nope, just that today, S > D = P ⬇️.
My point is: It doesn't matter why. It just is.
We can't control it, so there's no point getting all worked up about it! Hey – what's stopping you from selling up here and investing all your dough in Comp stocks!
The XJO tends to do things in its own time, and often not on US stocks' agenda. Our market is so concentrated in banks and resources that if one of them has a bad day (today it was the banks) the index could go nowhere with otherwise fantastic leads.
We saw those all important fund flows rear their head again today, but this time, they were running hard the other way – from banks into resources. But, given the weighting of the banks have grown so large lately, their modest losses had a larger impact than the very solid gains we saw in resources.
Where does this leave us on the technicals? Simple: Calling it as we see it. That's always our job.
So, still overall demand-side control. Trend ribbons, price action, and even after today's poor showing, the candles suggest as much. But...and this is an important but...with now 3 candles telling us there is some very serious latent supply lurking above 8600 ⚠️.
I am of course referring to the two other (in addition to today's) long upward pointing shadows that set 8616 and 8640 as peaks (one could even argue the 8567 candle counts, too!).
Selling into strength, particularly selling that reinforces historical points of supply is never a great look. To put the damage done by today's candle into perspective, let's say that if I had to give the Comp a sore out of 10 – considering its comparable demand-side candle – I am at a 10...💯
Us? Well, maybe I can go as high as... 7 out of 10! 🤦
Economy
Today
There weren't any major data releases in our time zone today
Later this week
Friday
22:30 USA Core Personal Consumption Expenditures (PCE) May
Price Index: +0.1% m/m forecast vs +0.1% m/m in April
Personal Income: +0.2% m/m forecast vs +0.8% m/m in April
Personal Spending: +0.2% m/m forecast vs +0.2% m/m in April
Latest News
Interesting Movers
Trading higher
+18.8% Aml3d (AL3) – Senior US Navy Program Lead Appointed to Board of AML3D USA.
+11.2% Core Lithium (CXO) – No news, general strength across the broader Resources sector today.
+11.1% Avita Medical (AVH) – No news, bounced in the wake of the recent sharp selloff.
+10.2% New World Resources (NWC) – CAML After Market Purchases and Offer Price Increase.
+9.7% Chalice Mining (CHN) – Gonneville PGE-Ni-Cu-Co Project development plan defined, general strength across the broader Resources sector today, rise is consistent with prevailing short and long term uptrends, a regular in ChartWatch ASX Scans Uptrends list 🔎📈
+9.4% Develop Global (DVP) – No news, general strength across the broader Resources sector today, rise is consistent with prevailing short and long term uptrends, a regular in ChartWatch ASX Scans Uptrends list 🔎📈
+9.3% Elsight (ELS) – No news, rise is consistent with prevailing short and long term uptrends, a regular in ChartWatch ASX Scans Uptrends list 🔎📈
+7.8% 29METALS (29M) – No news, rise is consistent with prevailing short term uptrend and long term trend is transitioning from down to up 🔎📈
+7.7% Alcoa Corporation (AAI) – No news, general strength across the broader Resources sector today.
+7.6% Almonty Industries (AII) – No news, rise is consistent with prevailing short and long term uptrends, a regular in ChartWatch ASX Scans Uptrends list 🔎📈
+7.4% The Star Entertainment Group (SGR) – No news since 25-Jun 2025 General Meeting Chairman's Address.
Trading lower
-18.7% Reece (REH) – Director Resignation R.McEwan and FY25 Trading Update and Results Notification, fall is consistent with prevailing short and long term downtrends, a regular in ChartWatch ASX Scans Downtrends list 🔎📉
-8.8% SPDR MSCI Australia Select High Dividend Yield Fund ETF (SYI) – Distribution Announcement June 2025.
-6.9% Strike Energy (STX) – Continued negative response to 26-Jun Strategic Review Outcomes, fall is consistent with prevailing short and long term downtrends, a regular in ChartWatch ASX Scans Downtrends list 🔎📉
-6.7% SPDR S&P World EX Australia Carbon Control Fund ETF (WXOZ) – Distribution Announcement June 2025.
-6.2% SPDR S&P World EX AUS Carbon Control (Hedged) Fund ETF (WXHG) – Distribution Announcement June 2025.
-4.0% APA Group (APA) – Continued negative response to 26-Jun AER releases final decision on Baslink.
Broker Moves
Atlantic Lithium (A11)
Downgraded to neutral from outperform at Macquarie; Price Target: $0.160 from $0.250
Astral Resources (AAR)
Retained at speculative buy at Canaccord Genuity; Price Target: $0.540 from $0.490
Australian Clinical Labs (ACL)
Retained at neutral at Macquarie; Price Target: $3.15
Amcor (AMC)
Upgraded to buy from neutral at UBS; Price Target: $18.25 from $16.90
ANZ Group (ANZ)
Retained at sell at UBS; Price Target: $26.50
Aurizon (AZJ)
Retained at neutral at Citi; Price Target: $3.25 from $3.40
Upgraded to outperform from neutral at Macquarie; Price Target: $3.39
Retained at underweight at Morgan Stanley; Price Target: $3.03
Downgraded to hold from accumulate at Morgans; Price Target: $2.94 from $3.10
Retained at hold at Ord Minnett; Price Target: $3.10 from $3.20
Retained at neutral at UBS; Price Target: $3.20
Bendigo and Adelaide Bank (BEN)
Retained at neutral at UBS; Price Target: $11.00
Boss Energy (BOE)
Retained at speculative buy at Canaccord Genuity; Price Target: $5.15
Bank of Queensland (BOQ)
Retained at sell at UBS; Price Target: $6.50
Breville Group (BRG)
Upgraded to overweight from neutral at Jarden; Price Target: $31.00 from $32.10
Canyon Resources (CAY)
Retained at speculative buy at Canaccord Genuity; Price Target: $0.350
Commonwealth Bank of Australia (CBA)
Retained at sell at UBS; Price Target: $120.00
Coronado Global Resources (CRN)
Downgraded to underperform from neutral at Macquarie; Price Target: $0.110 from $0.190
Electro Optic Systems (EOS)
Retained to reduce from buy at Bell Potter; Price Target: $3.10 from $2.15
Healius (HLS)
Retained at neutral at Macquarie; Price Target: $1.400
Integral Diagnostics (IDX)
Retained at outperform at Macquarie; Price Target: $3.20
Judo Capital (JDO)
Retained at buy at UBS; Price Target: $2.20
Liontown Resources (LTR)
Downgraded to underperform from neutral at Macquarie; Price Target: $0.550 from $0.650
Mineral Resources (MIN)
Downgraded to neutral from outperform at Macquarie; Price Target: $22.00 from $35.00
Metro Mining (MMI)
Retained at buy at Shaw and Partners; Price Target: $0.170
Macquarie Group (MQG)
Retained at neutral at UBS; Price Target: $225.00
Monash IVF Group (MVF)
Retained at outperform at Macquarie; Price Target: $1.300
National Australia Bank (NAB)
Retained at neutral at UBS; Price Target: $37.50
Nickel Industries (NIC)
Downgraded to neutral from outperform at Macquarie; Price Target: $0.750 from $0.870
Northern Star Resources (NST)
Retained at buy at Citi; Price Target: $22.00 from $22.50
Ora Banda Mining (OBM)
Upgraded to outperform from neutral at Macquarie; Price Target: $1.050
Sonic Healthcare (SHL)
Upgraded to buy from hold at Bank of America; Price Target: $32.00 from $28.50
Santana Minerals (SMI)
Retained at buy at Shaw and Partners; Price Target: $1.360
Westpac Banking Corporation (WBC)
Retained at buy at UBS; Price Target: $36.00
Woolworths Group (WOW)
Retained at neutral at Citi; Price Target: $33.00
Retained at sector perform at RBC Capital Markets; Price Target: $31.00
Xero (XRO)
Retained at accumulate at Morgans; Price Target: $215.00
Scans
Top Gainers
Code | Company | Last | % Chg |
|---|---|---|---|
| PPG | Pro-Pac Packaging Ltd | $0.02 | +33.33% |
| D3E | D3 Energy Ltd | $0.145 | +31.82% |
| CLG | Close the Loop Ltd | $0.035 | +29.63% |
| BOC | Bougainville Copper Ltd | $0.54 | +25.58% |
| TNC | True North Copper Ltd | $0.44 | +23.94% |
Top Fallers
Code | Company | Last | % Chg |
|---|---|---|---|
| TAT | Tartana Minerals Ltd | $0.026 | -38.10% |
| AXI | Axiom Properties Ltd | $0.027 | -22.86% |
| REH | Reece Ltd | $14.12 | -18.66% |
| STG | Straker Ltd | $0.395 | -17.71% |
| PV1 | Provaris Energy Ltd | $0.014 | -17.65% |
52 Week Highs
Code | Company | Last | % Chg |
|---|---|---|---|
| NPM | Newpeak Metals Ltd | $0.024 | +20.00% |
| ION | Iondrive Ltd | $0.041 | +13.89% |
| SRL | Sunrise Energy Metals Ltd | $0.99 | +10.62% |
| BB1 | Blinklab Ltd | $0.53 | +10.42% |
| NWC | New World Resources Ltd | $0.065 | +10.17% |
52 Week Lows
Code | Company | Last | % Chg |
|---|---|---|---|
| TAT | Tartana Minerals Ltd | $0.026 | -38.10% |
| AVD | Avada Group Ltd | $0.12 | -14.29% |
| VN8 | VONEX Ltd | $0.021 | -12.50% |
| GLH | Global Health Ltd | $0.051 | -8.93% |
| EXL | Elixinol Wellness Ltd | $0.011 | -8.33% |
Near Highs
Code | Company | Last | % Chg |
|---|---|---|---|
| IHD | Ishares S&P/ASX DIV Opportunities Esg Screened ETF | $14.93 | +0.47% |
| BILL | Ishares Core Cash ETF | $100.76 | +0.03% |
| MVB | Vaneck Australian Banks ETF | $41.00 | -2.98% |
| GXAI | Global X Artificial Intelligence ETF | $13.02 | +0.39% |
| ORI | Orica Ltd | $19.26 | +0.26% |
Relative Strength Index (RSI) Oversold
Code | Company | Last | % Chg |
|---|---|---|---|
| DGL | DGL Group Ltd | $0.365 | +1.39% |
| AX1 | Accent Group Ltd | $1.39 | +1.83% |
| DMP | Domino's PIZZA Enterprises Ltd | $19.09 | -1.09% |
| AOF | Australian Unity Office Fund | $0.475 | 0.00% |
| OBM | Ora Banda Mining Ltd | $0.78 | -1.89% |
