News | Market Wraps
Evening Wrap: ASX 200 dips despite critical minerals stocks ARU, TMG, WA1, ILU, MIN and PLS in high demand

Mentioned
The S&P/ASX 200 closed 8.4 points lower, down 0.10%.
Really anything critical minerals was higher today, from antimony, to niobium, to mineral sands... even lithium got a guernsey! Another sector in high demand was biotechnology, not one we usually talk about in Evening Wrap.
The rest were flat to down modestly, with gold stocks once again bringing up the rear as the gold price continues to drift lower in the wake of the de-escalation of Middle East tensions.
To make sense of all the above, I have detailed technical analysis on the Nasdaq Composite, S&P/ASX 200, and the US Dollar Index in today's ChartWatch.
Be sure to click/scroll through for the usual reporting of the major sector and stock-specific moves, the broker responses to them, as well as all the key economic data in tonight's Evening Wrap.
Let's dive in!
Today in Review
Thu 26 Jun 25, 4:59pm (AEST)
Name | Value | % Chg |
|---|---|---|
Major Indices | ||
| ASX 200 | 8,550.8 | -0.10% |
| All Ords | 8,773.6 | -0.07% |
| Small Ords | 3,227.1 | +0.46% |
| All Tech | 3,977.2 | -0.96% |
| Emerging Companies | 2,252.0 | +0.61% |
Currency | ||
| AUD/USD | 0.6528 | +0.23% |
US Futures | ||
| S&P 500 | 6,157.0 | +0.16% |
| Dow Jones | 43,362.0 | +0.13% |
| Nasdaq | 22,516.5 | +0.25% |
Name | Value | % Chg |
|---|---|---|
Sector | ||
| Health Care | 41,545.8 | +0.44% |
| Materials | 15,626.6 | +0.16% |
| Energy | 8,682.2 | +0.13% |
| Communication Services | 1,834.9 | +0.02% |
| Financials | 9,629.3 | -0.03% |
| Consumer Staples | 12,218.1 | -0.06% |
| Utilities | 9,257.1 | -0.08% |
| Consumer Discretionary | 4,109.4 | -0.12% |
| Industrials | 8,296.7 | -0.39% |
| Real Estate | 3,950.5 | -0.71% |
| Information Technology | 2,881.3 | -2.05% |
Markets
%20intraday%20chart%2026%20Jun%202025.png)
ASX 200 Session Chart
The S&P/ASX 200 (XJO) finished 8.4 points lower at 8,550.8, 0.21% from its session low and just 0.11% from its high. Despite the lacklustre finish on the benchmark, in the broader-based S&P/ASX 300 (XKO) advancers still managed to beat decliners by a modest 169 to 108.
Biotechnology shares, not a group of the market we often refer to in wraps, were the strongest across the Aussie bourse today (see Interesting Moves section below for details on specifics). This helped the Healthcare (XHJ) (+0.44%) to a modest gain, to be fair, which was also well supported by improvements in heavyweights Cochlear (COH) (+0.88%) and CSL (CSL) (+0.64%).
Resources (XJR) (+0.16%) and Energy (XEJ) (+0.13%) weren’t terrible, and in each sector there were pockets of concentrated strength. In Resources, really anything critical minerals was higher today, from antimony (Trigg Minerals (TMG) (+18.1%)) to niobium (WA1 Resources (WA1) (+7.2% )), to mineral sands (Iluka Resources (ILU) (+6.9%))... and even lithium got a guernsey (Pilbara Minerals (PLS) (+5.6% )).
In Energy, you could also argue that uranium is also critical mineral…either way, I note that Deep Yellow (DYL) (+2.1%) and Boss Energy (BOE) (2.0%) prospered.
The rest…as in everything from Financials (XFJ) (-0.03%) to Real Estate (XPJ) (-0.70%) were flat to moderately lower in what was a bit of a ho-hum day 🥱.
The Gold sub-sector (XGD) (-0.84%), as it is want to do lately, was the worst of the lot as the gold price continues to drift lower in the wake of the de-escalation of Middle East tensions.
Today’s blue chip winners:
Company | Last Price | Change $ | Change % | 1mo % | 1yr % |
|---|---|---|---|---|---|
Pilbara Minerals (PLS) | $1.315 | +$0.07 | +5.6% | -1.9% | -57.7% |
Mineral Resources (MIN) | $20.90 | +$0.72 | +3.6% | -12.0% | -61.8% |
Light & Wonder (LNW) | $145.79 | +$3.59 | +2.5% | +3.7% | -5.8% |
ANZ Group (ANZ) | $29.74 | +$0.64 | +2.2% | +2.3% | +3.8% |
South32 (S32) | $2.90 | +$0.06 | +2.1% | -6.1% | -20.3% |
IDP Education (IEL) | $3.64 | +$0.07 | +2.0% | -55.7% | -75.1% |
Viva Energy Group (VEA) | $2.11 | +$0.04 | +1.9% | +11.1% | -32.2% |
James Hardie (JHX) | $39.13 | +$0.74 | +1.9% | +9.1% | -17.5% |
Orora (ORA) | $1.860 | +$0.035 | +1.9% | -3.4% | -5.3% |
IGO (IGO) | $4.01 | +$0.07 | +1.8% | -5.2% | -29.5% |
Telix Pharmaceuticals (TLX) | $24.73 | +$0.42 | +1.7% | -5.6% | +35.3% |
Ampol (ALD) | $25.35 | +$0.43 | +1.7% | -1.6% | -21.3% |
Hub24 (HUB) | $86.64 | +$1.39 | +1.6% | +6.9% | +90.1% |
Lynas Rare Earths (LYC) | $9.20 | +$0.13 | +1.4% | +15.7% | +53.8% |
Reece (REH) | $17.36 | +$0.23 | +1.3% | +12.7% | -32.7% |
The Lottery Corp (TLC) | $5.30 | +$0.07 | +1.3% | -1.7% | +3.4% |
Orica (ORI) | $19.21 | +$0.24 | +1.3% | +2.8% | +7.8% |
Resmed Inc (RMD) | $39.97 | +$0.47 | +1.2% | +4.8% | +44.1% |
Dyno Nobel (DNL) | $2.66 | +$0.03 | +1.1% | +0.8% | -8.9% |
Ansell (ANN) | $30.31 | +$0.3 | +1.0% | -3.7% | +15.1% |
Today’s blue chip losers:
Company | Last Price | Change $ | Change % | 1mo % | 1yr % |
|---|---|---|---|---|---|
Xero (XRO) | $184.00 | -$10.21 | -5.3% | +1.7% | +38.8% |
Sigma Healthcare (SIG) | $3.01 | -$0.12 | -3.8% | -5.0% | +130.7% |
Northern Star (NST) | $18.84 | -$0.44 | -2.3% | -8.7% | +40.1% |
Life360 (360) | $30.84 | -$0.56 | -1.8% | -4.5% | +96.1% |
SGH (SGH) | $54.35 | -$0.89 | -1.6% | +8.3% | +44.7% |
Computershare (CPU) | $39.46 | -$0.57 | -1.4% | -1.7% | +48.6% |
Amcor (AMC) | $13.99 | -$0.2 | -1.4% | -0.1% | -6.0% |
Atlas Arteria (ALX) | $5.06 | -$0.07 | -1.4% | -3.6% | -0.8% |
Suncorp Group (SUN) | $21.46 | -$0.29 | -1.3% | +2.9% | +30.9% |
Insurance Australia (IAG) | $8.97 | -$0.12 | -1.3% | +2.9% | +34.3% |
Goodman Group (GMG) | $34.39 | -$0.44 | -1.3% | +5.2% | -4.2% |
Block (XYZ) | $98.78 | -$1.22 | -1.2% | +7.7% | +4.2% |
Car Group (CAR) | $36.29 | -$0.44 | -1.2% | +1.3% | +6.6% |
Lendlease Group (LLC) | $5.39 | -$0.06 | -1.1% | -6.6% | 0% |
Technology One (TNE) | $39.98 | -$0.43 | -1.1% | +2.2% | +118.9% |
Treasury Wine (TWE) | $7.76 | -$0.08 | -1.0% | -5.6% | -37.5% |
Evolution Mining (EVN) | $7.54 | -$0.07 | -0.9% | -14.2% | +113.0% |
GPT Group (GPT) | $4.95 | -$0.04 | -0.8% | +4.4% | +18.1% |
Cleanaway Waste (CWY) | $2.70 | -$0.02 | -0.7% | -0.7% | -1.8% |
QBE Insurance (QBE) | $23.33 | -$0.15 | -0.6% | -1.8% | +32.8% |
ChartWatch
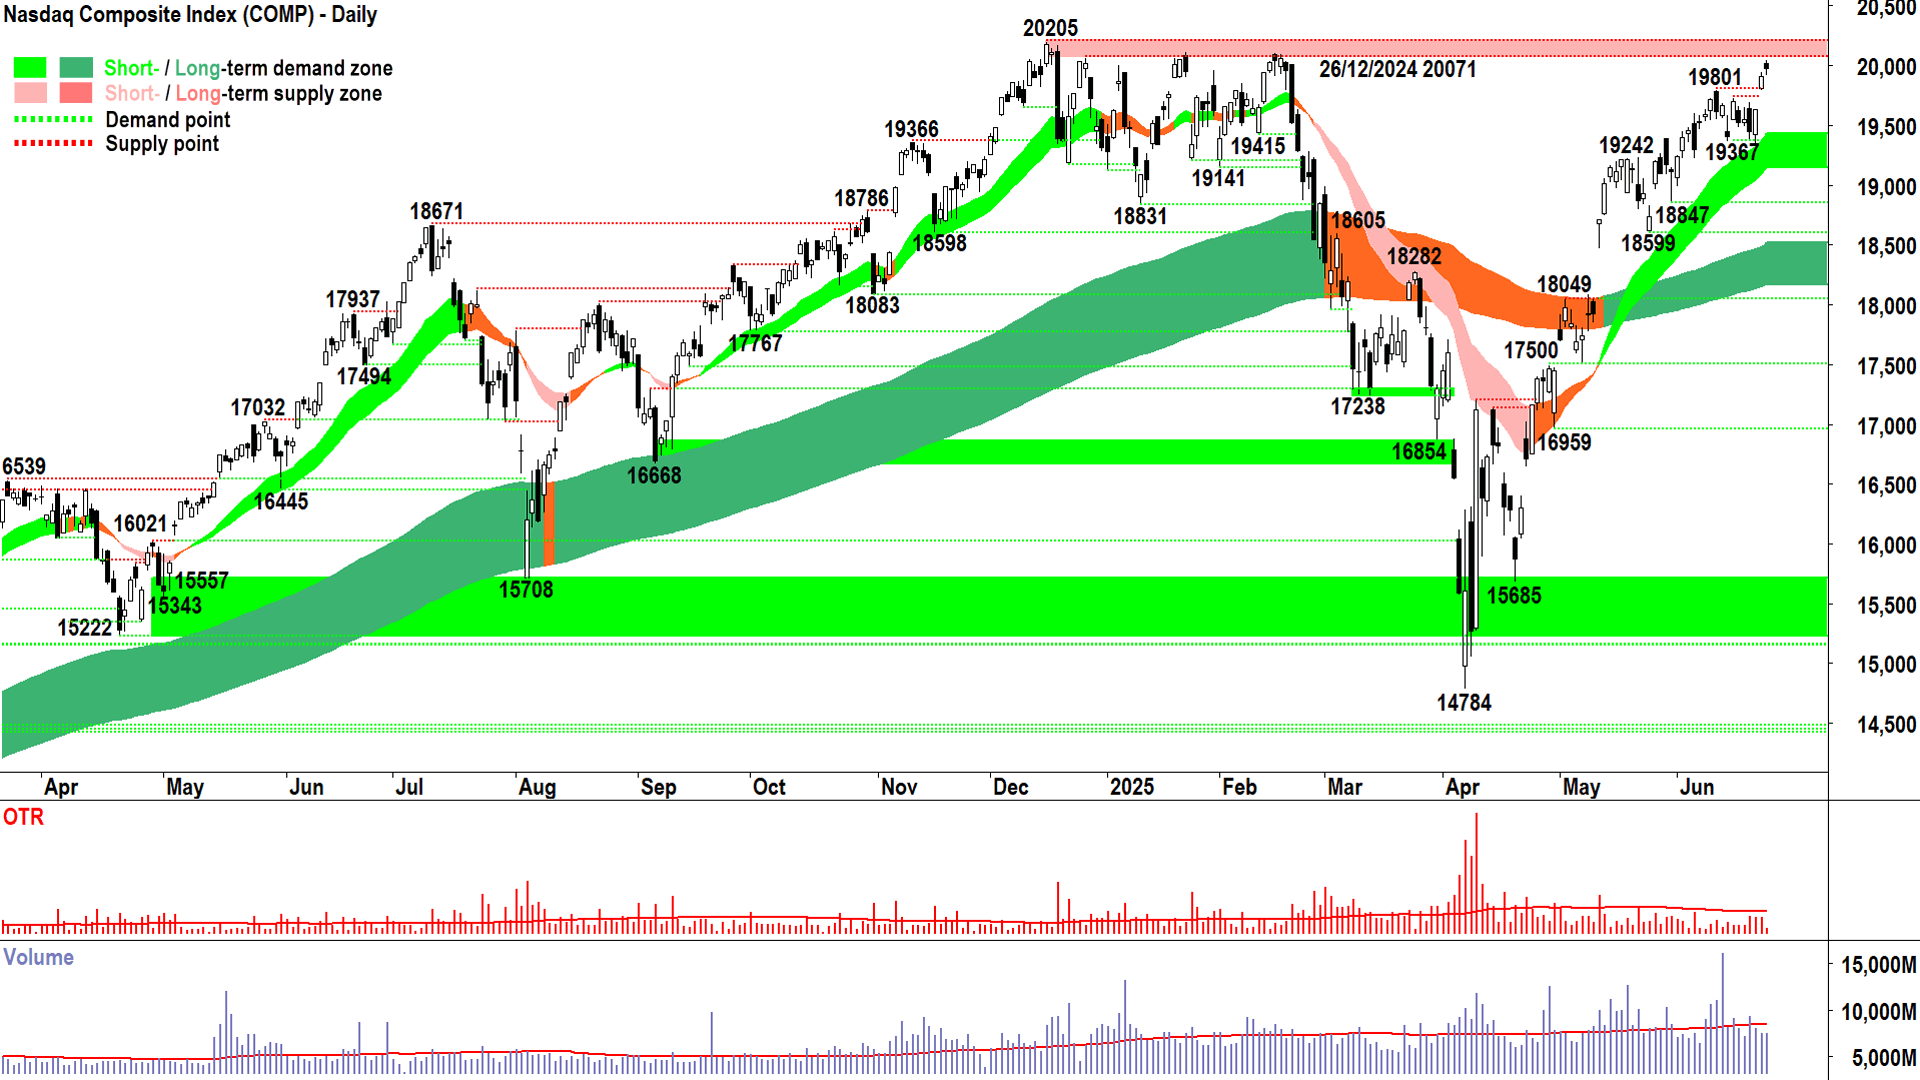
NASDAQ Composite Index

To the next MOTN call! ♻️ (click here for full size image)
Blast straight through 20205
Spend some time probing the supply at 20205 then:
Blast through
Move steadily through
Fail / be repelled by
Be repelled by 20205
Let’s call that the "Outcome Matrix" for what happens next on the Comp 🤓.
My tip? I’m going with either "2.1" or "2.2".
But that’s a guess. A guess based on the fact all of the technical signs indicate strong demand-side control:
Rising trend ribbons
Trend ribbons acting as dynamic demand zones
Price action is rising peaks and rising troughs price action (i.e., equals supply removal and demand reinforcement)
Predominance of demand-side candles (i.e., white-bodied and or downward pointing shadows equals buy the dip / accumulation).
But it's a guess, nonetheless. I can’t tell the future. The good news is that I stopped worrying about the outcome of my calls a long time ago.
This is because every time I make a call, I ensure that it’s on the right side of more often than not (‘MOTN’). Then I just let the outcome happen, and most importantly, I accept the consequences of that outcome and move on…
To the next MOTN call! ♻️
Knowing all the time that if I can let my profits run, and cut my losses short, MOTN is all I’ll ever need.
Why am I doing all the philosophical stuff today? 🤔
Because there’s not a great deal to say about the above Comp chart. We know where supply is (20071-20205), we know where demand is (19335-bottom of the short term uptrend ribbon, presently 19140).
The Comp is going to break through one or the other. We know which one we think it will be first…hence no change to the prevailing FRP view here…
S&P/ASX 200 (XJO)
%20chart%2026%20Jun%202025.png)
All is quiet on the home front 😴 (click here for full size image)
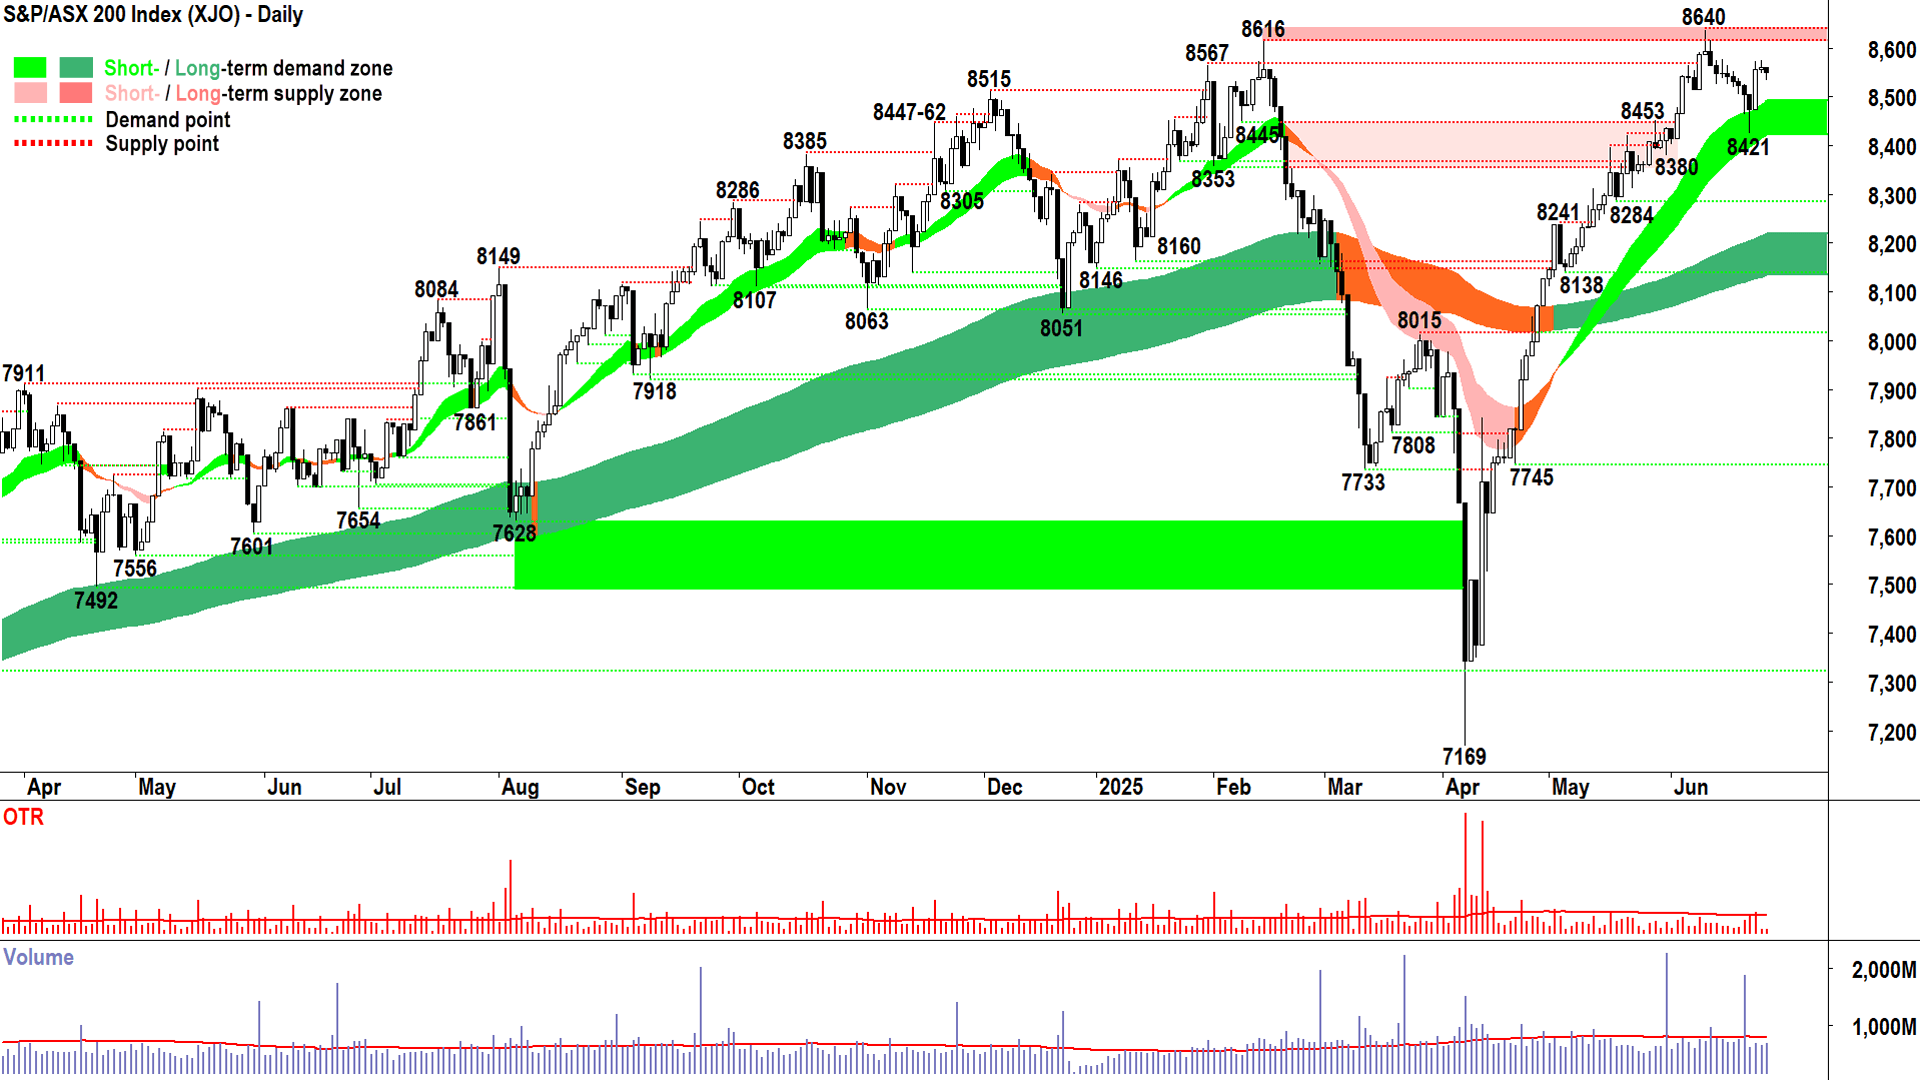
Move along…there’s nothing to see here…
A perfectly understandable and totally expected candle today. It’s the type of candle you get when you’re in a strong uptrend but you don’t have an obvious catalyst to push substantially higher at the moment.
Maybe even, there’s one or two very minor negative leads around...
And that’s the result: A small downward volatility session 🤏.
Strong uptrends are defined by large and larger up-volatility days (#FOMO + #YOLO) and small and smaller down-volatility days (because there is little motivated supply that’s bashing up against pervasive buy the dip activity).
Today's price action is consistent with a continuing strong uptrend.
So, in conclusion, I have a similar feeling on the XJO as on the Comp. We’re a little stuck in the middle here – between the 8616-8640 supply zone above – and the short term uptrend ribbon / next point of demand at 8421 below.
More broadly, though, demand-side indications remain intact. So, we stay the course until we see a reason to think otherwise (large supply-side candles = long black-bodies and or long upward pointing shadows, and or a lower peak / lower trough = supply reinforcement or demand removal).
US Dollar Index Futures (Front month, back-adjusted) ICE
%20ICE%20chart%2026%20Jun%202025.png)
Uncle Sam's buck is looking a little sickly...🤒 (click here for full size image)
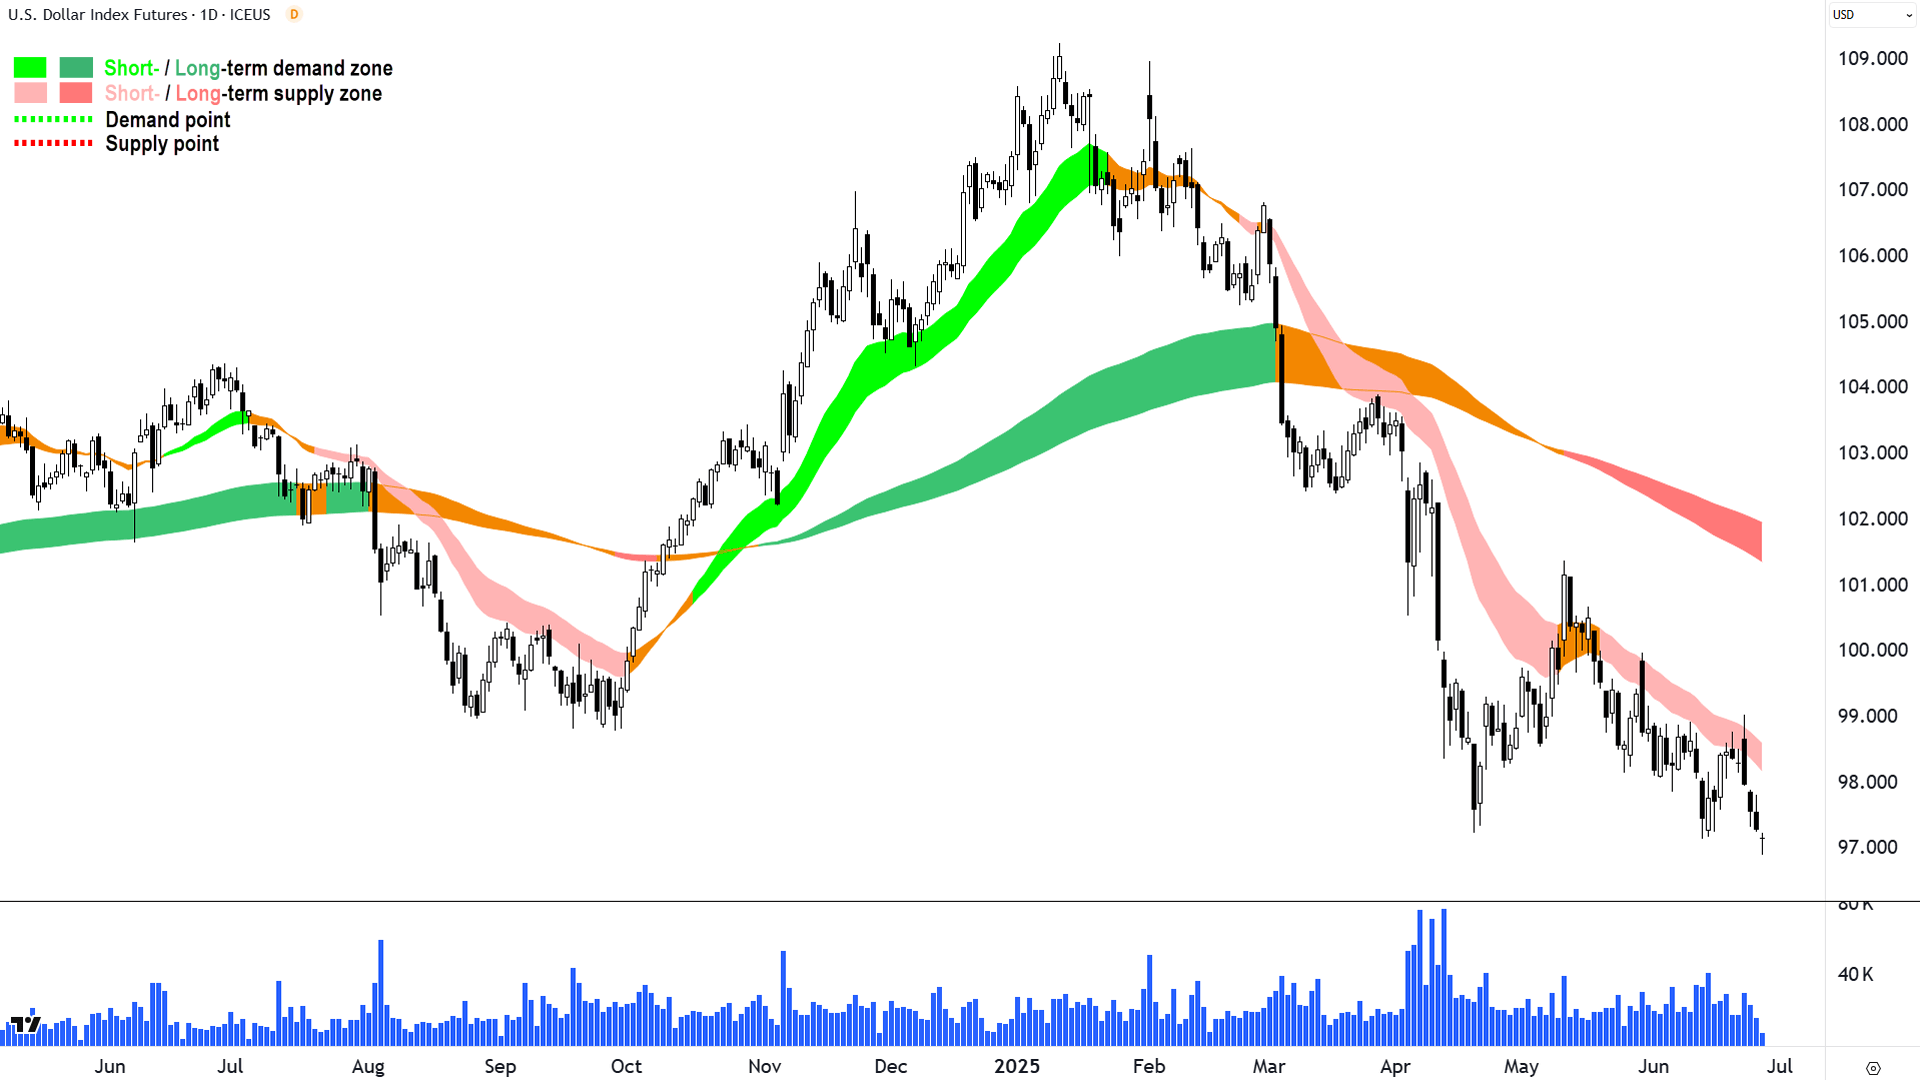
I wrote a whole article on the potential causes and ramifications of a weaker US dollar here, it's worth reading next time your sitting down for an extended period in a confined space 🚽 (don't say you don't 😁!).
If the chart above was a stock, what would you be looking to do with it…long or short?
Well, if you’re a trend follower like me, then there’s really only one MOTN option! Short 📉.
But it’s not a stock. It’s the US dollar versus six other major global currencies. Uncle Sam’s buck is looking a little sickly 🤒.
In theory, this should be beneficial for the likes of “hard” assets like precious and base metals, but usually also energy and agricultural commodities, and cryptocurrencies like Bitcoin. Basically, anything that’s benchmark priced in US dollars.
It’s a pretty strong trend as far as our ChartWatch model assumes…so while it remains in place, it’s worth looking for charts of potential beneficiaries. But, in my experience, the correlations are moderate at best, and can take time to play out – often with some roughness around the edges.
So, I suggest using above chart as a big blunt macroeconomic tool rather than a trade spotting scalpel.
Economy
Today
There weren't any major data releases in our time zone today
Later this week
Thursday
22:30 USA Final GDP March (-0.2% p.a. forecast vs +2.4% p.a. in December)
22:30 USA Core Durable Goods Orders May (+0.1% m/m forecast vs +0.2% m/m in April)
Friday
22:30 USA Core Personal Consumption Expenditures (PCE) May
Price Index: +0.1% m/m forecast vs +0.1% m/m in April
Personal Income: +0.2% m/m forecast vs +0.8% m/m in April
Personal Spending: +0.2% m/m forecast vs +0.2% m/m in April
Latest News
Interesting Movers
Trading higher
+42.9% Locate Technologies (LOC) – Response to ASX Price Query ("We have no idea!"), rise is consistent with prevailing short and long term uptrends 🔎📈
+18.1% Trigg Minerals (TMG) – No news since 25-Jun Appointment of Ex US Chief of Staff Armaments & Ammunition, general strength across the broader Critical Minerals sector today, rise is consistent with prevailing short and long term uptrends, a regular in ChartWatch ASX Scans Uptrends list 🔎📈
+14.4% Clarity Pharmaceuticals (CU6) – No news 🤔, general strength across the broader Biotechnology sector today.
+11.8% Dateline Resources (DTR) – Amended Dateline Commences Colosseum Geophysical Survey.
+11.7% Droneshield (DRO) – Continued positive response to 25-Jun $61.6m European military contract, rise is consistent with prevailing short and long term uptrends, a regular in ChartWatch ASX Scans Uptrends list 🔎📈
+11.4% Amplia Therapeutics (ATX) – Continued positive response to 19-Jun Second Complete Response in ACCENT Pancreatic Cancer Trial, rise is consistent with prevailing short term uptrend and long term trend is transitioning from down to up 🔎📈
+10.5% Orthocell (OCC) – No news, general strength across the broader Biotechnology sector today.
+9.1% Green Critical Minerals (GCM) – No news, general strength across the broader Critical Minerals sector today, rise is consistent with prevailing short and long term uptrends, a regular in ChartWatch ASX Scans Uptrends list 🔎📈
+9.1% Bubs Australia (BUB) – No news, rise is consistent with prevailing short term uptrend and long term trend is transitioning from down to up, a regular in ChartWatch ASX Scans Uptrends list 🔎📈
+8.6% Botanix Pharmaceuticals (BOT) – No news, general strength across the broader Biotechnology sector today.
+8.3% Coronado Global Resources (CRN) – No news 🤔.
+7.9% Larvotto Resources (LRV) – No news 🤔.
+7.2% WA1 Resources (WA1) – No news, general strength across the broader Critical Minerals sector today, rise is consistent with prevailing short and long term uptrends 🔎📈
+6.9% Iluka Resources (ILU) – No news, general strength across the broader Critical Minerals sector today.
+6.5% Healius (HLS) – Becoming a substantial holder from MUFG.
+6.3% Dimerix (DXB) – No news, general strength across the broader Biotechnology sector today, rise is consistent with prevailing short and long term uptrends 🔎📈
+6.2% Cettire (CTT) – No news 🤔.
+6.1% Neuren Pharmaceuticals (NEU) – US patent allowed for NNZ-2591 to treat Pitt Hopkins, general strength across the broader Biotechnology sector today.
+6.1% Arafura Rare Earths (ARU) – No news, general strength across the broader Critical Minerals sector today.
+5.6% Pilbara Minerals (PLS) – Becoming a substantial holder, general strength across the broader Critical Minerals sector today, (Vanguard Group +5.26%).
Trading lower
-9.1% Bannerman Energy (BMN) – Successful A$85.0M Placement Completed.
-7.1% MTM Critical Metals (MTM) – Proposed issue of securities and Placement.
-6.9% Alligator Energy (AGE) – Continued negative response to 23-Jun Successful $17M Institutional Placement.
-6.5% Meeka Metals (MEK) – Continued negative response to 19-Jun $60m Institutional Placement to Drive Next Phase of Growth.
-5.3% Xero (XRO) – Xero successfully completes A$1.85bn Institutional Placement (also several broker notes in response today, generally positive, see Broker Moves section below for more details).
Broker Moves
The A2 Milk Company (A2M)
Retained at hold at Bell Potter; Price Target: $7.85
Audinate Group (AD8)
Retained at overweight at Morgan Stanley; Price Target: $11.00
Retained at neutral at UBS; Price Target: $10.85
Aristocrat Leisure (ALL)
Retained at buy at UBS; Price Target: $72.40
Amcor (AMC)
Retained at outperform at Macquarie; Price Target: $18.35 from $18.16
Austin Engineering (ANG)
Retained at buy at Bell Potter; Price Target: $0.600 from $0.850
ANZ Group (ANZ)
Retained at hold at Ord Minnett; Price Target: $27.50
ARB Corporation (ARB)
Upgraded to buy from hold at Jefferies; Price Target: $36.00 from $34.50
Austal (ASB)
Retained at neutral at Citi; Price Target: $6.10 from $4.09
Aurizon (AZJ)
Retained at neutral at Citi; Price Target: $3.40
Retained at sector perform at RBC Capital Markets; Price Target: $3.20
Bluescope Steel (BSL)
Retained at neutral at Citi; Price Target: $25.00 from $26.50
Bubs Australia (BUB)
Retained at buy at Shaw and Partners; Price Target: $0.200
Commonwealth Bank of Australia (CBA)
Retained at sell at Ord Minnett; Price Target: $105.00
Collins Foods (CKF)
Retained at buy at UBS; Price Target: $9.75 from $9.20
Droneshield (DRO)
Retained at buy at Bell Potter; Price Target: $2.60 from $1.500
Downgraded to hold from buy at Shaw and Partners; Price Target: $2.00 from $1.200
Endeavour Group (EDV)
Retained at neutral at UBS; Price Target: $4.25
Greatland Gold (GGP)
Initiated at neutral at Citi; Price Target: $8.00
GQG Partners (GQG)
Retained at buy at UBS; Price Target: $2.80
Healthco Healthcare and Wellness Reit (HCW)
Retained at buy at Bell Potter; Price Target: $1.150 from $1.300
Humm Group (HUM)
Retained at hold at Shaw and Partners; Price Target: $0.900
Light & Wonder (LNW)
Retained at buy at Citi; Price Target: $193.00
Retained at buy at UBS; Price Target: $195.00
Medibank Private (MPL)
Retained at neutral at Macquarie; Price Target: $4.25
National Australia Bank (NAB)
Retained at lighten at Ord Minnett; Price Target: $33.00
NIB (NHF)
Retained at underperform at Macquarie; Price Target: $5.55
Northern Star Resources (NST)
Retained at buy at Citi; Price Target: $22.50
Nextdc (NXT)
Retained at outperform at Macquarie; Price Target: $22.10 from $21.20
Paragon Care (PGC)
Retained at buy at Bell Potter; Price Target: $0.520
Perenti (PRN)
Retained at buy at Citi; Price Target: $1.900
SRG Global (SRG)
Retained at buy at Shaw and Partners; Price Target: $1.800 from $1.600
Tasmea (TEA)
Retained at buy at Morgans; Price Target: $4.35 from $3.80
Retained at buy at Shaw and Partners; Price Target: $4.10 from $3.00
The Lottery Corporation (TLC)
Retained at buy at UBS; Price Target: $6.20
Treasury Wine Estates (TWE)
Retained at buy at Morgans; Price Target: $10.25 from $11.06
Westpac Banking Corporation (WBC)
Retained at lighten at Ord Minnett; Price Target: $27.00
Xero (XRO)
Retained at buy at Citi; Price Target: $210.00
Retained at buy at Goldman Sachs; Price Target: $205.00
Retained at hold at Jefferies; Price Target: $176.90 from $194.80
Retained at outperform at Macquarie; Price Target: $204.00
Retained at overweight at Morgan Stanley; Price Target: $225.00
Retained at accumulate at Ord Minnett; Price Target: $200.00
Retained at outperform at RBC Capital Markets; Price Target: $230.00 from $210.00
Retained at buy at UBS; Price Target: $215.00
Retained at overweight at Wilsons; Price Target: $217.26 from $213.26
Scans
Top Gainers
Code | Company | Last | % Chg |
|---|---|---|---|
| PFM | Platformo Ltd | $0.085 | +80.85% |
| LKY | Locksley Resources Ltd | $0.088 | +51.72% |
| LOC | Locate Technologies Ltd | $0.25 | +42.86% |
| OPL | Opyl Ltd | $0.027 | +42.11% |
| PV1 | Provaris Energy Ltd | $0.017 | +41.67% |
Top Fallers
Code | Company | Last | % Chg |
|---|---|---|---|
| TML | Timah Resources Ltd | $0.024 | -31.43% |
| TGH | Terragen Holdings Ltd | $0.018 | -18.18% |
| NSB | Neuroscientific Biopharmaceuticals Ltd | $0.074 | -17.78% |
| NHE | Noble Helium Ltd | $0.026 | -16.13% |
| D3E | D3 Energy Ltd | $0.11 | -15.39% |
52 Week Highs
Code | Company | Last | % Chg |
|---|---|---|---|
| LOC | Locate Technologies Ltd | $0.25 | +42.86% |
| VRX | VRX Silica Ltd | $0.086 | +22.86% |
| CDE | Codeifai Ltd | $0.07 | +22.81% |
| TMG | Trigg Minerals Ltd | $0.098 | +18.07% |
| PUA | Peak Minerals Ltd | $0.026 | +13.04% |
52 Week Lows
Code | Company | Last | % Chg |
|---|---|---|---|
| TML | Timah Resources Ltd | $0.024 | -31.43% |
| CPV | Clearvue Technologies Ltd | $0.115 | -14.82% |
| KLI | Killi Resources Ltd | $0.021 | -12.50% |
| BBC | BNK Banking Corporation Ltd | $0.25 | -12.28% |
| PRS | Prospech Ltd | $0.015 | -11.77% |
Near Highs
Code | Company | Last | % Chg |
|---|---|---|---|
| OZBD | Betashares Australian Composite Bond ETF | $45.51 | -0.04% |
| WVOL | Ishares MSCI World Ex Aust Minimum Volatility ETF | $43.79 | -0.95% |
| MTS | Metcash Ltd | $3.97 | 0.00% |
| CHN | Chalice Mining Ltd | $1.645 | +3.14% |
| AII | Almonty Industries Inc | $3.95 | +11.27% |
Relative Strength Index (RSI) Oversold
Code | Company | Last | % Chg |
|---|---|---|---|
| KMD | KMD Brands Ltd | $0.245 | -3.92% |
| DGL | DGL Group Ltd | $0.36 | 0.00% |
| AX1 | Accent Group Ltd | $1.365 | +0.37% |
| AVH | Avita Medical Inc | $1.485 | -3.57% |
| DMP | Domino's PIZZA Enterprises Ltd | $19.30 | -1.63% |
