News | Market Wraps
Evening Wrap: ASX 200 rally continues as markets bet Trump's worst behind us (it is...right?)

Mentioned
The S&P/ASX 200 closed 28.9 points higher, up 0.36%.
Another day of gains for the Australian stock market – its third in a row – and at today's opening high of 8051, the benchmark ASX 200 had rallied an impressive 882 points or 12.3% from its 7 April low of 7169.
No mean feat, particularly given the uncertainties that still remain with respect to the global economy and the simmering trade war. But, plenty of damage remains, namely the 600-odd points we still require to get back to our Valentine's Day high.
For today, though, gains were largely concentrated in the Energy (+1.6%), Information Technology (+1.4%), and Consumer Discretionary (+1.3%) sectors – three of the hardest hit during the recent correction. There weren't many weak spots, but it was another tough day for Gold (-1.5%), which dragged on the broader Resources (-0.35%) sector.
To make sense of all the above, I have detailed technical analysis on the Nasdaq Composite, S&P/ASX 200, and Uranium in today's ChartWatch.
Be sure to click/scroll through for the usual reporting of the major sector and stock-specific moves, the broker responses to them, as well as all the key upcoming economic data in tonight's Evening Wrap.
Let's dive in!
Today in Review
Mon 28 Apr 25, 5:20pm (AEST)
Name | Value | % Chg |
|---|---|---|
Major Indices | ||
| ASX 200 | 7,997.1 | +0.36% |
| All Ords | 8,203.9 | +0.35% |
| Small Ords | 2,991.7 | -0.14% |
| All Tech | 3,441.8 | +1.26% |
| Emerging Companies | 2,204.9 | +0.07% |
Currency | ||
| AUD/USD | 0.64 | 0.00% |
US Futures | ||
| S&P 500 | 5,538.75 | -0.20% |
| Dow Jones | 40,193.0 | -0.15% |
| Nasdaq | 19,497.25 | -0.19% |
Name | Value | % Chg |
|---|---|---|
Sector | ||
| Energy | 7,188.0 | +1.59% |
| Information Technology | 2,331.4 | +1.42% |
| Consumer Discretionary | 3,913.2 | +1.32% |
| Utilities | 9,162.4 | +1.13% |
| Health Care | 40,607.0 | +0.94% |
| Communication Services | 1,712.4 | +0.87% |
| Consumer Staples | 12,312.1 | +0.59% |
| Real Estate | 3,592.5 | +0.39% |
| Financials | 8,642.0 | +0.26% |
| Industrials | 7,809.1 | +0.02% |
| Materials | 15,927.6 | -0.59% |
Markets
%20intraday%20chart%2028%20April%202025.png)
ASX 200 Session Chart
The S&P/ASX 200 (XJO) finished 28.9 points higher at 7,997.1, 0.68% from its session high and just 0.36% from its low. Despite the session-long pullback from the opening high, in the broader-based S&P/ASX 300 (XKO), advancers still managed to beat decliners by a healthy 181 to 88.
The bond market has won! President Trump was schooled in its importance, was therefore forced into watering down his trade policies and into distancing himself from comments regarding the sacking the Chairman of the Federal Reserve, and he shall never mess with the bond market again. Crisis averted.
Right? 🤔
Markets appear to be telling us this. There seems to be a growing belief that President Trump will be unable to do any major damage to the US and world economies because he's realised markets might break if he does. Or at least his minders have set alerts on their iPhones to remind him of this every few hours 📱.
There's a feedback loop of policy/comment action – market reaction – dumbing down of policy/comment reaction.

US 10-Year treasury bonds – the US bond market has retreated from the ledge...🪂 (click here for full size image)
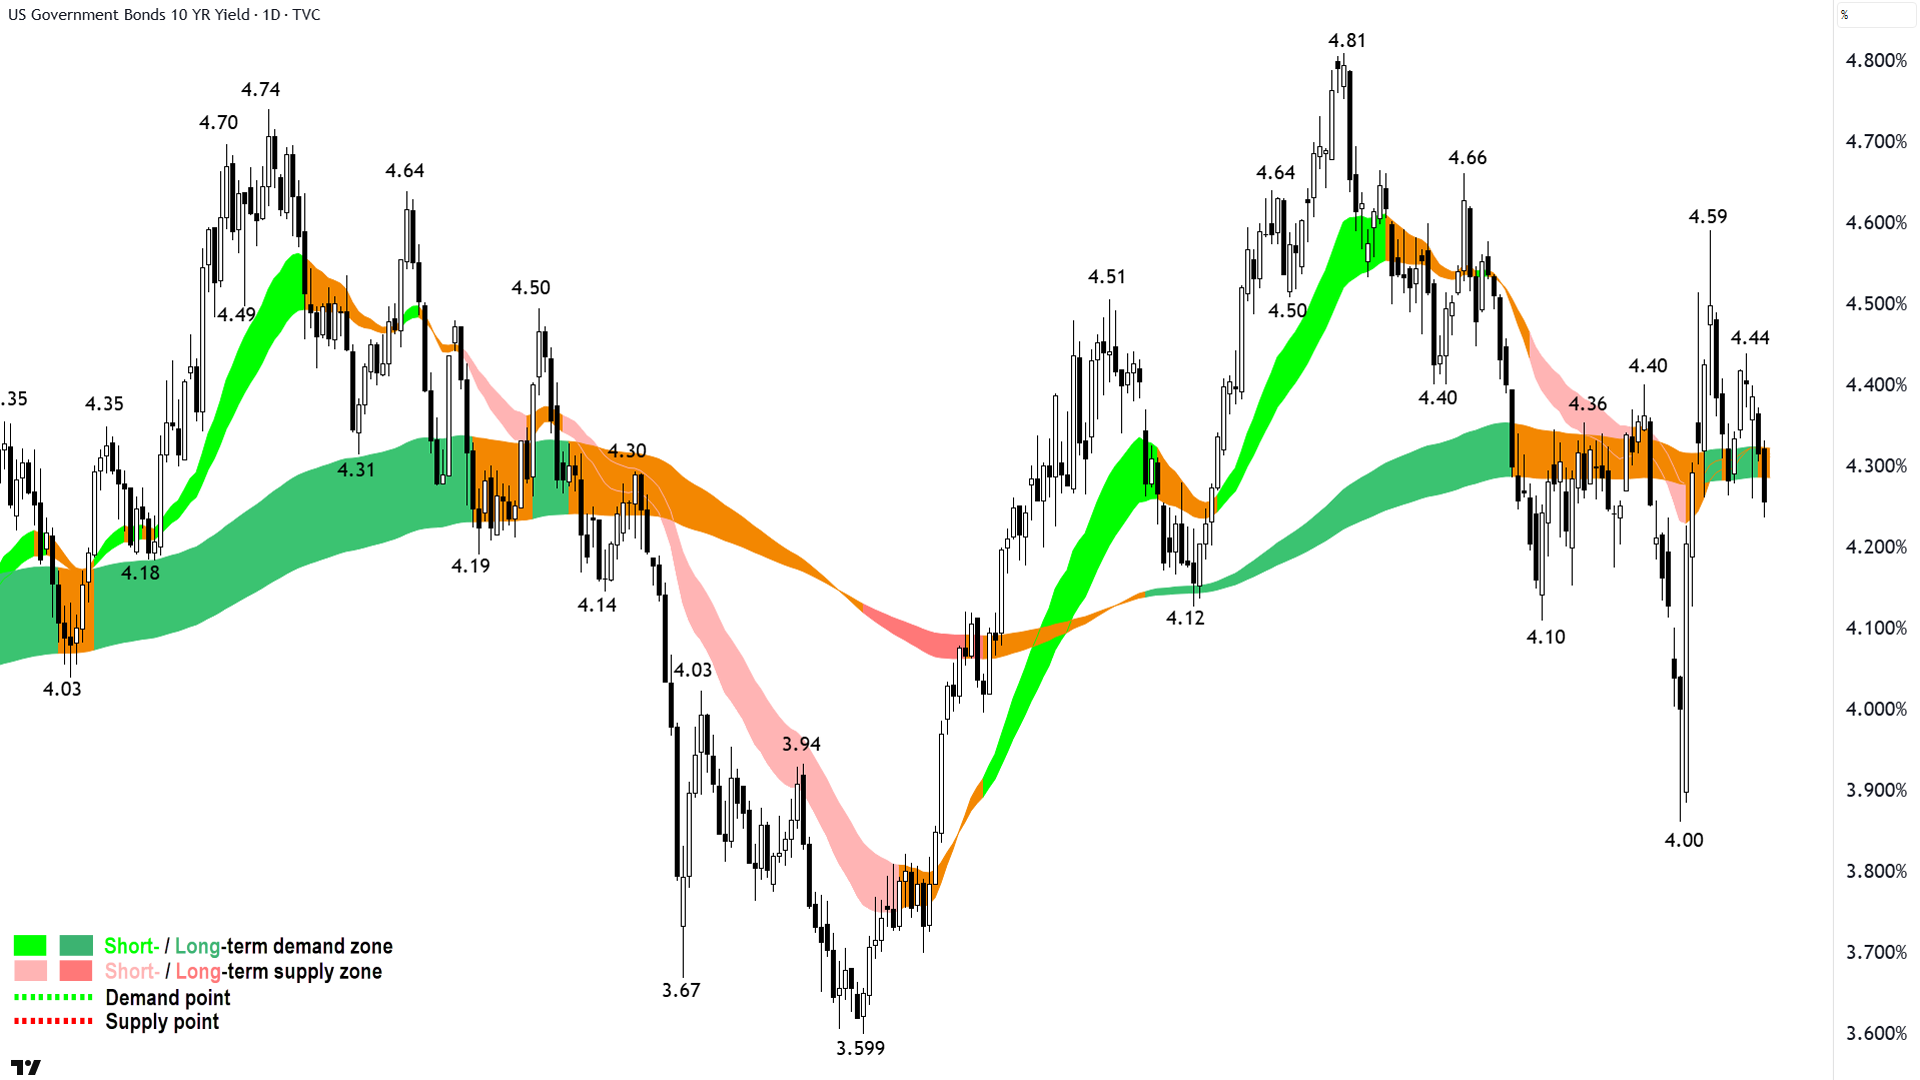
The US bond market has retreated from the ledge, the US dollar (dumped by all and sundry) has steadied a bit, and stocks have rallied.
No, we're not back at all time highs yet, because the market hasn't completely discounted all of the risks the new normal poses to global economic growth, and therefore to stock earnings. Judging roughly by where major stock indices have rallied to, it's priced out about half. So, the glass is half full, right? 🤔
I've posed only questions so far, I will let you scroll a little further to the charts where I feebly attempt to provide you with some answers!
ChartWatch
NASDAQ Composite Index

We must do our very best to think and feel as little as possible! (click here for full size image)
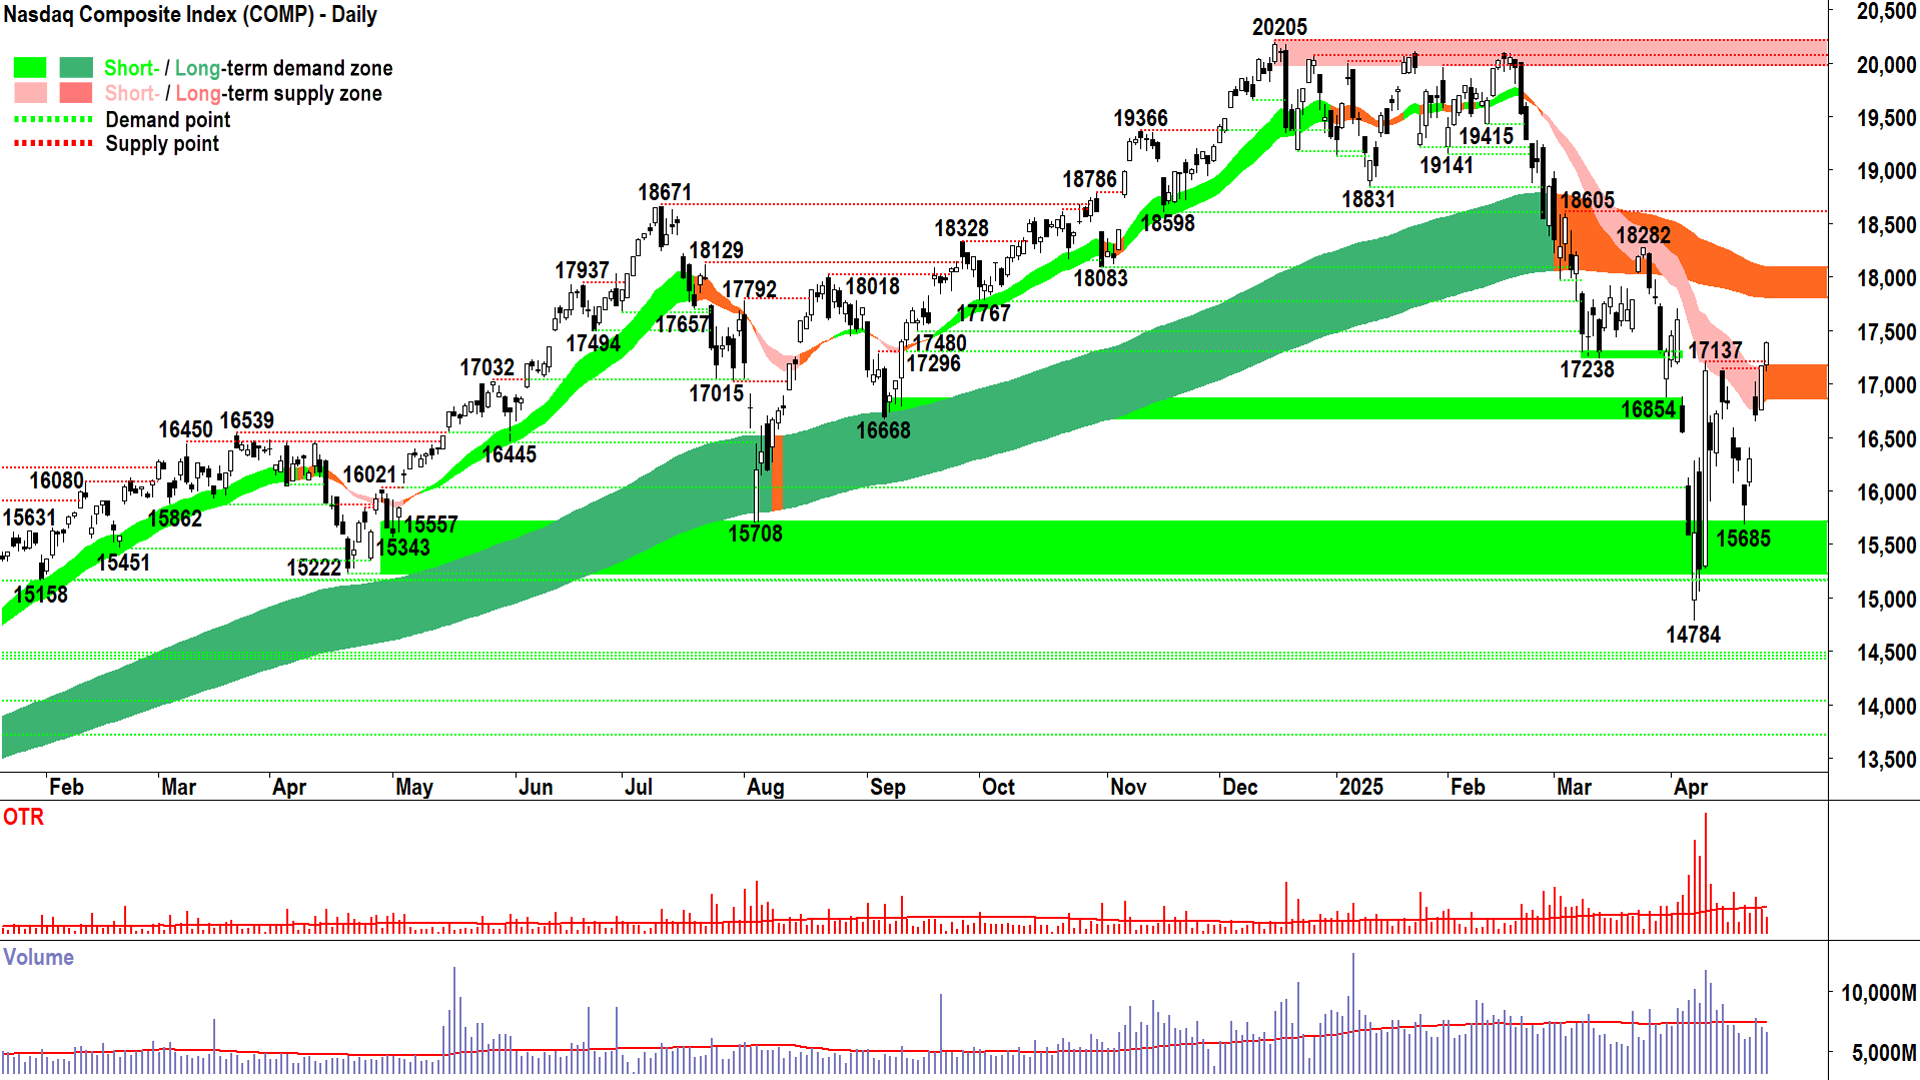
Two rather than the usual one candle since our last update – and 2 x very credible demand-side showings (i.e., very nearly 2 x full white bodies).
More importantly, those full white bodies have pushed through the dynamic supply of the short term downtrend ribbon (now neutralised).
The close above the short term trend ribbon is an early signal the short term downtrend is over, rather, that we are now in a state of equilibrium in the short term. This is consistent with the long term trend ribbon and its present indication of equilibrium.
So, here we are – in a state of equilibrium in terms of the price action. Officially neutral.
Personally, I still favour running at maximum conservatism with respect to my US-based investments – preferring to only begin to normalise risk after a close above-then retest-and hold of the long term trend ribbon.
Others who are more convinced we’re out of the woods could conceivably move towards a more balanced 50-50 approach in a measured way.
I have to admit that this is a far quicker recovery than I had expected – but my expectations are based upon the last 14-odd corrections and 7 bear markets. Each of those was typically caused by a bunch of major macroeconomic events that coalesced sometimes quickly and sometimes slowly, to cause markets to realise in a commensurate fashion that we were all stuffed!
I can’t recall a single one of those corrections or bear markets caused by on individual – or more specifically, one individual who tanked markets by saying something that significantly and instantly increased risk – and then changed his mind within a few days and forced markets to reprice most of that bad stuff not happening – just as instantly.
So, yeah, I’m going with the excuse of this time’s a bit different! 🤦
But, if technicals actually mean anything in a Trump 2.0 world, then one must concede that the Comp has logged a very credible reversal. I can see:
2 x powerful V-shaped rallies (remember: V-shaped are the most credible!) ✅
Rising troughs with good separation indicating growing demand, and based on Friday’s close – now also rising peaks, indicating supply removal. ✅
Growing predominance of demand-side candles. ✅
Close above the short term trend ribbon and the fact we’re not far from the long term trend ribbon. ✅
Volume and volatility at the major trough low indicate a potential blowoff of supply / short covering into a credible long term demand-side take-up. ✅
So, to say we’re anything less than neutral – is far too conservative.
Make no mistake: We just witnessed the sort of bear market reversal that’s consistent with seeding a bull market.
Anyways, as encouraging as that would normally be for all of us – I don’t expect many of us yet believe we’re completely out of the woods – because of the nature of the main driver of market risk at the moment...You know who I’m talking about 😁!
Yet, this thinking with our heads, and probably more so, with our hearts. We shouldn’t use either when investing – or more specifically when we’re investing using trend following (you can do it any way you prefer!).
The price action doesn’t care about what our head or our heart thinks/feels. We are irrelevant because we (unlike some) are unable to impact risk or the pricing of risk.
So, we must do our very best to think and feel as little as possible when it comes to conducting our analysis – and let the price action guide us.
S&P/ASX 200 (XJO)
%20chart%2024%20April%202025.png)
An interesting chart (click here for full size image)
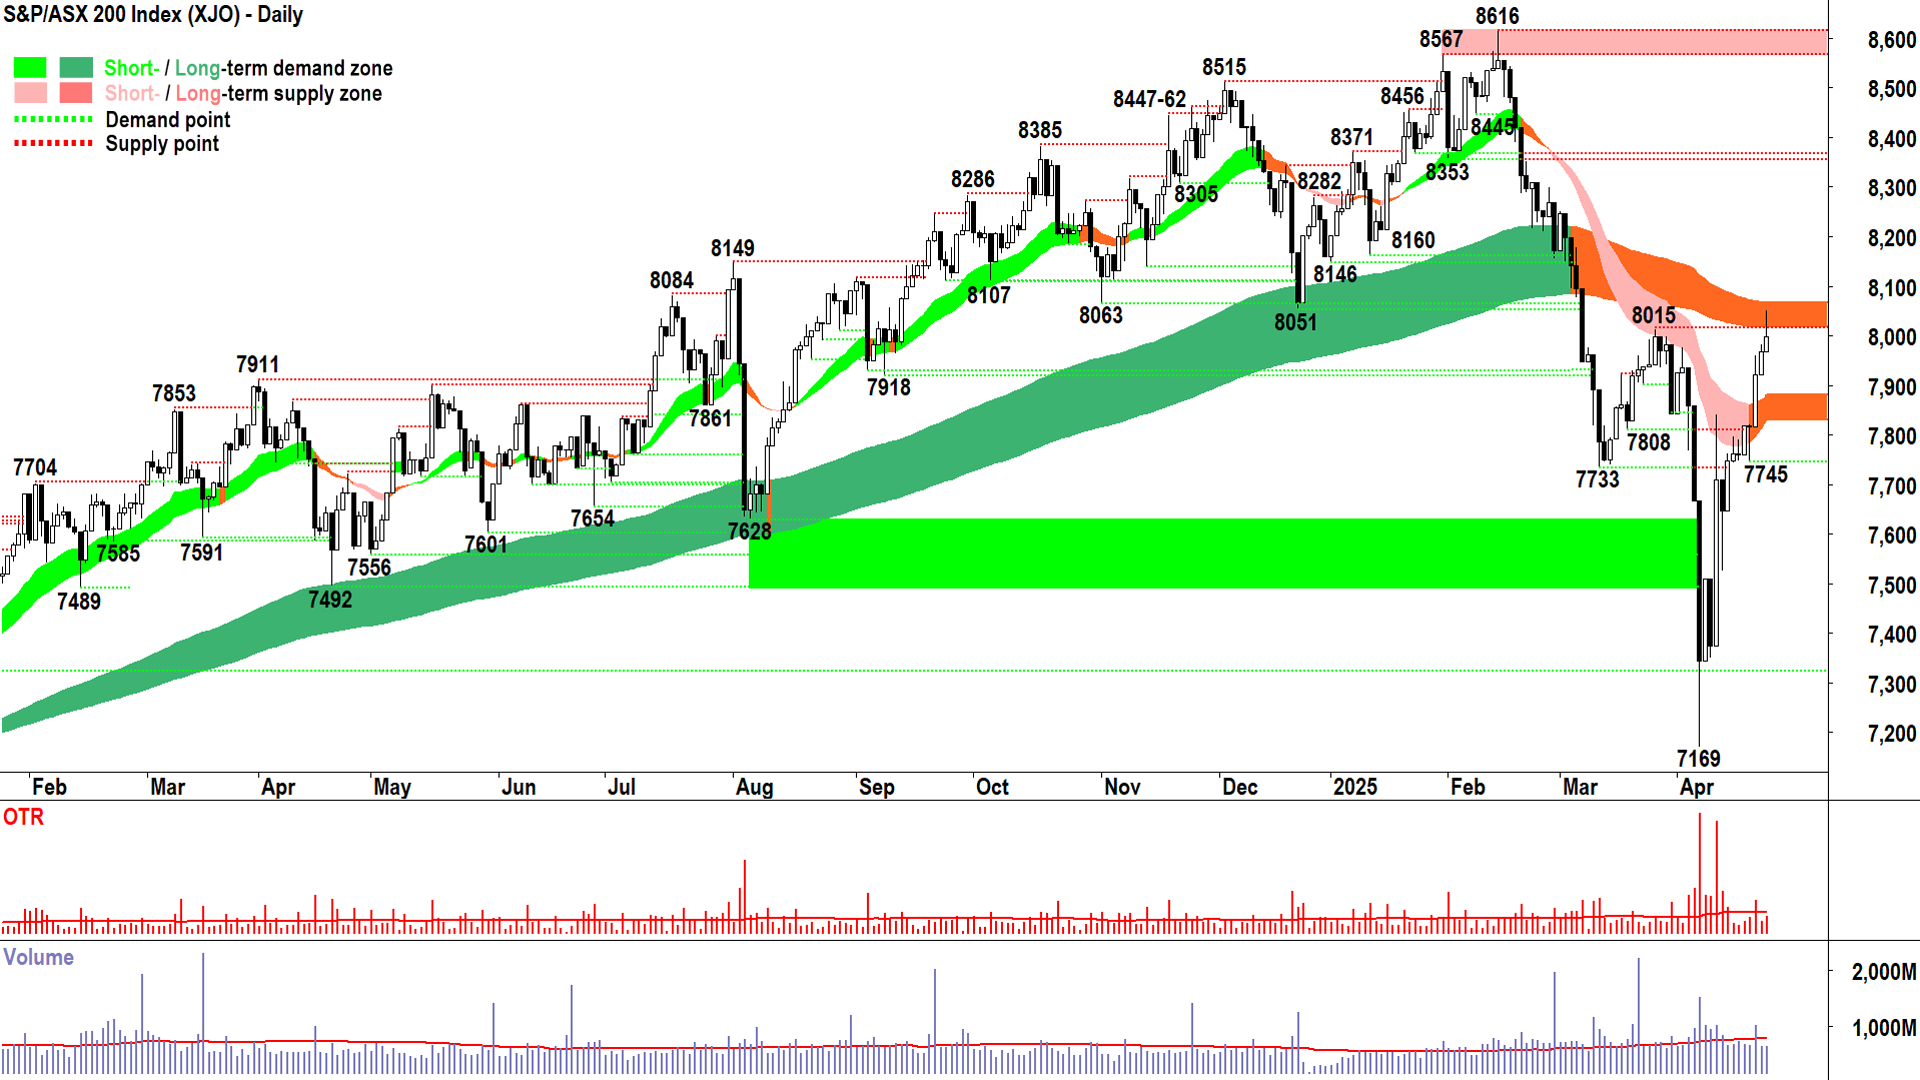
Remember how we did that little pause at the short term trend ribbon?
It looks like we’re doing something similar at the long term trend ribbon. Today’s upward pointing shadow deep into the long term trend ribbon tells us something that you won’t get from the headlines in every other market wrap…about X-days in a row up…or up so many points from the low…
Nope, today’s price action was ultimately controlled by the supply-side. It was about selling the rally, not FOMOing into it.
Still, we cannot discount those other factors. Yes, it has been a very good rally from the 7169 low and the analysis we did here around the short term trend ribbon – highlighting the strength shown there in the face of some very poor leads from US markets – was spot on.
Today’s price action – given it has occurred at the long term trend ribbon – under ordinary circumstances suggests at least a pause in the current rally. A pause to allow some profits to be taken by the demand-side, and for the next wave of demand to grow more comfortable that the next move is to new highs and not to new lows.
Just as much, a pause here – a strong hold of the recent rally – will help convince the supply-side to realise they’re better off holding on for the next high rather than taking advantage of now-elevated price to escape a new low.
So, that’s the key now. A mild a pullback (if at all) as possible. A strong showing the demand-side sits ready to soak up whatever supply may still have doubts after the rally – and just as much to show there isn’t much supply around anyway.
This means as few strong supply-side candles as possible (i.e., black bodied and or upward pointing shadows), and preferably still a regular showing of demand-side candles (i.e., white bodied and or downward pointing shadows), even if there isn’t a great deal of progress in terns of price.
A higher trough to 7169, punctuated with strong demand-side candles, would also be welcome.
All of this builds to the final important signal that the correction is over: A close above the long term trend ribbon, followed by a test and hold of it. It could happen in the next four or five candles.
Demand is now the short term trend ribbon, kicking in around 7880, but I think it likely also extends down to the bottom of the two-demand-candle pattern from 17 & 22 April at 7745. Those two candles will go down as two of the most important in this whole saga!
As I said mild supply-side candles aren’t a major issue above there – but I would pay close attention to the big ones. If we start to see too many of those…it means trouble! ⚠️
Uranium Futures (Front month, back-adjusted) COMEX
%20COMEX%20chart%2025%20April%202025.png)
Green shoots 🌱 (click here for full size image)
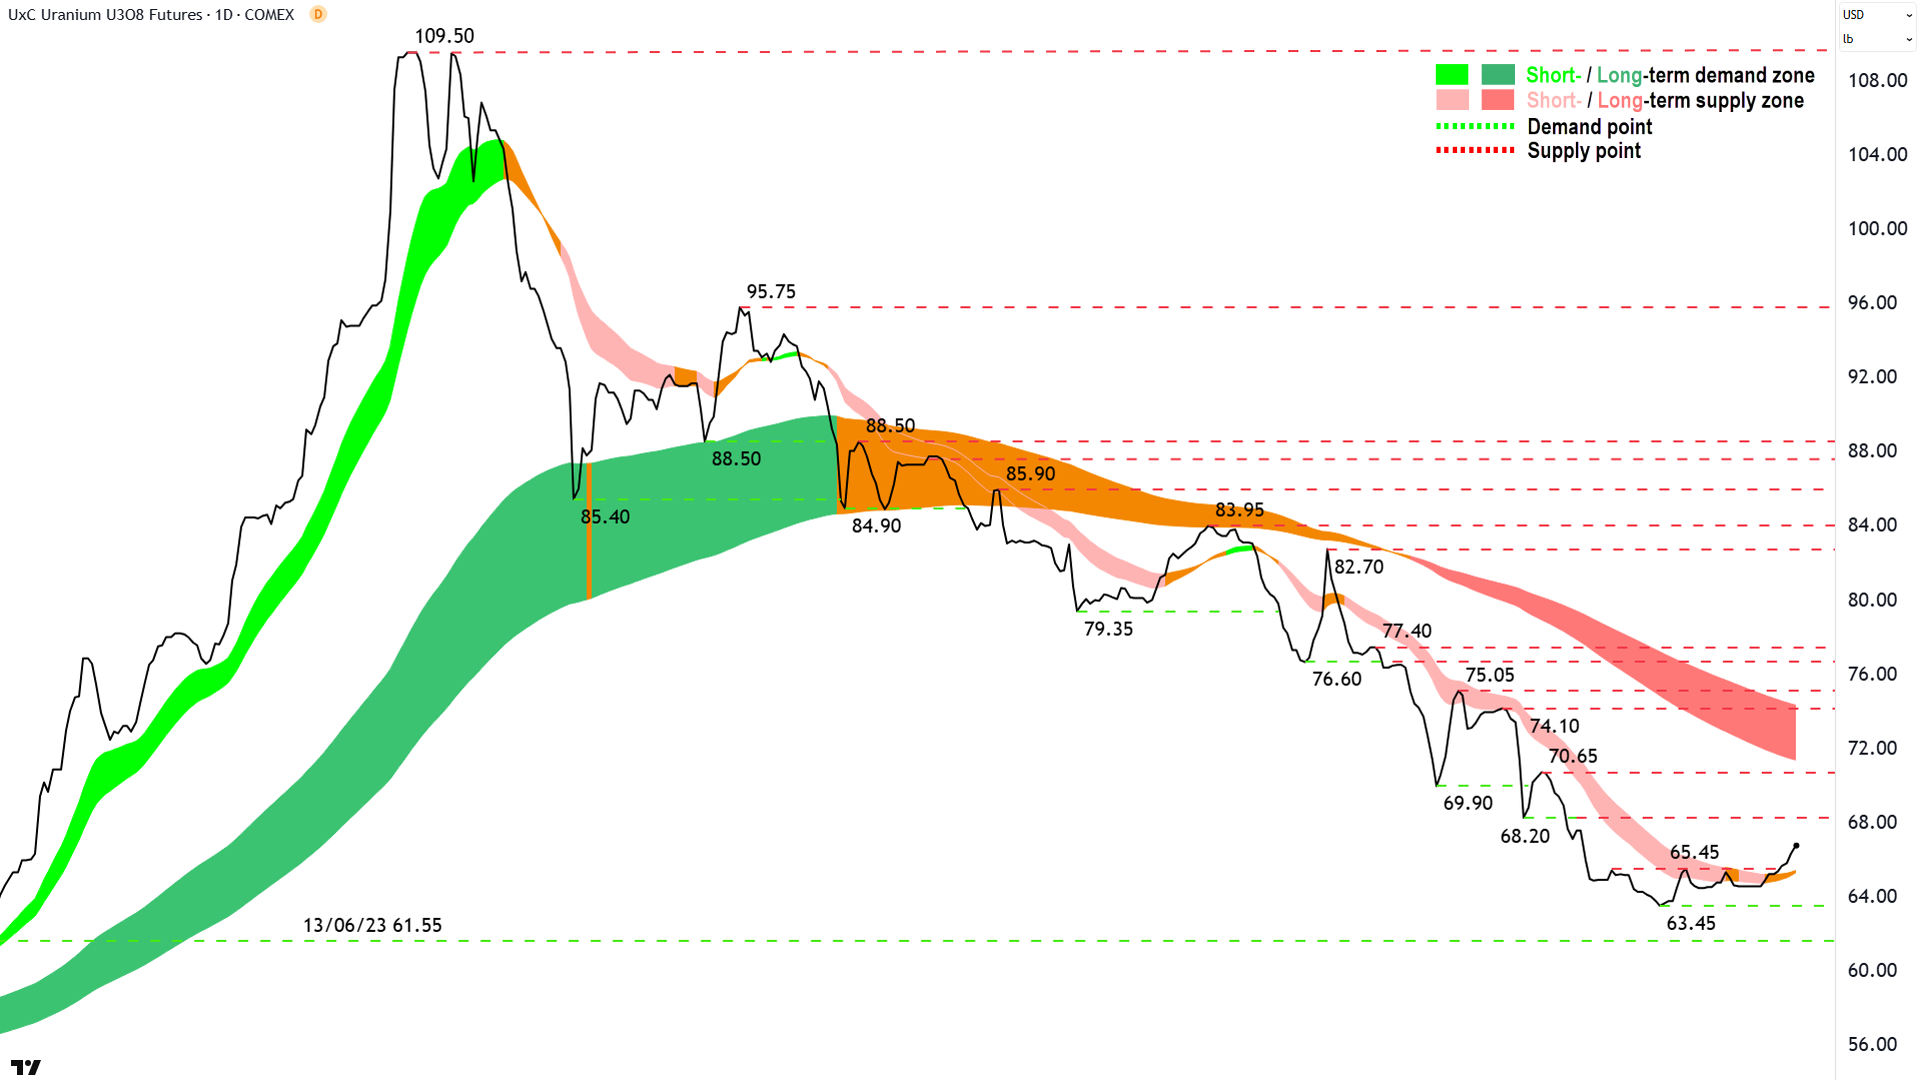
The last time we covered Uranium was in ChartWatch in the Evening Wrap on 17 April.
In that update, I brought to your attention a looming Easter miracle – the fact that the uranium futures price had closed above its short term downtrend ribbon for the first time since November last year.
Well, it’s well above that short term trend ribbon now, which has neutralised mind you – and we’re also observing rising peaks and rising toughs.
The short term downtrend in uranium is over. I’d even go so far as to say that a new short term uptrend has begun – or it will be confirmed as such upon one of these two occurrences:
A trough is formed above the short term trend ribbon = ✅ Short term uptrend; or
The short term uptrend ribbon turns green = ✅ Short term uptrend
There's plenty to cheer here for uranium bulls, especially considering the price action and trends looked so bad before this last rally I was pretty sure it was headed lower. But, (and here comes the bad news) – based on the long term downtrend ribbon – it's clearly far too early to call the bear market over just yet.
But a win is a win! 🤞
(Hey, last few Wraps you would have noticed ASX uranium stocks on a tear because Sprott Inc. has been buying the dip. I'm not saying for one second the turn in the uranium chart pointed out here a couple of weeks ago was a reason for them to do take that course of action (you'd have to ask them what their reasons are!), simply that the uranium chart led the move in equities. Given Sprott's influence in the markets of both the commodity and its associated equities, perhaps though, this is not a great surprise!)
Economy
Today
There weren't any major data releases in our time zone today
Later this week
Tuesday
22:00 USA JOLTS Job Openings March (7.48 million forecast vs 7.57 million previous)
22:00 USA Conference Board Consumer Confidence April (87.4 forecast to 92.9 previous)
Wednesday
09:30 Consumer Price Index (CPI) March Quarter (+0.8% q/q and +2.3% p.a. forecast vs +0.2% q/q and +2.4% p.a. previous)
09:30 Consumer Price Index (CPI) Trimmed Mean March Quarter (+0.6% q/q and +2.8% p.a. forecast vs +0.5% q/q and +3.2% p.a. previous)
09:30 CHN Manufacturing & Non-Manufacturing Purchasing Managers Index (PMI) April
Manufacturing: 49.8 forecast vs 50.5 in March
Non-Manufacturing: 50.7 forecast vs 51.2 in March
20:15 USA Advance GDP March y/y (+0.4% p.a. vs +2.4% p.a.)
22:00 USA Core Personal Consumption Expenditures (PCE) Price Index March (+0.1% m/m and +2.6% p.a. vs +0.4% m/m and +2.8% p.a. in February)
Personal Income m/m: +0.4% forecast vs +0.% in February
Personal Spending m/m: +0.6% forecast vs +0.4% in February
Thursday
ALL DAY CHN May Day Bank Holiday
TBA JPN Bank of Japan (BOJ) Policy Rate, Monetary Policy Statement, Outlook Report & Press Conference
22:00 USA ISM Manufacturing PMI April (48.0 forecast vs 49.0 in March)
Friday
ALL DAY CHN May Day Bank Holiday
09:30 Retail Sales m/m March (+0.4% forecast and +0.2% in February)
20:30 Non-Farm Employment Data April
Employment Change m/m: +129,000 forecast vs +228,000 in March
Average Hourly Earnings m/m: +0.3% forecast vs +0.3% in March
Unemployment Rate: 4.2% forecast vs 4.2% in March
Saturday
ALL DAY AUS Parliamentary Elections (forecast 🤔???)
Latest News
Interesting Movers
Trading higher
+31.1% Ainsworth Game Technology (AGI) – AGI enters into Binding Scheme Implementation Deed and Annual Report -Year Ended 31 December 2024.
+14.3% 4DS Memory (4DS) – imec shipment of Sixth Platform Lot.
+9.1% Global X Ultra Long Nasdaq-100 Hedge Fund ETF (LNAS) – No news, long Nasdaq ETF.
+8.5% Orthocell (OCC) – Remplir Approved to Commence Sales in US$84M Thai Market.
+8.0% Andean Silver (ASL) – No news.
+6.8% Energy One (EOL) – No news, rise is consistent with prevailing short and long term uptrends, a regular in ChartWatch ASX Scans Uptrends list 🔎📈
+6.1% Webjet (WJL) – No news, general strength across the broader Consumer Discretionary sector today.
+6.0% BetaShares Geared US Equity Fund Currency Hedged ETF (GGUS) – No news, long US equities ETF.
+5.6% Brainchip (BRN) – No news, general strength across the broader Information Technology sector today, continues to benefit from expected changes to Trump semiconductor policy.
+5.5% Dimerix (DXB) – FDA confirms Proteinuria as Primary Endpoint for US approval, rise is consistent with prevailing long term uptrend 🔎📈
+5.3% Resolute Mining (RSG) – No news, rise is consistent with prevailing short term uptrend and long term trend is transitioning from down to up 🔎📈
+5.2% Iluka Resources (ILU) – No news, general strength across the broader Rare Earths & Critical Minerals sector today, continues to benefit from expected changes to Trump semiconductor policy.
+5.1% Arafura Rare Earths (ARU) – No news, general strength across the broader Rare Earths & Critical Minerals sector today, continues to benefit from expected changes to Trump semiconductor policy.
+4.8% Austal (ASB) – No news, rise is consistent with prevailing short and long term uptrends, a regular in ChartWatch ASX Scans Uptrends list 🔎📈
+4.6% Global X Fang+ ETF (FANG) – No news, long US equities ETF.
Trading lower
-11.2% Bravura Solutions (BVS) – CEO Change.
-10.8% Pantoro (PNR) – Quarterly Activities/Appendix 5B Cash Flow Report.
-8.9% Global X Ultra Short Nasdaq-100 Hedge Fund ETF (SNAS) – No news, short Nasdaq ETF.
-8.3% Clarity Pharmaceuticals (CU6) – No news, fall is consistent with prevailing short and long term downtrends, a regular in ChartWatch ASX Scans Downtrends list 🔎📉
-6.8% BetaShares US EQY Strong Bear - CH ETF (BBUS) – No news, short US equities ETF.
-6.6% Telix Pharmaceuticals (TLX) – Telix Provides Regulatory Update on TLX101-CDx.
-6.0% Lifestyle Communities (LIC) – No news, fall is consistent with prevailing short and long term downtrends, a regular in ChartWatch ASX Scans Downtrends list 🔎📉
-5.3% Koonenberry Gold (KNB) – Shareholder request for meeting.
-5.2% St Barbara (SBM) – No news, general weakness across the broader Gold sector today.
-5.0% Brambles (BXB) – Brambles FY25 Third Quarter Trading Update.
-4.9% Firefly Metals (FFM) – No news, general weakness across the broader Resources sector today, fall is consistent with prevailing short term downtrend and long term trend is transitioning from up to down, a regular in ChartWatch ASX Scans Downtrends list 🔎📉
-4.8% Ausgold (AUC) – Quarterly Activities/Appendix 5B Cash Flow Report.
-4.4% Liontown Resources (LTR) – No news, downgraded to sell from hold at Canaccord Genuity (but there were several other updates today, see Broker Moves for details), fall is consistent with prevailing short and long term downtrends, a regular in ChartWatch ASX Scans Downtrends list 🔎📉
-3.9% Regis Resources (RRL) - No news, general weakness across the broader Gold sector today.
Broker Moves
Australian Clinical Labs (ACL)
Retained at neutral at Macquarie; Price Target: $3.15
ANZ Group (ANZ)
Upgraded to neutral from sell at Citi; Price Target: $27.50 from $25.25
Downgraded to hold from buy at Jefferies; Price Target: $26.44 from $31.50
Bendigo and Adelaide Bank (BEN)
Downgraded to underperform from hold at Jefferies; Price Target: $8.28 from $11.00
Bannerman Energy (BMN)
Retained at buy at Canaccord Genuity; Price Target: $3.74 from $4.08
Bank of Queensland (BOQ)
Retained at underperform at Jefferies; Price Target: $5.64 from $4.00
Bluescope Steel (BSL)
Retained at buy at Citi; Price Target: $26.50
Commonwealth Bank of Australia (CBA)
Retained at sell at Citi; Price Target: $100.00 from $90.75
Retained at underperform at Jefferies; Price Target: $133.75 from $88.00
Champion Iron (CIA)
Retained at buy at Euroz Hartleys; Price Target: $7.80 from $9.50
Coles Group (COL)
Retained at buy at UBS; Price Target: $23.50 from $22.35
Cettire (CTT)
Retained at hold at Bell Potter; Price Target: $0.475 from $1.250
Cygnus Metals (CY5)
Retained at buy at Euroz Hartleys; Price Target: $0.220 from $0.200
Endeavour Group (EDV)
Retained at buy at UBS; Price Target: $4.50 from $5.00
Emmerson Resources (ERM)
Retained at buy at Euroz Hartleys; Price Target: $0.250 from $0.200
Generation Development Group (GDG)
Retained at overweight at Morgan Stanley; Price Target: $5.65 from $6.30
Gold Road Resources (GOR)
Retained at buy at Euroz Hartleys; Price Target: $3.58 from $3.10
Healius (HLS)
Retained at neutral at Macquarie; Price Target: $1.400
Insurance Australia Group (IAG)
Retained at outperform at Macquarie; Price Target: $8.50
Integral Diagnostics (IDX)
Retained at outperform at Macquarie; Price Target: $3.20
Iluka Resources (ILU)
Retained at outperform at Macquarie; Price Target: $6.50
Imdex (IMD)
Retained at neutral at Citi; Price Target: $2.85
Judo Capital (JDO)
Retained at buy at Jefferies; Price Target: $2.36 from $2.30
Liontown Resources (LTR)
Retained at buy at Bell Potter; Price Target: $0.900
Downgraded to sell from hold at Canaccord Genuity; Price Target: $0.500
Retained at neutral at Citi; Price Target: $0.500
Retained at neutral at E&P; Price Target: $0.700
Retained at neutral at Goldman Sachs; Price Target: $0.630 from $0.640
Retained at underweight at JP Morgan; Price Target: $0.300
Retained at neutral at Macquarie; Price Target: $0.650
Macquarie Group (MQG)
Retained at sell at Citi; Price Target: $177.00
Monash IVF Group (MVF)
Retained at outperform at Macquarie; Price Target: $1.600 from $1.650
National Australia Bank (NAB)
Retained at sell at Citi; Price Target: $30.50 from $26.50
Upgraded to buy from underperform at Jefferies; Price Target: $37.39 from $27.00
Newmont Corporation (NEM)
Retained at buy at Citi; Price Target: $95.00
Retained at outperform at Macquarie; Price Target: $94.00 from $95.00
Retained at add at Morgans; Price Target: $97.00 from $84.00
Oneview Healthcare (ONE)
Retained at buy at Bell Potter; Price Target: $0.450
Predictive Discovery (PDI)
Retained at buy at Euroz Hartleys; Price Target: $0.550
Paladin Energy (PDN)
Retained at buy at Bell Potter; Price Target: $6.50 from $6.30
QBE Insurance Group (QBE)
Retained at outperform at Macquarie; Price Target: $23.00
REA Group (REA)
Retained at buy at Bell Potter; Price Target: $264.00
Regis Healthcare (REG)
Retained at buy at Canaccord Genuity; Price Target: $1.000
Resmed Inc (RMD)
Retained at outperform at Macquarie; Price Target: $48.00 from $48.80
Retained at overweight at Morgan Stanley; Price Target: US$280
Retained at add at Morgans; Price Target: $44.07 from $43.60
Upgraded to buy from accumulate at Ord Minnett; Price Target: $45.60 from $44.80
Resolute Mining (RSG)
Retained at outperform at Macquarie; Price Target: $0.550
Rox Resources (RXL)
Retained at buy at Canaccord Genuity; Price Target: $0.610
Steadfast Group (SDF)
Retained at outperform at Macquarie; Price Target: $6.80
Seek (SEK)
Retained at buy at Bell Potter; Price Target: $25.80 from $27.00
Sheffield Resources (SFX)
Retained at hold at Ord Minnett; Price Target: $0.200 from $0.190
Santos (STO)
Retained at overweight at Morgan Stanley; Price Target: $6.92
Suncorp Group (SUN)
Retained at neutral at Macquarie; Price Target: $19.20
Westpac Banking Corporation (WBC)
Retained at sell at Citi; Price Target: $27.75 from $26.25
Upgraded to hold from underperform at Jefferies; Price Target: $28.34 from $20.00
Woodside Energy Group (WDS)
Retained at hold at Ord Minnett; Price Target: $27.00 from $26.50
Woolworths Group (WOW)
Retained at neutral at UBS; Price Target: $31.50 from $30.50
Scans
Top Gainers
Code | Company | Last | % Chg |
|---|---|---|---|
| AGI | Ainsworth Game Technology Ltd | $0.97 | +31.08% |
| JLL | Jindalee Lithium Ltd | $0.34 | +30.77% |
| MBK | Metal Bank Ltd | $0.013 | +30.00% |
| INF | Infinity Lithium Corporation Ltd | $0.025 | +25.00% |
| KLI | Killi Resources Ltd | $0.05 | +25.00% |
Top Fallers
Code | Company | Last | % Chg |
|---|---|---|---|
| HCF | H&G High Conviction Ltd | $0.35 | -53.95% |
| CGO | CPT Global Ltd | $0.049 | -34.67% |
| BRX | Belararox Ltd | $0.092 | -31.85% |
| PEB | Pacific Edge Ltd | $0.075 | -31.82% |
| CMB | Cambium Bio Ltd | $0.225 | -22.41% |
52 Week Highs
Code | Company | Last | % Chg |
|---|---|---|---|
| BGD | Barton Gold Holdings Ltd | $0.52 | +9.47% |
| WA8 | Warriedar Resources Ltd | $0.087 | +8.75% |
| EOL | Energy One Ltd | $12.70 | +6.81% |
| NMR | Native Mineral Resources Holdings Ltd | $0.165 | +6.45% |
| ZEO | Zeotech Ltd | $0.083 | +5.06% |
52 Week Lows
Code | Company | Last | % Chg |
|---|---|---|---|
| HCF | H&G High Conviction Ltd | $0.35 | -53.95% |
| CGO | CPT Global Ltd | $0.049 | -34.67% |
| CMB | Cambium Bio Ltd | $0.225 | -22.41% |
| EXL | Elixinol Wellness Ltd | $0.022 | -21.43% |
| I88 | Infini Resources Ltd | $0.105 | -16.00% |
Near Highs
Code | Company | Last | % Chg |
|---|---|---|---|
| BILL | Ishares Core Cash ETF | $100.74 | +0.05% |
| MTO | Motorcycle Holdings Ltd | $2.17 | +0.93% |
| AGI | Ainsworth Game Technology Ltd | $0.97 | +31.08% |
| AYUPA | Australian Unity Ltd | $83.50 | +1.83% |
| MVA | Vaneck Australian Property ETF | $23.23 | +0.09% |
Relative Strength Index (RSI) Oversold
Code | Company | Last | % Chg |
|---|---|---|---|
| RDY | Readytech Holdings Ltd | $2.17 | -0.91% |
| NWSLV | News Corporation | $41.80 | 0.00% |
| CRN | Coronado Global Resources Inc | $0.22 | -2.22% |
| HMC | HMC Capital Ltd | $4.68 | +0.21% |
| PIQ | Proteomics International Laboratories Ltd | $0.38 | -2.56% |
