
The ASX 200 surged to a two-month high as the US and Iran announced an interim deal to end hostilities and reopen the Strait of Hormuz, sending oil to a three-month low and triggering the Gold Sub-Index's fifteenth biggest single-day gain on record. It seems for every winner there must be a loser at the moment, as oil and gas and coal stocks sagged under the weight of lower energy commodity prices.
Be sure to click/scroll through for the usual reporting of the major sector and stock-specific moves, the broker responses to them, as well as all the key economic data in tonight's Evening Wrap. Also, I have detailed technical analysis on the Nasdaq Composite and the S&P/ASX 200 in today's ChartWatch.
Let’s dive in!
Today in Review
Name | Value | % Chg |
|---|---|---|
Major Indices | ||
| ASX 200 | 8,914.0 | +1.25% |
| All Ords | 9,128.0 | +1.35% |
| Small Ords | 3,550.7 | +2.54% |
| All Tech | 2,963.7 | +0.73% |
| Emerging Companies | 3,055.9 | +3.65% |
Currency | ||
| AUD/USD | 0.7073 | +0.39% |
US Futures | ||
| S&P 500 | 7,527.0 | +1.24% |
| Dow Jones | 52,113.0 | +0.98% |
| Nasdaq | 30,249.75 | +1.98% |
Name | Value | % Chg |
|---|---|---|
Sector | ||
| Materials | 25,681.7 | +4.06% |
| Real Estate | 3,765.1 | +1.49% |
| Financials | 9,190.3 | +1.12% |
| Information Technology | 1,841.0 | +1.05% |
| Industrials | 8,492.9 | +0.39% |
| Consumer Discretionary | 3,814.2 | +0.13% |
| Health Care | 23,999.6 | -0.01% |
| Consumer Staples | 12,820.4 | -0.78% |
| Communication Services | 1,645.1 | -1.20% |
| Utilities | 9,852.0 | -1.79% |
| Energy | 9,976.6 | -5.58% |
ASX 200 Intraday Chart
%20intraday%20chart_15%20Jun.png)
Markets
The S&P/ASX 200 (XJO) finished 110.0 points higher at 8,914.0, 1.3% from its session low and 0.3% from its high. In the broader-based S&P/ASX 300 (XKO) advancers beat decliners by a convincing margin for the second session in a row, this time by 210 to 82.
%20chart_15%20Jun.png)
Gold Sub-Index (XGD) chart
The Gold Sub-Index (XGD) (+9.1%) delivered a session that will be remembered for some time — its 15th biggest gain on record and its largest in more than five years, staged against the backdrop of a 23% plunge across the prior 20 trading sessions.
The turnaround captures everything about how gold works in this kind of environment. As the oil price eased sharply on Middle East de-escalation, inflation expectations fell in lockstep, dragging benchmark bond yields lower.
Gold stocks benefit twice from this dynamic: lower yields reduce the opportunity cost of holding a zero-income asset, while lower crude oil prices substantially reduce diesel costs — one of gold mining's largest input expenses. Revenue up, costs down, in a single session.
COMEX gold futures gained 2.1% to US$4,330/oz and COMEX silver futures surged 3.3% to US$70.20/oz. Ora Banda Mining (OBM) (+16.3%), Vault Minerals (VAU) (+14.7%), Regis Resources (RRL) (+13.3%), Evolution Mining (EVN) (+10.0%), Northern Star Resources (NST) (+7.9%), and Newmont (NEM) (+6.8%) all surged.
Materials (XMJ) (+4.1%) delivered its biggest single-day gain in 14 months as falling benchmark bond yields — driven by the collapse in crude's inflation premium — released a handbrake on global growth expectations. A weaker US dollar, which typically follows lower yields, provided additional tailwind: most commodities are priced in US dollars, so a weaker greenback makes them cheaper for non-US buyers.
COMEX copper futures gained 1.1% to US$6.52/lb and SGX iron ore futures added 0.8% to US$102.2/t. Base metals specialists surged — Capstone Copper (CSC) (+10.5%), Sandfire Resources (SFR) (+5.2%), and Nickel Industries (NIC) (+5.2%) led the pack. Critical minerals stocks also rallied — Iluka Resources (ILU) (+5.2%) was the standout. BHP (BHP) (+3.6%) hit a fresh all-time high of $65.18, with Rio Tinto (RIO) (+2.7%) also advancing.
Uranium stocks logged their first meaningful gains in four sessions, snapping a bruising losing streak. Deep Yellow (DYL) (+12.7%), Bannerman Energy (BMN) (+10.5%), Boss Energy (BOE) (+8.5%), Silex Systems (SLX) (+8.4%), and Paladin Energy (PDN) (+7.7%) all surged — gains that appeared somewhat outsized relative to the 0.8% overnight rise in benchmark COMEX uranium futures, but perhaps proportionate to the severity of last week's punishment.
Lithium stocks were generally higher in what was largely a sentiment-driven rally — GFEX lithium carbonate futures actually fell 1.3% to CNY 174,440/t, yet stocks moved sharply higher regardless. PMET Resources (PMT) (+9.0%), Core Lithium (CXO) (+7.1%), Vulcan Energy Resources (VUL) (+4.8%), Mineral Resources (MIN) (+4.8%), and Liontown Resources (LTR) (+2.8%) all advanced.
Australian 10-year Government Bond yield chart
Real Estate (XPJ) (+1.5%) caught the bond yield tailwind directly — as a bond-proxy sector, falling risk-free yields make property trust income streams more attractive relative to government bonds. Stockland (SGP) (+3.3%), Charter Hall (CHC) (+3.2%), and Goodman Group (GMG) (+1.7%) all gained.
Financials (XFJ) (+1.1%) rebounded on the improved economic outlook flowing from a potential Hormuz reopening, alongside the lower benchmark yields reducing credit quality concerns. Zip Co (ZIP) (+6.4%), Netwealth (NWL) (+3.0%), National Australia Bank (NAB) (+2.6%), and Macquarie Group (MQG) (+2.0%) were the standout movers.
Information Technology (XIJ) (+1.0%) tracked a modest gain in the Nasdaq, with the added benefit of lower benchmark bond yields lifting the present value of long-duration earnings streams. Weebit Nano (WBT) (+8.7%), Siteminder (SDR) (+4.5%), Appen (APX) (+2.8%), and WiseTech Global (WTC) (+2.4%) all advanced.
Energy (XEJ) (-5.6%) was the session's most severe casualty, with nowhere to hide as ICE Brent crude futures fell 4.5% to US$83.40/bbl — extending Friday's 3.4% decline as the prospect of Strait of Hormuz reopening unwinds months of accumulated geopolitical premium from the oil price.
Oil and gas producers bore the sharpest losses — Santos (STO) (-8.4%), Karoon Energy (KAR) (-8.4%), and Woodside Energy (WDS) (-5.7%) led the falls. Coal prices followed crude lower as globalCoal Newcastle coal futures fell 2.7% to $143.50/t. New Hope Corp. (NHC) (-7.9%), Yancoal Australia (YAL) (-7.3%), and Whitehaven Coal (WHC) (-4.8%) all sold off. Downstream energy names were also hit — Ampol (ALD) (-7.3%) and Viva Energy (VEA) (-5.8%) both fell as refinery margin compression concerns resurfaced.
Utilities (XUJ) (-1.8%) bucked the usual bond-proxy tailwind because its largest constituent — Origin Energy (ORG) (-3.2%) — has substantial earnings overlap with energy commodity prices.
Communication Services (XTJ) (-1.2%) was sold as investors rotated out of utility-style defensive positions in favour of cyclicals. Telstra (TLS) (-1.9%) and TPG Telecom (TPG) (-1.9%) were the primary drags, with Aussie Broadband (ABB) (-5.4%) also lower on its AGL telecom acquisition completion.
Consumer Staples (XSJ) (-0.8%) gave back defensive premium accumulated over the past fortnight — the supermarket majors that had outperformed strongly in recent weeks fell as risk-on sentiment returned. Coles (COL) (-2.1%) and Woolworths (WOW) (-0.3%) both retreated as investors moved on to higher-beta alternatives.
Today's best ASX Top 300 gainers
Company | Last Price | Change $ | Change % | 1mo % | 1yr % |
|---|---|---|---|---|---|
| Ora Banda Mining (OBM) | $1.285 | +$0.18 | +16.3% | -9.2% | +23.0% |
| Vault Minerals (VAU) | $4.60 | +$0.59 | +14.7% | -2.3% | +60.8% |
| Regis Resources (RRL) | $6.63 | +$0.78 | +13.3% | -2.5% | +31.0% |
| Bellevue Gold (BGL) | $1.52 | +$0.175 | +13.0% | -7.0% | +57.5% |
| Virgin Australia Holdings (VGN) | $2.89 | +$0.33 | +12.9% | +20.4% | -0.3% |
| Deep Yellow (DYL) | $1.595 | +$0.18 | +12.7% | -7.8% | +23.2% |
| Catalyst Metals (CYL) | $5.63 | +$0.61 | +12.2% | -3.9% | -19.9% |
| Greatland Resources (GGP) | $13.70 | +$1.46 | +11.9% | -7.1% | +107.6% |
| Capricorn Metals (CMM) | $13.36 | +$1.34 | +11.1% | -4.2% | +30.7% |
| Capstone Copper Corp. (CSC) | $15.72 | +$1.49 | +10.5% | +13.0% | +82.4% |
| Emerald Resources NL (EMR) | $5.91 | +$0.55 | +10.3% | -4.5% | +25.7% |
| Predictive Discovery (PDI) | $0.865 | +$0.08 | +10.2% | -13.9% | +106.0% |
| Evolution Mining (EVN) | $12.93 | +$1.18 | +10.0% | -2.3% | +40.5% |
| Southern Cross Gold Consolidated (SX2) | $9.55 | +$0.79 | +9.0% | -11.3% | +28.4% |
| WEB Travel Group (WEB) | $2.67 | +$0.22 | +9.0% | +6.0% | -42.8% |
| WA1 Resources (WA1) | $13.81 | +$1.13 | +8.9% | -14.6% | -1.1% |
| Perseus Mining (PRU) | $5.31 | +$0.43 | +8.8% | -5.9% | +37.6% |
| Pantoro Gold (PNR) | $2.74 | +$0.22 | +8.7% | -16.7% | -23.9% |
| Weebit Nano (WBT) | $6.86 | +$0.55 | +8.7% | +12.8% | +312.0% |
| FireFly Metals (FFM) | $2.07 | +$0.165 | +8.7% | -5.5% | +101.0% |
Today's worst ASX Top 300 losers
Company | Last Price | Change $ | Change % | 1mo % | 1yr % |
|---|---|---|---|---|---|
| Santos (STO) | $7.39 | -$0.68 | -8.4% | -3.7% | +6.2% |
| Karoon Energy (KAR) | $1.86 | -$0.17 | -8.4% | -8.8% | -6.3% |
| New Hope Corporation (NHC) | $5.56 | -$0.48 | -7.9% | +10.3% | +43.7% |
| Yancoal Australia (YAL) | $6.07 | -$0.48 | -7.3% | -5.7% | +3.9% |
| Ampol (ALD) | $33.80 | -$2.65 | -7.3% | -0.8% | +31.0% |
| Viva Energy Group (VEA) | $2.12 | -$0.13 | -5.8% | -3.6% | +5.0% |
| Woodside Energy Group (WDS) | $29.46 | -$1.77 | -5.7% | -3.8% | +16.9% |
| Aussie Broadband (ABB) | $5.27 | -$0.30 | -5.4% | -0.4% | +31.1% |
| Whitehaven Coal (WHC) | $8.45 | -$0.43 | -4.8% | +9.5% | +49.6% |
| Electro Optic Systems Holdings (EOS) | $8.91 | -$0.42 | -4.5% | +5.2% | +246.7% |
| Elsight (ELS) | $8.05 | -$0.33 | -3.9% | +34.4% | +606.1% |
| Beach Energy (BPT) | $1.035 | -$0.04 | -3.7% | -5.0% | -20.4% |
| Nufarm (NUF) | $2.80 | -$0.10 | -3.4% | +17.6% | +25.0% |
| Neuren Pharmaceuticals (NEU) | $12.95 | -$0.44 | -3.3% | +0.8% | -1.1% |
| Origin Energy (ORG) | $10.73 | -$0.36 | -3.2% | -7.9% | -6.3% |
| MAAS Group Holdings (MGH) | $5.12 | -$0.17 | -3.2% | +6.0% | +20.5% |
| Bravura Solutions (BVS) | $2.17 | -$0.07 | -3.1% | +0.5% | -4.4% |
| Medibank Private (MPL) | $4.84 | -$0.13 | -2.6% | +5.4% | -1.2% |
| Alpha HPA (A4N) | $0.76 | -$0.02 | -2.6% | +13.4% | -4.4% |
| Dalrymple Bay Infrastructure (DBI) | $5.74 | -$0.15 | -2.5% | +8.9% | +51.5% |
Chartwatch
Nasdaq Composite Index
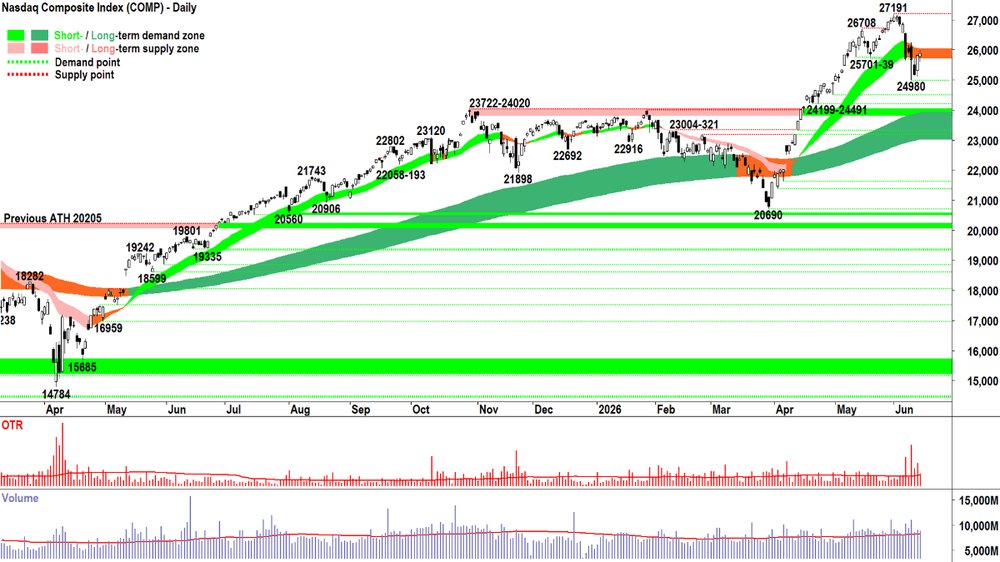
Analysis
Friday's candle hardly reinforced Thursday's rebound. One could argue it's a disappointing result considering the Comp has failed to close back above the short term trend ribbon, nor has it closed above the 26111 balance point (i.e., mid-point) of the 5 June major supply candle. (Friday's close was 25889 vs high of 26010).
My model is very simple sometimes. D vs S = P is the foundation of this simplicity, sure, but if we think of that massive supply candle as the marker for the start of this correction... Then 'below it' means the supply side remains more influential on the Comp's price than does the demand side.
'Above it', then one could easily argue the demand side is back in control.
26111 isn't likely to be a point that many technical analysts are going to pick out — it's not a peak or a trough, it's not a pivot point, nor a Fibonacci retracement for the broader correction. It's just a number — and the market is going to do what the market is going to do.
But, I know I'd feel more comfortable the bull market is alive and healthy if the Comp can close above 26111. As a minimum, that is, because ideally it can recoup that entire dominant candle's range and close above its 26573 high.
If 26111 and 26573 are key numbers to the upside, then 24980 must be the critical number to the downside.
As in: a close below it is going to make the Comp's chart look very dicey indeed!
That's it. Those are the numbers to watch. The short term trend is neutral — in itself a warning to adopt a more 'balanced' approach. The long term trend remains robust and intact — in itself a reminder to expect a resolution to the upside MOTN. ⚖️
Ultimately, demand and supply will decide which key level is tripped first. It always does! Our job as trend following technical analysts is to Accept the trends as they stand and to Act accordingly.
View
The balanced approach, i.e. 1/2RP, feels like the most appropriate approach on the Comp (RP = Risk Position — it reflects my personal allowable capital allocation limit for my investments in US stocks. So 1/2RP is 50%, 2/3RP is 67% and FRP is 100% 🪣).
Key levels
With 25701 consumed, 24199-2491 is the key zone of demand. The short term uptrend ribbon (presently 25738-26043) is now the key zone of supply. Beyond that — the all-time high of 27191.
S&P/ASX 200 (XJO)
%20chart_15%20Jun.png)
Analysis
Just as the Comp is coming off the boil, our own OTP is starting to look the goods! And it's easy to get excited about the OTP's prospects here (no, I am not upgrading it to "Golden Le Creuset" just yet!).
But as much as I'd like to believe / hope there's more in this 2-day run... there remains the distinct possibility that we are simply chopping up and down around the very flat-and-orange trend ribbons.
I.e., mindless, listless, chop, chop, chop: NOISE!
In Friday's update, I offered that the long, white, close-at-session-high candle warranted an increase in my portfolio risk limit to 1/2RP from 1/3RP. I still think it's the right balance for now.
Let's see how the OTP fares at the 8987-9022 supply zone. A very promising rally in April met it's fate there. Remember the fingerprints of excess demand / supply? What will we see at 8987-9022?
Fingerprints of excess demand 📈
✅ White-bodied candles and or downward pointing shadows, longer = greater excess demand (i.e., FOMO + HOFU, downward pointing shadows also BTD). Close at/very near high = unquenched excess demand
✅ Rising peaks = supply removal + FOMO + HOFU (how else can you make new highs!?)
✅ Rising troughs = BTD + demand reinforcement
✅ Trend ribbons acting as zones of dynamic demand (i.e., a barrier to lower prices)
Fingerprints of excess supply 📉
❌ Black-bodied candles and or upward pointing shadows, longer = greater excess supply (i.e., FOHO, upward pointing shadows also STR). Close at/very near low = unquenched excess supply
❌ Falling peaks = STR + supply reinforcement
❌ Falling troughs = demand removal + NUTE + FOHO (how else can you make new lows!?)
❌ Trend ribbons acting as zones of dynamic supply (i.e., a barrier to higher prices)
If we see ticks... the OTP is MOTN going to test 9201.
If we see crosses... then the supply at 8987-9022 is clearly a tough nut to crack.
Hey... NUTE and FOHO... if you've been watching my webinars on Weds you know I've been trying to come up with cool acronyms for the opposites of FOMO and HOFU.
Can I offer (in a downtrend / supply side market):
NUTE = No Urgency To Enter (i.e., how those who own cash on the demand side feel = the opposite of FOMO!)
FOHO = Fear Of Holding On (i.e., how those who own stock on the supply side feel = the opposite of HOFU!)
View
I am at 1/2RP 🪣 on the OTP (i.e., my personal allowable capital allocation limit for my investments in Australian stocks is 50%).
Key levels
8987-9022 is the key zone of supply. Beyond that, it's 9201. Demand is in the 8485-8561 range, but the short- and long-term trend ribbons (presently )will also increasingly come into play.
(Glossary of acronyms! Old Tin Pot (OTP): S&P/ASX 200 | MOTN: More Often Than Not | FOMO: Fear Of Missing Out | HOFU: Holding On For Upside | BTD: Buy The Dip | STR: Sell The Rally | RP: Risk Position)
ChartWatch LIVE Webinar
ChartWatch LIVE Webinars – WEEKLY Wednesday's @ 12pm AEDT
Learn more about technical analysis and trend following through real case studies on ASX stocks. Australia's premier technical analyst, Carl Capolingua, shares his unique insights on stocks as requested by viewers. Ask about a company in your portfolio or anything related to trading and investing and get Carl's expert opinion.
Places are limited so >REGISTER NOW!<
Economy
Today
There weren't any major economic data releases in our time zone today
Later this week
Tuesday
10:00 CHN May 'Data Dump'
New Home Prices (was -0.19% in April)
Fixed Asset Investment (-2.3% ytd/y forecast vs -1.6% ytd/y in April)
Industrial Production (+4.3% p.a. forecast vs +4.1% p.a. in April)
Retail Sales (-0.2% p.a. forecast vs 0.2% p.a.)
Unemployment Rate (5.2% forecast vs 5.2%)
12:30 AUS RBA Board Meeting and Cash Rate Decision
Cash rate: No change at 4.35% forecast
RBA statement
13:30 RBA Governor Michelle Bullock press conference
Wednesday
20:30 USA May Core Retail Sales (+0.5% m/m forecast vs +0.5% m/m in April)
20:30 USA President Trump speaks
Thursday
02:00 Federal Reserve FOMC Meeting (New Chairman Kevin Warsh's first meeting!)
Federal Funds Rate (no change at +3.75% forecast)
FOMC Economic Projections & Statement
02:30 New Chairman Kevin Warsh's first press conference
Friday
ALL DAY CHN Holiday / Non trading day
ALL DAY USA Holiday / Non trading day
Interesting Movers
Trading higher
- Ora Banda Mining (OBM) $1.29+16.3%
Signed a $233 million engineering, procurement and construction contract with GR Engineering Services for its 3 million tonne per annum Davyhurst Mill Expansion Project; early earthworks commenced in late May with project teams now focused on construction execution.
- Accent Group (AX1) $0.75+15.4%
Officially responded to Frasers Group's unsolicited 65¢ per share on-market takeover offer, stating it represents no premium to recent trading levels; the board noted Frasers had previously acquired shares above 90¢ in February and is advising shareholders to await a formal target's statement before taking action.
- Vault Minerals (VAU) $4.60+14.7%
Confirmed FY26 gold production guidance of 332,000–360,000 ounces after producing 306,542 ounces in the 11 months to May 31; the company guided to FY27 production of 360,000–390,000 ounces and FY28 of 370,000–400,000 ounces as major growth capital expenditure completes.
- Pmet Resources (PMT) $0.67+9.0%
Announced its spodumene concentrate has been identified as the preferred feedstock for NRW Holdings' Primero-developed ALi atmospheric leach process, following a review of seven lithium processing flowsheets; bench-scale testing produced 99.8% battery-grade lithium carbonate, offering potential to produce value-added lithium chemical at the mine gate.
- Perseus Mining (PRU) $5.31+8.8%
Expanded its on-market share buyback program by $50 million to $150 million after reaching the initial $100 million threshold; management cited the stock's undervaluation relative to its high-margin production profile and organic growth pipeline.
- OOh!media (OML) $1.50+8.7%
Received revised indicative takeover proposals from Pacific Equity Partners, I Squared Capital, and Oaktree Capital Management at around $1.60 per share following a three-week due diligence period; OML will provide further due diligence access to selected parties over the next six weeks.
- IperionX (IPX) $5.44+6.3%
Agreed to acquire mineral rights, stockpiles, and infrastructure at Covia Solutions' Camden site in Tennessee for US$3 million, adjacent to its Titan Critical Minerals Project; the acquisition consolidates its position in the Big Sandy Critical Minerals Province and will support integrated development assessment across both sites.
- Sigma Healthcare (SIG) $2.80+6.1%
Withdrew from the sales process for UK pharmacy chain Boots, stating the approximately $14 billion acquisition would not currently meet its strategic and capital investment objectives.
- NRW Holdings (NWH) $7.25+4.2%
Its Primero subsidiary's ALi atmospheric leach lithium processing technology was identified as PMET Resources' preferred pathway following a review of seven competing flowsheets, with bench-scale testing demonstrating 99.8% battery-grade lithium carbonate production; commercialisation discussions are continuing with investment banks.
- ASX Ltd. (ASX) $50.46+2.6%
Admitted a 2022 statement about the status of its technology upgrade was misleading and agreed to a $20.5 million ASIC penalty settlement; ASIC chairman Sarah Court noted the admissions concerned the accuracy of disclosures about critical market infrastructure.
Trading Lower
- Woodside Energy Group (WDS) $29.46-5.7%
Officially denied being in discussions with ExxonMobil regarding any potential transaction, responding to media speculation about a possible US acquisition of the LNG producer; the stock also fell on the broader energy sector selloff as crude oil dropped sharply on the US-Iran deal.
- Aussie Broadband (ABB) $5.27-5.4%
Completed its acquisition of AGL Energy's telecommunications business, issuing $115 million worth of shares to AGL to add 350,000 broadband and mobile connections; the company surpassed 1 million broadband connections in May and expects FY26 underlying EBITDA to land in the middle of its $162–167 million guidance range.
- Electro Optic Systems Holdings (EOS) $8.91-4.5%
Guided FY26 base business revenue to $240–270 million, below prior expectations, while separately noting it continues to assess timing of revenue recognition from its MARSS operations; a new US$5 million order from L3Harris was confirmed, with production to be completed in Australia during 2026.
- Transurban (TCL) $15.35-1.7%
Agreed to sell its remaining 50% stake in the A25 toll road concession in Montreal to Quebec pension fund La Caisse for C$280 million, reflecting the asset's carrying value; separately, confirmed the opening of its M7-M12 Integration Project interchange on June 14, increasing M7 capacity by up to 30,000 vehicles per day.
Broker Moves
Company | Broker | Action | Rating | Price Target |
|---|---|---|---|---|
AALAlfabs Australia | Bell Potter | Retained | Hold | $0.29(from $0.36) |
AEMAdvanced Energy Minerals | Ord Minnett | Retained | Speculative Buy | $0.90 |
ALLAristocrat Leisure | Morgan Stanley | Retained | Overweight | $63.90 |
ALQALS | Jefferies | Upgraded | Buy(from Hold) | $26.00(from $24.40) |
AMPAMP | UBS | Retained | Buy | $1.65 |
ANZANZ Group Holdings | Morgan Stanley | Retained | Overweight | $34.00 |
| UBS | Retained | Neutral | $36.50 | |
ASXASX | UBS | Retained | Buy | $62.00 |
AX1Accent Group | Citi | Retained | Neutral | $0.65(from $0.60) |
BHPBHP Group | Morgan Stanley | Retained | Overweight | $67.50 |
BMNBannerman Energy | UBS | Initiated | Buy | $5.15 |
BOEBoss Energy | Morgan Stanley | Retained | Overweight | $1.80 |
BOQBank of Queensland | UBS | Retained | Neutral | $7.00 |
BPTBeach Energy | UBS | Retained | Sell | $0.95(from $1.00) |
CBACommonwealth Bank of Australia | Morgan Stanley | Retained | Underweight | $125.00 |
| UBS | Retained | Sell | $130.00 | |
COHCochlear | UBS | Retained | Neutral | $106.00(from $109.00) |
DGTDigico Infrastructure REIT | Bell Potter | Retained | Buy | $3.40 |
DMPDomino's Pizza Enterprises | Morgans | Downgraded | Hold(from Buy) | $17.60(from $25.00) |
DRRDeterra Royalties | Morgan Stanley | Retained | Overweight | $4.45 |
ELVElevra Lithium | Macquarie | Upgraded | Outperform(from Neutral) | $14.50(from $13.50) |
EQREQ Resources | Canaccord Genuity | Retained | Buy | $0.50 |
EVNEvolution Mining | Macquarie | Upgraded | Outperform(from Neutral) | $13.00(from $14.00) |
FMGFortescue | Morgan Stanley | Retained | Underweight | $18.85 |
GGPGreatland Resources | Macquarie | Upgraded | Outperform(from Neutral) | $14.00(from $15.00) |
GMGGoodman Group | Bell Potter | Retained | Buy | $35.50 |
GPTGPT Group | Citi | Retained | Buy | $6.00 |
GQGGQG Partners Inc. | UBS | Retained | Buy | $2.00 |
IAGInsurance Australia Group | UBS | Retained | Buy | $8.80 |
IELIDP Education | Ord Minnett | Retained | Buy | $4.75(from $8.00) |
IGOIGO | Canaccord Genuity | Retained | Buy | $10.00(from $10.80) |
| Morgan Stanley | Retained | Underweight | $6.85 | |
ILUIluka Resources | Morgan Stanley | Retained | Overweight | $7.95 |
IMDImdex | Jefferies | Upgraded | Buy(from Hold) | $5.00(from $4.80) |
JDOJudo Capital Holdings | UBS | Retained | Buy | $2.25 |
L1GL1 Group | UBS | Retained | Neutral | $1.17 |
LTRLiontown | Macquarie | Upgraded | Outperform(from Neutral) | $2.30(from $2.20) |
LYCLynas Rare Earths | Morgan Stanley | Retained | Equal Weight | $20.45 |
MFGMagellan Financial Group | UBS | Retained | Neutral | $10.10 |
MGHMAAS Group Holdings | Jefferies | Downgraded | Hold(from Buy) | $5.50 |
MQGMacquarie Group | Morgan Stanley | Retained | Overweight | $263.00 |
| UBS | Retained | Neutral | $250.00 | |
MTMMetallium | Canaccord Genuity | Retained | Speculative Buy | $1.60 |
MVFMonash IVF Group | Bell Potter | Retained | Hold | $0.75 |
NABNational Australia Bank | Morgan Stanley | Retained | Underweight | $34.50 |
| UBS | Retained | Buy | $48.50 | |
NWLNetwealth Group | UBS | Retained | Neutral | $27.00 |
NWSNews Corporation | UBS | Retained | Buy | $56.00(from $58.00) |
ORGOrigin Energy | UBS | Retained | Buy | $13.60 |
PDNPaladin Energy | Morgan Stanley | Retained | Overweight | $13.65 |
PLSPLS Group | Morgan Stanley | Retained | Equal Weight | $5.60 |
PMTPMET Resources Inc | Canaccord Genuity | Retained | Speculative Buy | $1.35 |
PRNPerenti | Jefferies | Upgraded | Buy(from Hold) | $2.45(from $2.35) |
PXAPEXA Group | UBS | Retained | Neutral | $12.80 |
QALQualitas | Macquarie | Retained | Outperform | $4.16 |
QBEQBE Insurance Group | UBS | Retained | Buy | $25.25 |
QUBQube Holdings | Morgan Stanley | Retained | Equal Weight | $5.15 |
RFGRetail Food Group | Bell Potter | Downgraded | Hold(from Buy) | $0.74(from $2.60) |
RIORio Tinto | Macquarie | Downgraded | Neutral(from Outperform) | $188.00(from $186.00) |
| Morgan Stanley | Retained | Equal Weight | $171.50 | |
S32South32 | Macquarie | Downgraded | Neutral(from Outperform) | $4.60(from $4.50) |
| Morgan Stanley | Retained | Overweight | $4.85 | |
SCGScentre Group | UBS | Retained | Neutral | $3.85 |
SEKSEEK | Bell Potter | Retained | Buy | $18.60(from $23.90) |
SFRSandfire Resources | Morgan Stanley | Retained | Underweight | $16.00 |
SIGSigma Healthcare | Citi | Retained | Neutral | $3.20 |
STOSantos | UBS | Retained | Buy | $8.60 |
SULSuper Retail Group | Morgans | Retained | Hold | $12.30(from $11.51) |
SUNSuncorp Group | UBS | Retained | Buy | $19.60 |
SYLSymal Group | Morgans | Retained | Buy | $3.35 |
WDSWoodside Energy Group | Citi | Retained | Neutral | $34.00 |
| Ord Minnett | Retained | Sell | $24.75 | |
| UBS | Retained | Neutral | $30.40(from $30.10) | |
WHCWhitehaven Coal | Morgan Stanley | Retained | Overweight | $9.55 |
XROXero | Morgan Stanley | Retained | Overweight | $130.00 |
Scans
Top Gainers
Code | Company | Last | % Chg |
|---|---|---|---|
| BMT | Beamtree Holdings Ltd | $0.14 | +47.37% |
| HT8 | Harris Technology Group Ltd | $0.02 | +33.33% |
| 14D | 1414 Degrees Ltd | $0.091 | +30.00% |
| DES | Desoto Resources Ltd | $0.125 | +25.00% |
| GRV | Greenvale Energy Ltd | $0.041 | +24.24% |
Top Fallers
Code | Company | Last | % Chg |
|---|---|---|---|
| ACS | Accent Resources NL | $0.039 | -22.00% |
| BST | Boresight Ltd | $0.475 | -20.17% |
| NX1 | Nexalis Therapeutics Ltd | $0.016 | -20.00% |
| TRM | Truscott Mining Corporation Ltd | $0.06 | -20.00% |
| AIV | Activex Ltd | $0.019 | -17.39% |
52 Week Highs
Code | Company | Last | % Chg |
|---|---|---|---|
| EDU | EDU Holdings Ltd | $1.18 | +16.83% |
| PAB | PATRYS Ltd | $0.049 | +13.95% |
| BOL | Boom Logistics Ltd | $2.20 | +10.00% |
| SNX | Sierra Nevada Gold Inc | $0.079 | +9.72% |
| BXN | Bioxyne Ltd | $0.094 | +9.30% |
52 Week Lows
Code | Company | Last | % Chg |
|---|---|---|---|
| NX1 | Nexalis Therapeutics Ltd | $0.016 | -20.00% |
| BUY | Bounty Oil & Gas NL | $0.025 | -16.67% |
| IGN | Ignite Ltd | $0.59 | -15.71% |
| IDA | Indiana Resources Ltd | $0.024 | -14.29% |
| VTA | Vita Resources NL | $0.031 | -13.89% |
Near Highs
Code | Company | Last | % Chg |
|---|---|---|---|
| WVOL | iShares MSCI World Ex Aust Minimum Volatility ETF | $45.18 | +0.13% |
| EGH | Eureka Group Holdings Ltd | $0.595 | 0.00% |
| VVLU | Vanguard Global Value Equity Active ETF | $82.19 | +0.97% |
| IHD | iShares S&P/ASX DIV Opportunities Esg Screened ETF | $17.43 | +1.22% |
| AYLD | Global X S&P/ASX 200 Covered Call Complex ETF | $10.41 | +0.48% |
Relative Strength Index (RSI) Oversold
Code | Company | Last | % Chg |
|---|---|---|---|
| WBCPJ | Westpac Banking Corporation | $100.88 | -0.09% |
| LOT | Lotus Resources Ltd | $0.52 | +2.97% |
| FLG | Flagship Minerals Ltd | $0.185 | 0.00% |
| FAR | FAR Ltd | $0.285 | 0.00% |
| WHF | Whitefield Industrials Ltd | $4.52 | +0.22% |
