
The ASX 200 recovered early losses to close higher despite hot US inflation data, as funds rotated out of the big banks and into miners. Tech, utilities and lithium stocks led, while financials and gold miners lagged.
Be sure to click/scroll through for the usual reporting of the major sector and stock-specific moves, the broker responses to them, as well as all the key economic data in tonight's Evening Wrap. Also, I have detailed technical analysis on the Nasdaq Composite and the S&P/ASX 200 in today's ChartWatch.
Let’s dive in!
Today in Review
Name | Value | % Chg |
|---|---|---|
Major Indices | ||
| ASX 200 | 9,153.2 | +0.27% |
| All Ords | 9,291.3 | +0.25% |
| Small Ords | 3,322.1 | +0.52% |
| All Tech | 3,073.0 | +0.97% |
| Emerging Companies | 2,864.2 | +0.49% |
Currency | ||
| AUD/USD | 0.6877 | +0.16% |
US Futures | ||
| S&P 500 | 7,592.25 | +0.64% |
| Dow Jones | 52,436.0 | +0.23% |
| Nasdaq | 28,230.0 | +1.42% |
Name | Value | % Chg |
|---|---|---|
Sector | ||
| Information Technology | 1,832.1 | +1.52% |
| Utilities | 10,756.6 | +1.30% |
| Materials | 23,779.9 | +0.77% |
| Energy | 10,433.0 | +0.72% |
| Consumer Discretionary | 3,826.5 | +0.53% |
| Industrials | 8,587.8 | +0.38% |
| Health Care | 35,259.2 | +0.27% |
| Real Estate | 3,533.8 | +0.27% |
| Communication Services | 1,645.4 | +0.21% |
| Consumer Staples | 13,783.7 | +0.10% |
| Financials | 9,774.3 | -0.35% |
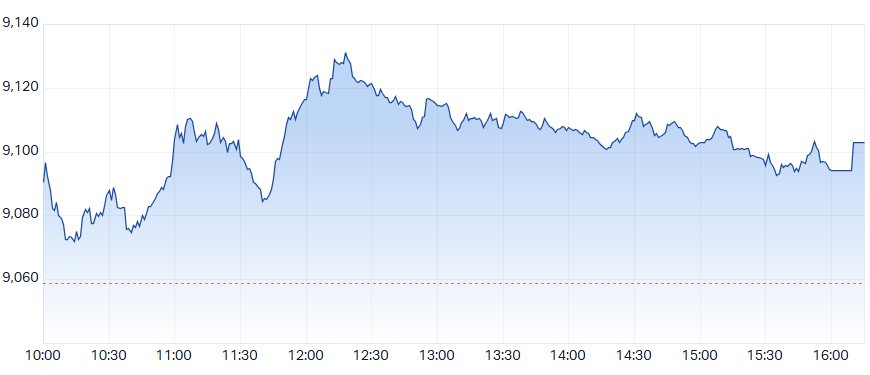
ASX 200 Intraday Chart
Markets
The S&P/ASX 200 (XJO) finished 24.2 points higher at 9,153.2, 0.75% from its session low and smack–bang on its session high. Further confirming the enthusiasm at benchmark level, in the broader-based S&P/ASX 300 (XKO) advancers beat decliners by 174 to 108.
Information Technology (XIJ) (+1.5%) led the market despite a weaker night for US tech, as better-than-expected earnings from US AI cloud provider CoreWeave eased concerns over the AI trade. Our tech stocks largely missed the AI rally after being lumped into the “Saaspocalypse” basket of software names dumped on fears that AI would disrupt them. But they’ve held up far better through the recent AI-trade weakness. Megaport (MP1) (+4.4%) and WiseTech Global (WTC) (+2.5%) gained, while Xero (XRO) (+1.8%) also firmed.
Utilities (XUJ) (+1.3%) followed energy stocks higher as crude rebounded in Asian trade. ICE benchmark Brent crude futures rose 1.1% to US$92.46/bbl after falling 5.8% overnight on hopes of de-escalation in the Iran war. Investors are betting the falls of the last few sessions have run their course. AGL Energy (AGL) (+2.3%), APA Group (APA) (+1.4%) and Origin Energy (ORG) (+1.0%) each rose.
Energy (XEJ) (+0.7%) stocks rebounded, shrugging off those overnight losses in crude. Refiners Ampol (ALD) (+1.8%) and Viva Energy Group (VEA) (+1.5%) led, but among oil and gas producers, Karoon Energy (KAR) (+1.9%), Santos (STO) (+1.2%) and Woodside Energy Group (WDS) (+0.5%) were very decent.
Materials (XMJ) (+0.8%) logged a third straight gain, picking up funds rotating out of the big banks. Investors chose to focus on the cost relief from oil’s recent slide rather than another night of lower metals prices. Aluminium and copper fell 0.3% and nickel fell 2% on the London Metal Exchange. Sentiment, it seems, not commodity prices!
Nickel Industries (NIC) (+3.1%) was one of the sector’s best performers despite nickel’s fall. Sandfire Resources (SFR) (+1.8%) and Sims (SGM) (+1.6%) also gained, as did South32 (S32) (+0.9%). Among the diversified miners, BHP Group (BHP) (+0.9%) and Rio Tinto (RIO) (+0.7%) added to gains.
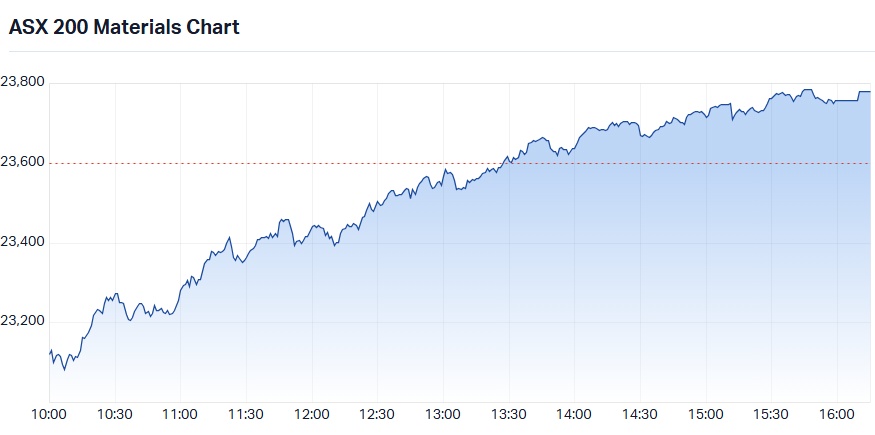
S&P/ASX 200 Materials Sector Index (XMJ) intraday chart
Lithium stocks were the highlights of the materials rally. They got a boost from a rebound in benchmark lithium carbonate futures on China’s Guangzhou Futures Exchange (GFEX), which rose 2.8% to CNY 89,500/t in Asian trade. Elevra Lithium (ELV) (+9.7%) and Core Lithium (CXO) (+8.0%) led, followed by PLS Group (PLS) (+6.5%) and Vulcan Energy Resources (VUL) (+5.7%). IGO (IGO) (+4.8%) and Liontown (LTR) (+3.6%) also rallied.
Financials (XFJ) (-0.3%) started strong but closed near session lows after Commonwealth Bank’s quarterly result flipped the flow of funds away from the big banks and towards the miners. Commonwealth Bank of Australia (CBA) (-1.2%) slid despite an 8% rise in first-quarter net profit, with investors betting its stretched valuation leaves little room for upside.
National Australia Bank (NAB) (-1.5%) fell harder, while ANZ Group Holdings (ANZ) (+1.4%) bucked the trend. A record quarterly drop in new home lending likely added to the pressure, a sign higher rates are biting into credit demand.
Macquarie Group (MQG) (-1.5%) fell after admitting it misled customers with a savings rate promotion, for which it faces a $14 million penalty. Insurers were generally stronger, with QBE Insurance Group (QBE) (+0.8%) and Suncorp Group (SUN) (+0.8%) both higher. Fund managers were softer, led by GQG Partners (GQG) (-19.6%), which plunged to a record low of 78c after investors pulled a further $10 billion from its funds last month.
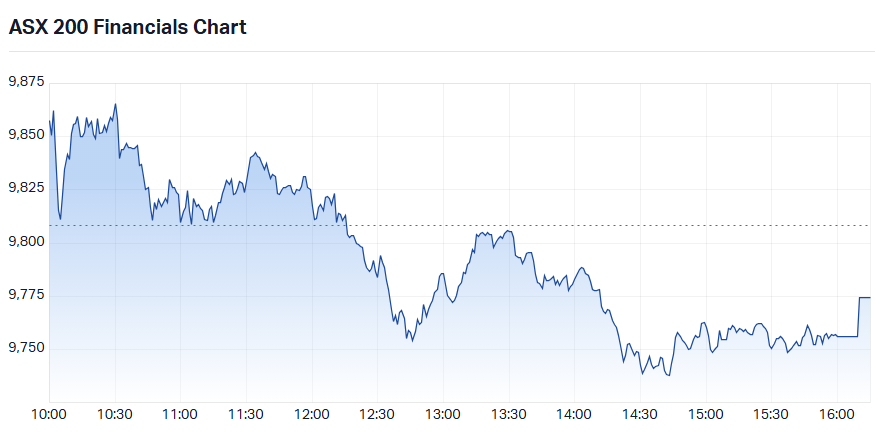
S&P/ASX 200 Financials Sector Index (XFJ) intraday chart
The Gold Sub-Index (XGD) (0.0%) finished flat in a mixed session. Precious metals fell sharply overnight as benchmark bond yields spiked on hotter-than-expected US CPI data. Higher yields raise the opportunity cost of holding gold and silver, which pay no income. Both rebounded in Asian trade. COMEX benchmark gold futures rose 0.8% to US$4,063/oz after falling 2.1% overnight, and COMEX benchmark silver futures rose 3.3% to US$52.90/oz after a 2.8% overnight drop.
That rebound helped the sector trim its losses and lifted Genesis Minerals (GMD) (+1.3%) and Evolution Mining (EVN) (+1.3%) into the green. Black Cat Syndicate (BC8) (-5.0%) and Ora Banda Mining (OBM) (-3.0%) fell, while Newmont Corporation (NEM) (-2.5%) also lost ground.
Today's best ASX Top 300 gainers
Company | Last Price | Change $ | Change % | 1mo % | 1yr % |
|---|---|---|---|---|---|
| Life360 Inc (360) | $20.81 | +$1.90 | +10.0% | +2.3% | -54.6% |
| Core Lithium (CXO) | $0.27 | +$0.02 | +8.0% | +10.2% | +68.8% |
| Sunrise Energy Metals (SRL) | $14.00 | +$1.00 | +7.7% | -18.4% | +206.3% |
| Monadelphous Group (MND) | $34.99 | +$2.36 | +7.2% | +13.5% | +35.8% |
| PLS Group (PLS) | $3.10 | +$0.19 | +6.5% | -11.4% | -9.9% |
| NRW Holdings (NWH) | $6.91 | +$0.42 | +6.5% | -8.5% | +36.3% |
| IGO (IGO) | $5.47 | +$0.25 | +4.8% | -10.0% | -2.8% |
| Tasmea (TEA) | $9.87 | +$0.42 | +4.4% | -6.0% | +88.7% |
| Megaport (MP1) | $19.26 | +$0.81 | +4.4% | +2.6% | +30.3% |
| Lycopodium (LYL) | $21.24 | +$0.87 | +4.3% | -8.1% | +64.9% |
| Zip Co (ZIP) | $2.17 | +$0.08 | +3.8% | +0.5% | -38.0% |
| Liontown (LTR) | $0.715 | +$0.025 | +3.6% | -7.1% | -42.3% |
| Light & Wonder Inc. (LNW) | $122.00 | +$4.20 | +3.6% | +5.2% | -12.1% |
| Freightways Group (FRW) | $10.26 | +$0.35 | +3.5% | +3.1% | -16.1% |
| Minerals 260 (MI6) | $0.88 | +$0.03 | +3.5% | +6.7% | +179.4% |
| Brightstar Resources (BTR) | $0.74 | +$0.025 | +3.5% | +12.1% | +60.9% |
| Nickel Industries (NIC) | $0.66 | +$0.02 | +3.1% | -12.6% | -7.7% |
| Wagners Holding Company (WGN) | $4.99 | +$0.15 | +3.1% | +7.8% | +55.9% |
| GR Engineering Services (GNG) | $7.68 | +$0.23 | +3.1% | -0.3% | +97.4% |
| Guzman Y Gomez (GYG) | $27.40 | +$0.82 | +3.1% | +3.5% | +10.2% |
Today's worst ASX Top 300 losers
Company | Last Price | Change $ | Change % | 1mo % | 1yr % |
|---|---|---|---|---|---|
| GQG Partners Inc. (GQG) | $0.78 | -$0.19 | -19.6% | -30.4% | -47.1% |
| PYC Therapeutics (PYC) | $1.905 | -$0.09 | -4.5% | -22.2% | +64.6% |
| Benz Mining Corp (BNZ) | $4.54 | -$0.19 | -4.0% | -0.7% | +196.7% |
| NEXTDC (NXT) | $10.36 | -$0.43 | -4.0% | -0.1% | -32.2% |
| PEXA Group (PXA) | $7.14 | -$0.25 | -3.4% | +9.7% | -51.3% |
| Southern Cross Gold Consolidated (SX2) | $9.00 | -$0.31 | -3.3% | -16.9% | +10.8% |
| EQ Resources (EQR) | $0.30 | -$0.01 | -3.2% | -7.7% | +552.2% |
| Breville Group (BRG) | $32.30 | -$1.05 | -3.1% | +4.0% | +9.2% |
| Ora Banda Mining (OBM) | $1.59 | -$0.05 | -3.0% | +8.9% | +29.8% |
| Navigator Global Investments (NGI) | $2.03 | -$0.06 | -2.9% | -11.7% | -32.1% |
| IperionX (IPX) | $2.40 | -$0.07 | -2.8% | +9.1% | -58.2% |
| Turaco Gold (TCG) | $0.75 | -$0.02 | -2.6% | -10.7% | +66.7% |
| Cobram Estate Olives (CBO) | $2.65 | -$0.07 | -2.6% | -8.6% | -16.9% |
| NexGen Energy (Canada) (NXG) | $12.35 | -$0.32 | -2.5% | +0.6% | -8.2% |
| Newmont Corporation (NEM) | $176.65 | -$4.50 | -2.5% | +5.3% | +29.4% |
| Nanosonics (NAN) | $2.78 | -$0.07 | -2.5% | -2.1% | -34.0% |
| Mesoblast (MSB) | $2.03 | -$0.05 | -2.4% | +1.5% | -12.1% |
| Bannerman Energy (BMN) | $3.63 | -$0.07 | -1.9% | +15.6% | +10.7% |
| Alcoa Corporation (AAI) | $59.12 | -$1.07 | -1.8% | -4.5% | -0.1% |
| Latitude Group Holdings (LFS) | $0.84 | -$0.015 | -1.8% | +5.7% | -25.7% |
Chartwatch
Nasdaq Composite Index
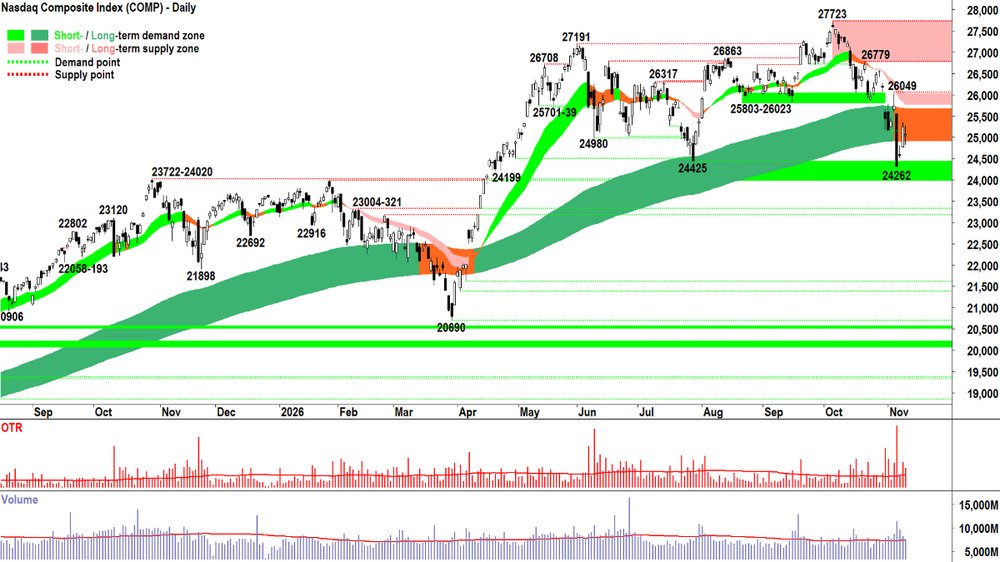
Nasdaq Composite Index chart
Analysis
I'm not sure what to do next...
That's what the market said last night about Monday's massive demand side pulse!
A super interesting candle. We call this an "indecision candle". I talked about it in today's webinar, so I'll spare myself some typing and refer you to the recording below for a full explanation 👇. But suffice it to say — we're at a critical juncture in D vs S = P.
P ⬆️
P ⬇️
or P ➡️?
Beats me! 🤷 I can't tell the future, remember!?
I can say with confidence however, that the short term trend ribbon (STTR) suggests S > D (consider P < STTR, STTR ⬇️, and STTR acting as zone of dynamic supply). The price action also suggests S > D (consider falling peaks and falling troughs 📉). And arguably — there remains a predominance of supply side candles.
Suggests MOTN still lies with P ⬇️.
The big risk here is that the long term trend ribbon (LTTR) begins to act as a zone of dynamic supply. Translation: we get another lower peak in the LTTR, and then go on to retest demand at 24262.
As far as my model is concerned, a close below 24262 commences an official long term downtrend in the Comp.
Translation of the translation: Below 24262 the Comp is in a new BEAR MARKET! 😱
Ooooh... that's the scary scenario... but it's just a scenario.
Indecision, remember? The market can't decide whether it wants to add or reduce risk here.
A close back above the STTR / 26049 would be a significant step in further righting the ship. Ideally, it occurs on a return to rising peaks and rising troughs — signalling a return to BTD + FOMO + HOFU. And probably most importantly, we see at least one more monster demand side candle, as big as Monday's or better — to really seal the deal on a return to demand side control.
If those signals are observed, then it's Santa Claus rally sort of stuff. 🎅 Let's Ho-Ho-Hope so!
View
I'm at 1/3RP on US stocks (RP = Risk Position – it reflects my personal allowable capital allocation limit for my investments in US stocks. So 1/2RP is 50%, 2/3RP is 67% and FRP is 100%).
Key Levels
The long term trend ribbon is the closest (dynamic) zone of supply (presently 24911-25682) but the short term trend ribbon (presently 25770-26026) is likely the critical go-no-go for the current short term downtrend. There appears to be a substantial zone of potential latent demand between 23722-24425.
S&P/ASX 200 (XJO)
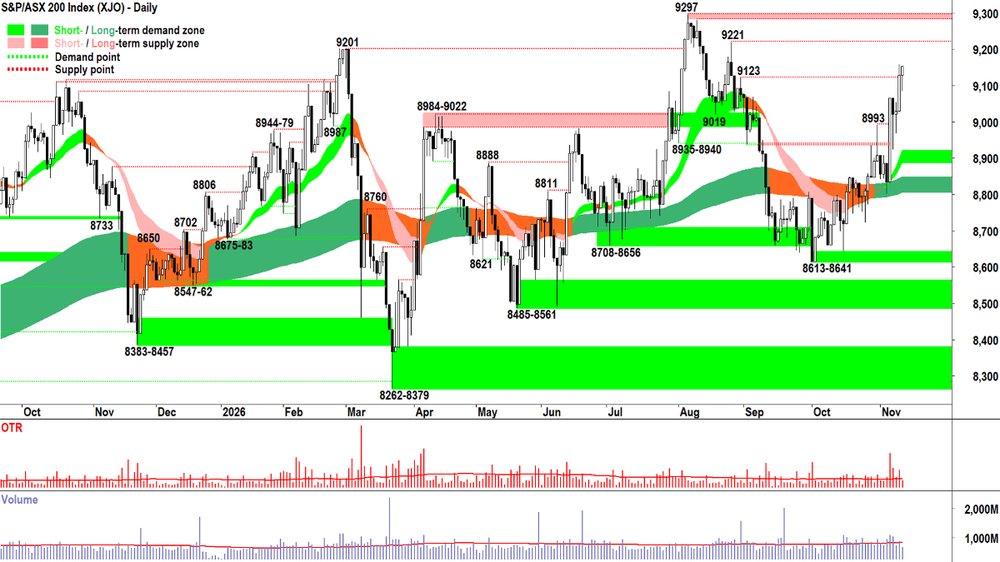
S&P/ASX 200 (XJO) chart
Analysis
Anyone at all surprised about today's candle? More specifically, the downward pointing shadow and close smack-bang on the candle's high? 🤔
(Note also the closing price (juicing) auction bump! 🧃)
Downward pointing shadows are the building blocks of an uptrend, as are white bodies. They are the direct manifestation of the pervasive latent excess demand that's been prevalent in the system for weeks now.
Trends: ST/LT Trend ⬆️/⬆️ ✅
Price action: Rising peaks & rising troughs (BTD, FOMO, HOFU) ✅
Candles: Predominantly demand side in nature (white bodies and or downward pointing shadows) ✅
Volatility: Low downside vs high upside ✅
Volume: Above average on recent demand side bars suggests supply removal ✅
✅✅✅✅✅ = MOTN P⬆️
So then, given how the checklist looks at the end of today's candle, is it a case of: Date with destiny for the OTP?
It certainly feels that way.
Bring it on, I say. But, steady as she goes in the meantime. I like the current 2/3RP setting. Let me see how the candles land in the 9221-9297 supply zone before I decide upon adding more RP.
View
I am at 2/3RP on Australian shares (i.e., 67% invested vs 33% cash, with some of the invested portion allocated to shorts). Happy to use the full risk allocation if I can find suitable setups.
Key Levels
9221-9297 is the closest zone of supply. The short term trend ribbon is the closest zone of (dynamic) demand (presently 8886-8921).
(Glossary of acronyms! Old Tin Pot (OTP): S&P/ASX 200 | MOTN: More Often Than Not | FOMO: Fear Of Missing Out | HOFU: Holding On For Upside | BTD: Buy The Dip | NUTE: No Urgency To Enter | FOHO: Fear Of Holding On | STR: Sell The Rally | RP: Risk Position | FFS: Fund Flow Shenanigans!)
***CHARTWATCH LIVE — NEW VIDEO DROPPED!!! 🚨📺***
ChartWatch LIVE Webinars – WEEKLY Wednesday's @ 12pm AEDT
Learn more about technical analysis and trend following through real case studies on ASX stocks. Australia's premier technical analyst, Carl Capolingua, shares his unique insights on stocks as requested by viewers. Ask about a company in your portfolio or anything related to trading and investing and get Carl's expert opinion.
Places are limited so >REGISTER NOW!<
Economy
TODAY
There weren't any major economic news announcements in our time zone today.
LATER THIS WEEK
WEDNESDAY
00:30 USA October Core CPI (+0.2% m/m forecast vs +0.3% m/m in September)
THURSDAY
00:00 USA All Day — markets closed for Veterans Day
FRIDAY
02:30 AUS CB Leading Index m/m
05:01 USA 30-year bond auction
SATURDAY
00:30 USA October Core PPI (+0.3% m/m forecast vs +0.7% m/m in September)
Interesting Movers
Trading higher
- IDP Education (IEL) $2.57+16.3%
Announced that it has received an unsolicited takeover bid from private equity giant Blackstone, valuing the company at $835 million. The $3-per-share cash offer is the third Blackstone has made, after earlier $2.30 and $2.50 offers were rejected. Management said that the IEL board is considering the revised proposal.
- Metallium (MTM) $0.27+10.2%
No news. Performance reflected general strength in the broader critical minerals sector. Even after today's rally, MTM is down around 75% in 2026. 📉
- Life360 Inc (360) $20.81+10.1%
Rebounded after yesterday's heavy post-Q3 results sell-off. Broker coverage today was generally supportive: Bell Potter, Ord Minnett and Citi retained buy ratings; Morgan Stanley stayed at overweight; but Macquarie downgraded to neutral from outperform.
- Elevra Lithium (ELV) $4.07+9.7%
No news. Performance reflected general strength in the broader critical minerals sector.
- Core Lithium (CXO) $0.27+8.0%
No news. Performance reflected general strength in the broader critical minerals sector.
- Sunrise Energy Metals (SRL) $14.00+7.7%
No news. Performance reflected general strength in the broader critical minerals sector.
- Monadelphous Group (MND) $34.99+7.2%
No news today. Continued positive response to yesterday's business update. Bell Potter and Morgans both upgraded their ratings to buy from hold.
- NRW Holdings (NWH) $6.91+6.5%
Announced that its wholly owned subsidiary Fredon was awarded a ~$240 million electrical services contract by Shape for a data centre project. Management called the contract "significant".
- FDC Consolidated Holdings (FDC) $3.66+3.5%
Issued a trading update and FY27 guidance update. Management upgraded annual revenue and EBIT guidance by 5–10%, revenue guidance to $2–$2.08 billion, and EBIT guidance to $105–$110 million. EBIT margin guidance retained at ~5.3%. Management confirmed new contracts increased work in hand to $2.85 billion as at October 31 (up 14% vs July quarter).
Trading Lower
- GQG Partners Inc. (GQG) $0.78-19.6%
Announced its funds under management (FUM) to the end of October. $US6.7 billion was withdrawn from the company's funds last month, taking total outflows for this calendar year to $US32.9 billion. Total FUM fell from $US149.2 billion to $US131.6 billion. GQG is one of the most featured stocks in the ChartWatch ASX Scans Downtrends List. 📉
- DPM Metals Inc. (DPM) $55.73-5.7%
No news. Performance reflected general weakness in the broader precious metals sector following sharp falls in commodity prices overnight (bond yields spiked on hotter than expected US CPI / inflation data).
- Black Cat Syndicate (BC8) $0.66-5.0%
No news. Performance reflected general weakness in the broader precious metals sector.
- PEXA Group (PXA) $7.14-3.4%
Released a trading update at its AGM held today. Management slashed 2026-27 forward guidance citing consecutive interest rate rises, tax changes, and a decline in property prices that continue to impact transfer volumes. Updated revenue guidance $355–$380 million (vs previous $385–$415 million). EBITDA margins revised down to 29–31.5% from previous guidance of 31.5–33.5%.
- Domino's Pizza Enterprises (DMP) $22.19-0.3%
Provided a trading update at its AGM held today. Management noted that it had slowed the rate of sales declines: group same-store sales down 4.6% financial year to day (vs 5.8% over the first eight weeks). Same-store sales fell 2.1% in the second quarter so far, but this is an improvement on the 5.5% decline in Q1. “Still negative, but improving." said CEO Andrew Gregory who noted that Australian and Dutch divisions were tracking ahead of Q2.
Broker Moves
Company | Broker | Action | Rating | Price Target |
|---|---|---|---|---|
360Life360 Inc | Bell Potter | Retained | Buy | $30.00(from $32.00) |
| Citi | Retained | Buy | $27.15 | |
| Macquarie | Retained | Outperform | $20.20(from $30.10) | |
| Morgan Stanley | Retained | Overweight | $31.75(from $31.50) | |
| Ord Minnett | Retained | Buy | $29.40 | |
AMCAmcor Plc | Citi | Retained | Buy | $72.00(from $74.00) |
AMIAurelia Metals | Ord Minnett | Retained | Buy | $0.57(from $0.58) |
APEEagers Automotive | Ord Minnett | Retained | Buy | $20.30(from $28.00) |
BGDBarton Gold Holdings | Canaccord Genuity | Retained | Speculative Buy | $2.30 |
CBACommonwealth Bank of Australia | Citi | Retained | Sell | $141.00 |
| UBS | Retained | Sell | $135.00 | |
CDACodan | Bell Potter | Retained | Buy | $73.00 |
| UBS | Upgraded | Buy(from Neutral) | $70.35(from $68.50) | |
DOWDowner EDI | Macquarie | Retained | Outperform | $8.30(from $8.90) |
EBREBR Systems Inc | Bell Potter | Retained | Speculative Buy | $0.30(from $0.20) |
FLTFlight Centre Travel Group | Citi | Retained | Neutral | $13.20 |
| UBS | Retained | Buy | $14.10 | |
GHMGolden Horse Minerals | Canaccord Genuity | Retained | Speculative Buy | $1.50 |
GMGGoodman Group | Citi | Retained | Buy | $40.00 |
IAGInsurance Australia Group | Citi | Retained | Buy | $8.80 |
| Macquarie | Retained | Neutral | $8.20 | |
| UBS | Retained | Buy | $9.10 | |
LNWLight & Wonder Inc. | Morgans | Retained | Buy | $165.00(from $174.00) |
MNDMonadelphous Group | Bell Potter | Upgraded | Buy(from Hold) | $36.00(from $31.00) |
| Morgans | Upgraded | Buy(from Hold) | $38.50(from $35.80) | |
NSTNorthern Star Resources | Macquarie | Retained | Neutral | $25.00 |
NWHNRW Holdings | UBS | Retained | Buy | $8.50 |
NXGNexGen Energy (Canada) | UBS | Retained | Buy | $17.50(from $18.50) |
PDNPaladin Energy | Morgan Stanley | Retained | Overweight | $9.95 |
PHXPharmX Technologies | Bell Potter | Initiated | Speculative Buy | $0.20 |
PMTPMET Resources Inc | Canaccord Genuity | Retained | Speculative Buy | $1.25 |
S32South32 | Morgan Stanley | Retained | Equal Weight | $5.20 |
SHVSelect Harvests | Ord Minnett | Retained | Buy | $6.00 |
SLCSuperloop | Macquarie | Upgraded | Outperform(from Neutral) | $3.60(from $3.65) |
| Morgan Stanley | Retained | Overweight | $4.00 | |
| UBS | Retained | Buy | $3.90(from $4.15) | |
SSMService Stream | Macquarie | Retained | Outperform | $2.62(from $2.90) |
SUNSuncorp Group | Macquarie | Retained | Outperform | $20.60 |
TGNTungsten Mining NL | Canaccord Genuity | Retained | Speculative Buy | $0.45 |
VGNVirgin Australia Holdings | Ord Minnett | Retained | Buy | $3.60(from $3.90) |
VNTVentia Services Group | Ord Minnett | Upgraded | Buy(from Accumulate) | $5.75(from $6.25) |
Scans
Top Gainers
Code | Company | Last | % Chg |
|---|---|---|---|
| DOC | Doctor Care Anywhere Group Plc | $0.125 | +25.00% |
| CKA | Cokal Ltd | $0.037 | +23.33% |
| M3M | M3 Mining Ltd | $0.022 | +22.22% |
| LPE | Locality Planning Energy Holdings Ltd | $0.10 | +20.48% |
| FME | Future Metals NL | $0.012 | +20.00% |
Top Fallers
Code | Company | Last | % Chg |
|---|---|---|---|
| N1H | N1 Holdings Ltd | $0.13 | -23.53% |
| NAEDA | New Age Exploration Ltd | $0.02 | -20.00% |
| GQG | GQG Partners Inc | $0.78 | -19.59% |
| NGX | NGX Ltd | $0.125 | -16.67% |
| RRE | Right Resources Ltd | $0.075 | -16.67% |
52 Week Highs
Code | Company | Last | % Chg |
|---|---|---|---|
| RHT | Resonance Health Ltd | $0.091 | +18.18% |
| FRM | Farm Pride Foods Ltd | $0.305 | +17.31% |
| AVH | Avita Medical Inc | $5.17 | +4.44% |
| BTR | Brightstar Resources Ltd | $0.74 | +3.50% |
| CHAT | Betashares Artificial Intelligence ETF | $15.15 | +2.50% |
52 Week Lows
Code | Company | Last | % Chg |
|---|---|---|---|
| NAEDA | New Age Exploration Ltd | $0.02 | -20.00% |
| GQG | GQG Partners Inc | $0.78 | -19.59% |
| VTX | Vertex Minerals Ltd | $0.073 | -13.10% |
| KNI | Kuniko Ltd | $0.015 | -11.77% |
| GED | Golden Deeps Ltd | $0.027 | -10.00% |
Near Highs
Code | Company | Last | % Chg |
|---|---|---|---|
| EXUS | Betashares Global Shares Ex US ETF | $38.15 | +1.60% |
| NDIA | Global X India Nifty 50 ETF | $65.17 | +1.97% |
| GLPR | iShares Ftse GBL Property Ex Aus (Aud Hedged) ETF | $28.35 | +1.65% |
| RHC | Ramsay Health Care Ltd | $55.94 | +0.81% |
| OZBD | Betashares Australian Composite Bond ETF | $43.46 | +0.23% |
Relative Strength Index (RSI) Oversold
Code | Company | Last | % Chg |
|---|---|---|---|
| VLS | Vita Life Sciences Ltd | $2.64 | 0.00% |
| FXG | FELIX Gold Ltd | $0.105 | +5.00% |
| SPL | Starpharma Holdings Ltd | $0.41 | -8.89% |
| IDX | Integral Diagnostics Ltd | $1.715 | -0.29% |
| VNT | Ventia Services Group Ltd | $4.99 | +3.96% |