

The ASX 200 rallied broadly as oil's 3.4% overnight plunge eased inflation fears, pared benchmark bond yields, and sent the Nasdaq to a record high — handing technology, consumer discretionary, and real estate a rare simultaneous winning session. Energy stocks were the sole major losers as oil and gas stocks tracked the crude price.
Be sure to click/scroll through for the usual reporting of the major sector and stock-specific moves, the broker responses to them, as well as all the key economic data in tonight's Evening Wrap. Also, I have detailed technical analysis on the Nasdaq Composite and the S&P/ASX 200 in today's ChartWatch.
Let’s dive in!
Today in Review
Name | Value | % Chg |
|---|---|---|
Major Indices | ||
| ASX 200 | 8,757.8 | +0.30% |
| All Ords | 8,951.0 | +0.36% |
| Small Ords | 3,418.1 | +0.75% |
| All Tech | 2,797.9 | +1.71% |
| Emerging Companies | 3,118.7 | +0.58% |
Currency | ||
| AUD/USD | 0.7118 | -0.01% |
US Futures | ||
| S&P 500 | 7,829.25 | +1.51% |
| Dow Jones | 52,453.0 | -0.04% |
| Nasdaq | 30,781.0 | +2.89% |
Name | Value | % Chg |
|---|---|---|
Sector | ||
| Information Technology | 1,656.9 | +2.67% |
| Consumer Discretionary | 3,502.3 | +1.29% |
| Real Estate | 3,218.4 | +0.76% |
| Health Care | 32,309.3 | +0.76% |
| Materials | 24,198.9 | +0.58% |
| Industrials | 8,005.6 | +0.58% |
| Communication Services | 1,549.4 | +0.32% |
| Financials | 9,173.5 | -0.13% |
| Consumer Staples | 12,780.5 | -0.17% |
| Energy | 10,913.7 | -1.16% |
| Utilities | 10,049.9 | -2.03% |
ASX 200 Intraday Chart
%20intraday%20chart_22%20Sep.png)
Markets
***NOTE: THIS IS MY LAST E.W. FOR A WHILE! 🏖️***
But you'll be in very good hands for about a month (yours + Kerry's!)
It's been so much fun writing the Evening Wrap, and no doubt there will be plenty of adventures for the Old Tin Pot while I'm away! All the best for your trading and investing until we catch up again... and always remember: Follow Trend + Manage Risk + Analyse, Accept, and Act 💪
The S&P/ASX 200 (XJO) finished 25.9 points higher at 8,757.8, roughly mid-range, 0.37% from its session low and 0.26% from its high. In the broader-based S&P/ASX 300 (XKO) advancers beat decliners by a solid 172 to 104.
Information Technology (XIJ) (+2.7%) was Tuesday's best sector, and for once the Nasdaq's record-high overnight close resonated locally. Lower bond yields — the direct result of falling oil easing inflation expectations — reduce the discount rate applied to long-duration technology earnings, and a Nasdaq record high likely forced some local fund managers to add exposure to a sector that's been one of the most persistent underperformers this year. Catapult Sports (CAT) (+6.1%), Nuix (NXL) (+5.0%), Megaport (MP1) (+4.3%), NextDC (NXT) (+3.8%), Life360 (360) (+2.9%), and WiseTech Global (WTC) (+2.9%) all gained.
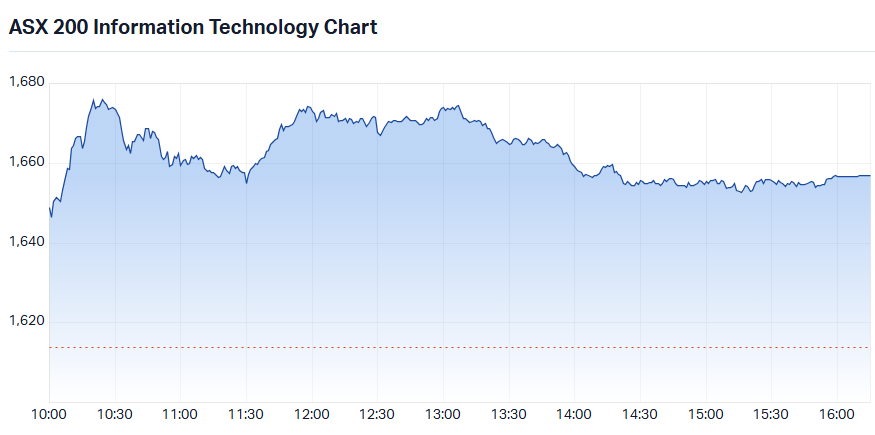
S&P-ASX 200 Information Technology Sector Index intraday chart
Consumer Discretionary (XDJ) (+1.3%) caught the same lower-oil tailwind through a different channel — falling crude prices flow directly to consumers through lower petrol prices, easing the household cost-of-living pressure that has been the sector's primary headwind all year. Beaten-down names attracted the sharpest buying: Corporate Travel (CTD) (+6.6%), Bapcor (BAP) (+6.2%), Lovisa (LOV) (+4.5%), Light & Wonder (LNW) (+4.1%), and Universal Store (UNI) (+3.3%) all rose solidly.
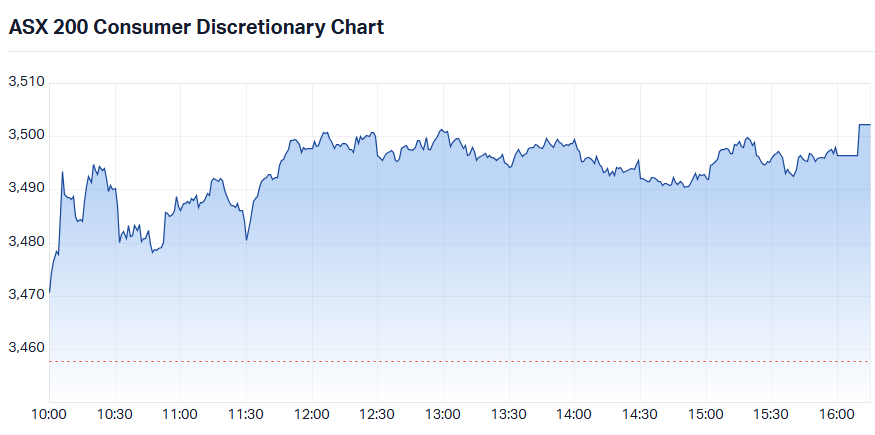
S&P-ASX 200 Consumer Discretionary Sector Index intraday chart
Real Estate (XPJ) (+0.8%) was the textbook bond-proxy beneficiary — when oil falls and inflation expectations ease, benchmark bond yields follow, and the stable income streams of property trusts become comparatively more attractive. Ingenia Communities (INA) (+5.7%), Stockland (SGP) (+1.9%), Lifestyle Communities (LIC) (+1.9%), and Goodman Group (GMG) (+1.4%) all advanced in a sector that had been under sustained pressure from elevated yields through September.
Health Care (XHJ) (+0.8%) extended a run that has now made it the ASX's most consistent performer across good days and bad. Today it caught a modest tailwind from lower yields lifting long-duration healthcare multiples, but the sector has been advancing on days where neither yields nor sentiment supported it — a signal of genuine relative strength. Telix Pharmaceuticals (TLX) (+6.5%), Starpharma (SPL) (+1.9%), and CSL (CSL) (+1.4%) all advanced.
Materials (XMJ) (+0.6%) was lifted by a broad recovery in base metals and critical minerals names. COMEX copper futures gained 0.7% to US$6.811/lb after rising 1.1% overnight, driving enthusiasm across the copper complex. Aeris Resources (AIS) (+4.1%), Aurelia Metals (AMI) (+3.1%), 29Metals (29M) (+2.6%), Sandfire Resources (SFR) (+2.1%), and Nickel Industries (NIC) (+2.5%) were highlights.
Critical minerals and rare earths names were the sector's other bright spot — Lynas Rare Earths (LYC) (+3.8%), IperionX (IPX) (+3.8%), Viridis Mining and Minerals (VMM) (+3.6%), and Iluka Resources (ILU) (+1.8%) all gained.
Financials (XFJ) (-0.1%) was marginally negative in a session where lower bond yields and easing consumer pressure should logically have been a tailwind. A notable laggard... but to be fair, ANZ (ANZ) (+0.3%) and Macquarie Group (MQG) (+0.3%) bucked the drift, while Commonwealth Bank (CBA) (-0.4%), National Australia Bank (NAB) (-0.3%), and Westpac (WBC) (-0.1%) all slipped.
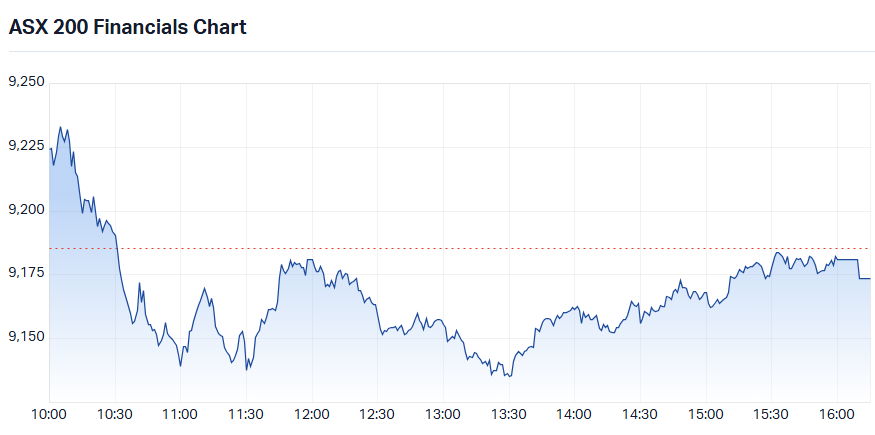
S&P-ASX 200 Financials Sector Index intraday chart
Energy (XEJ) (-1.2%) was the session's sole meaningful loser as ICE Brent crude futures plunged 3.4% overnight before recovering 1.7% to US$102.10/bbl in Asian trade — but as is so often the case, the overnight move is the one that carried (consider that the big money decides in New York and London, not in Sydney!).
Oil and gas producers Woodside Energy (WDS) (-2.4%), Karoon Energy (KAR) (-1.9%), Santos (STO) (-1.4%), and New Hope Corp. (NHC) (-1.0%) all fell. But the sector split cleanly for the second day — as refiners and distributors, whose margins improve when crude falls, moved in the opposite direction. Ampol (ALD) (+2.4%) and Viva Energy (VEA) (+0.9%) both advanced.
Today's best ASX Top 300 gainers
Company | Last Price | Change $ | Change % | 1mo % | 1yr % |
|---|---|---|---|---|---|
| Sunrise Energy Metals (SRL) | $20.48 | +$2.31 | +12.7% | +28.8% | +354.1% |
| Electro Optic Systems Holdings (EOS) | $11.32 | +$0.86 | +8.2% | +27.2% | +42.0% |
| BCI Minerals (BCI) | $0.60 | +$0.04 | +7.1% | +26.3% | +53.8% |
| Telix Pharmaceuticals (TLX) | $16.79 | +$1.03 | +6.5% | +7.5% | +11.9% |
| SKS Technologies Group (SKS) | $9.70 | +$0.59 | +6.5% | +18.1% | +163.6% |
| Catapult Sports (CAT) | $3.13 | +$0.18 | +6.1% | -11.8% | -58.0% |
| Ingenia Communities Group (INA) | $4.60 | +$0.25 | +5.7% | +8.0% | -17.4% |
| Southern Cross Electrical Engineering (SXE) | $4.84 | +$0.26 | +5.7% | +2.8% | +129.4% |
| FireFly Metals (FFM) | $1.775 | +$0.095 | +5.7% | -6.6% | +38.3% |
| Silex Systems (SLX) | $4.66 | +$0.24 | +5.4% | -8.8% | -22.5% |
| Brazilian Rare Earths (BRE) | $3.94 | +$0.19 | +5.1% | -1.5% | +4.2% |
| Bellevue Gold (BGL) | $1.625 | +$0.075 | +4.8% | -2.1% | +51.2% |
| Ramelius Resources (RMS) | $3.98 | +$0.18 | +4.7% | 0.0% | +7.6% |
| GQG Partners Inc. (GQG) | $1.135 | +$0.05 | +4.6% | -20.4% | -33.4% |
| Lovisa Holdings (LOV) | $24.37 | +$1.05 | +4.5% | +5.5% | -38.0% |
| Benz Mining Corp (BNZ) | $5.13 | +$0.22 | +4.5% | +38.3% | +199.1% |
| Megaport (MP1) | $19.66 | +$0.81 | +4.3% | +7.0% | +31.1% |
| Macmahon Holdings (MAH) | $1.125 | +$0.045 | +4.2% | +8.7% | +164.7% |
| Light & Wonder Inc. (LNW) | $112.60 | +$4.43 | +4.1% | -11.1% | -15.3% |
| Minerals 260 (MI6) | $0.895 | +$0.035 | +4.1% | +3.5% | +316.3% |
Today's worst ASX Top 300 losers
Company | Last Price | Change $ | Change % | 1mo % | 1yr % |
|---|---|---|---|---|---|
| Catalyst Metals (CYL) | $5.78 | -$0.97 | -14.4% | -15.0% | -32.7% |
| Latitude Group Holdings (LFS) | $0.875 | -$0.06 | -6.4% | -5.9% | -23.9% |
| Air New Zealand (AIZ) | $0.32 | -$0.015 | -4.5% | -7.2% | -39.6% |
| Resolute Mining (RSG) | $1.185 | -$0.055 | -4.4% | -11.6% | +30.9% |
| Origin Energy (ORG) | $11.21 | -$0.47 | -4.0% | -5.7% | -11.3% |
| 4DMedical (4DX) | $3.99 | -$0.12 | -2.9% | +4.2% | +163.4% |
| Cromwell Property Group (CMW) | $0.345 | -$0.01 | -2.8% | -16.9% | -28.9% |
| DroneShield (DRO) | $1.66 | -$0.045 | -2.6% | -9.3% | -49.8% |
| Lindian Resources (LIN) | $0.595 | -$0.015 | -2.5% | -24.7% | +138.0% |
| Woodside Energy Group (WDS) | $31.67 | -$0.77 | -2.4% | -6.2% | +38.8% |
| Metals X (MLX) | $2.07 | -$0.05 | -2.4% | +10.1% | +209.0% |
| AGL Energy (AGL) | $8.26 | -$0.19 | -2.2% | -7.0% | -5.2% |
| Dyno Nobel (DNL) | $3.93 | -$0.09 | -2.2% | +6.2% | +31.4% |
| Metrics Master Income Trust (MXT) | $1.75 | -$0.035 | -2.0% | -9.6% | -11.2% |
| The a2 Milk Company (A2M) | $6.55 | -$0.13 | -1.9% | -4.2% | -22.7% |
| Karoon Energy (KAR) | $1.805 | -$0.035 | -1.9% | -0.8% | +13.9% |
| Vulcan Energy Resources (VUL) | $2.16 | -$0.04 | -1.8% | -21.7% | -43.9% |
| Domino's Pizza Enterprises (DMP) | $18.88 | -$0.34 | -1.8% | -0.3% | +37.5% |
| Sonic Healthcare (SHL) | $19.13 | -$0.34 | -1.7% | -9.2% | -14.0% |
| St Barbara (SBM) | $0.875 | -$0.015 | -1.7% | +29.6% | +75.0% |
Chartwatch
Nasdaq Composite Index
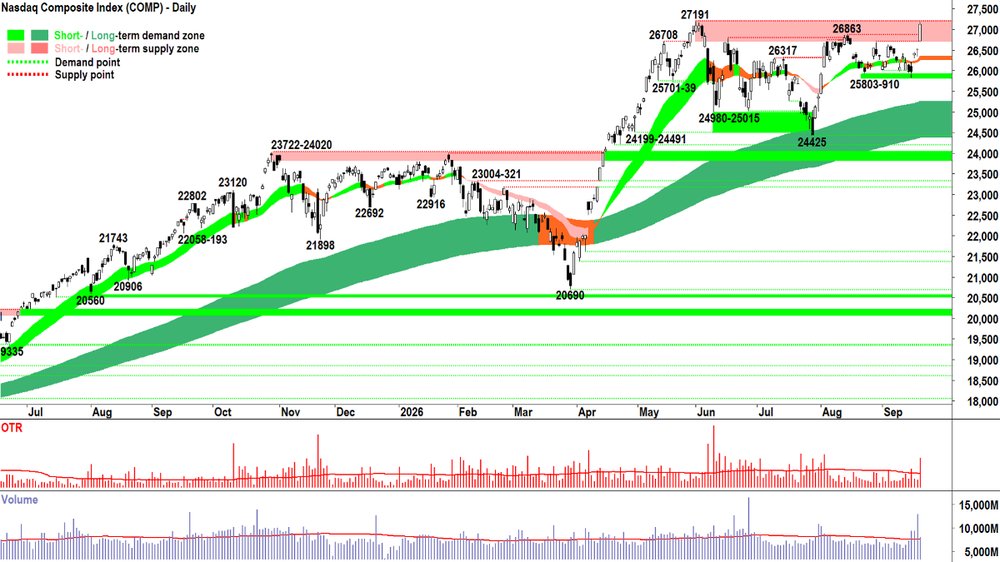
Nasdaq Composite Index chart
Analysis
What a candle for me to go out on! On a bloody rocket ship... to the MOON! 🚀
This is why I say you can never count the Comp out. It's a total BEAST and it can manufacture the most breathtaking rally from anywhere.
Doom and gloom. 😭
Or losing your mind FOMO + HOFU. 🤑
How do I describe Monday's candle? Are there enough superlatives? Gap. Run. Monster white body. High close.
The Comp was in BEAST MODE on Monday night! 💪
It didn't close right on the high, though... (0.23% from it — on a day that Comp was up 2.3% 🤏).
Still, consider the context of Monday's candle appeared: In a zone of supply that has been peskily capping upside price action for nearly four months.
Like it didn't exist. 💨
Because, well, it didn't. I think it got to the point as some stage during the session where there simply wasn't any supply. There was only a wall of FOMO demand... hitting a HOFU supply side vacuum.
And that likely explains Monday's volume. Well, it likely explains both Weds-Friday's and Monday's volume... consider:
Weds-Friday was the massive clear out of supply. Sure, Friday was also options expiry... so there's definitely some extra turnover there... but look at Wednesday and Thursday's volumes... this was a multi-day process clearing of supply, of the nervous naysayers who were foolish enough to doubt the Comp's credentials!
Monday's volume is still above average... decent supply was encountered and consumed, but we would expect that as more supply that has a low opinion of the price which can be achieved is removed — and replaced with HOFU supply — we should see volume diminish as the wall of demand hits a supply-side vacuum.
And the gap and run + monster white body? Well, you can thank FOMO for that!
Mix FOMO and HOFU together for long enough... and it could be a few-thousand point journey at least... 🤔
But it's a journey I'll be watching from the sidelines as I set off on my own little sojourn! 👋 So for the last time in a little while:
Analysis = BEAST MODE (✅), but 27191 still deserves respect (remember that 0.23%!). The price action remains a little inconsistent (higher peaks vs lower troughs), and the RUT isn't exactly shooting the lights out (remember the whip around the grounds seeks to determine if there's an external threat to our prevailing RP).
Accept = MOTN has swung decidedly back to D > S = P⬆️. There are still some nagging concerns with respect to the narrowness of the rally in risk elsewhere. But, regardless, there's enough evidence here to suggest that the Comp deserves more of my RP.
View
Act = Moving back to 2/3RP on the Comp. A stroll, not panicking back in. A prudent increase. Still a few strategic shorts about the place. Wait and see on the rest (i.e., requires a close above 27191, then preferably a test and hold of what, by then, will be the new demand zone!). (RP = Risk Position – it reflects my personal allowable capital allocation limit for my investments in US stocks. So 1/2RP is 50%, 2/3RP is 67% and FRP is 100%).
Key Levels
267191 is the closest key point of supply vs 25803-910 as the closest key zone of demand.
S&P/ASX 200 (XJO)
%20chart_22%20Sep.png)
S&P/ASX 200 (XJO) chart
Analysis
No beast mode here! 🤦
Can I offer: Subdued Mode?
Or just plain old OTP Mode? 🤣
It is what it is — and hey — we all have a choice as to where we allocate our capital.
But, crazier things have happened in markets than the OTP bashing out a few more "at least it wasn't down" candles around the 8708-8656 demand zone — and then finding a way to avoid what looked like a sure-fire bet to fall.
It must contend with what will likely be a stubborn zone of supply sitting within the trend ribbons, presently at 8798-8903 on a combined basis.
I couldn't add RP back until I saw a strong demand side showing in price action and candles that closed confidently towards the very top end of that range — so, a return to:
Rising peaks (if I squint, I can confirm that today's higher high and higher low logged yesterday as a higher trough to the 15-Sep trough of 8657).
A return to a predominance of confident demand side candles (i.e., those with long white bodies and or long downward pointing shadows — the last couple are hardly inspiring!).
Ideally, at least the long term trend ribbon looking like its acting as a zone of dynamic demand (i.e., a trough that forms within, but preferably above it's boundaries).
Hey, it could also just flop back down and break through 8708. That would be more in keeping with the prevailing trends, price action, and candles.
In short... my last bit of analysis on the OTP for a while is much the same as it has been for a while: there's little here to suggest strong demand side control, and therefore there's little to warrant putting a large portion of my cash at risk. 😔
View
I am 1/3RP on Australian shares (i.e., 67% cash vs 33% invested, with some of the invested portion allocated to shorts).
Key Levels
8708-8656 is the critical zone of demand, while the long term trend ribbon (presently 8798-8860) is the the biggest barrier the OTP will have to contend with on the way back up.
(Glossary of acronyms! Old Tin Pot (OTP): S&P/ASX 200 | MOTN: More Often Than Not | FOMO: Fear Of Missing Out | HOFU: Holding On For Upside | BTD: Buy The Dip | NUTE: No Urgency To Enter | FOHO: Fear Of Holding On | STR: Sell The Rally | RP: Risk Position | FFS: Fund Flow Shenanigans!)
ChartWatch LIVE Webinars – WEEKLY Wednesday's @ 12pm AEDT
Learn more about technical analysis and trend following through real case studies on ASX stocks. Australia's premier technical analyst, Carl Capolingua, shares his unique insights on stocks as requested by viewers. Ask about a company in your portfolio or anything related to trading and investing and get Carl's expert opinion.
Places are limited so >REGISTER NOW!<
Economy
TODAY
RBA Governor Michelle Bullock chat with Committee for Economic Development of Australia:
Risks are still "materialising" on the inflation front, and there still remains too much excess demand in the Australian economy.
First round effects (i.e., the spike in prices) could trigger second round effects (i.e., workers demand higher wages, causing businesses to jack up prices even more...).
In short... she didn't give much away as usual, but clearly hinted that she still feels that more needs to be done to ensure that inflation doesn't become more entrenched... Logically, this could require a higher cash rate.
LATER THIS WEEK
WEDNESDAY
09:00 AUS September Flash Purchasing Managers Index (PMI)
Manufacturing: previous was 52.0
Services: previous was 53.2 (revised up from 52.9)
23:45 USA September Flash Purchasing Managers Index (PMI)
Manufacturing: 53.4 forecast vs 53.9 in August (revised up from 53.2)
Services: 56.0 forecast vs 56.5 in August (revised down from 56.8)
THURSDAY
11:30 AUS August Employment
Employment change: +20,900 m/m forecast vs -15,800 m/m in July
Unemployment rate: 4.5% unchanged
FRIDAY
22:30 USA August Core Durable Goods Orders (+0.5% m/m forecast vs +0.4% m/m in July)
Interesting Movers
Trading higher
- Global Lithium Resources (GL1) $1.00+49.6%
UAE-based Titan Australia Mining will acquire all of the shares in GL1 for $1.15 per share in cash. 💰💰💰
- Waratah Minerals (WTM) $0.80+31.4%
Announced drilling results from the company's Spur Gold Discovery, New South Wales. Management said that multiple high-grade intercepts were encountered that will potentially help define four zones of high-grade mineralisation. Highlights included: 19 m @ 15.62 g/t Au from 541 m and 10 m @ 28.93 g/t Au from 550 m.
- IDP Education (IEL) $2.16+20.7%
No news. Second strong day of gains from a stock that has been consistently one of the worst for several years now... 🤔
- American Tungsten and Antimony (AT4) $0.07+13.3%
No news. Generally strong day for critical minerals stocks today.
- Sunrise Energy Metals (SRL) $20.48+12.7%
No news. Generally strong day for critical minerals stocks today.
- Alpha HPA (A4N) $0.59+9.3%
No news. Generally strong day for critical minerals stocks today.
- Wildcat Resources (WC8) $0.31+7.8%
No news. Generally strong day for lithium stocks today on the back of the GL1 takeover. Benchmark lithium carbonate futures also bouncing for a second day.
- Bellevue Gold (BGL) $1.62+4.2%
Announced its FY26 full year results. NPAT: f $7.1 million. FY26 production: 143.5koz vs guidance 130-150koz. FY26 all-in-sustaining cost (AISC): A$2,827/ oz vs guidance A$2,600-A$2,900/oz.
- Brainchip Holdings (BRN) $0.14+3.7%
Released a new corporate presentation.
Trading Lower
- MaxiPARTS (MXI) $1.87-20.1%
Ares Management Asia Singapore has withdrawn its offer to acquire the company after conducing due diligence. MXI management said that it had "observed positive trading conditions through the first few months of FY27" and that it continues to "anticipate further growth and financial improvements in FY27".
- Tungsten Mining NL (TGN) $0.33-15.6%
What do you do when your share price rockets? A $50 million placement (before costs) to institutional and professional investors at $0.32 (vs last traded price at $0.385). Management said that proceeds of the capital raise would be used for the development of the company's Watershed Tungsten Project project in Queensland.
- Catalyst Metals (CYL) $5.78-14.4%
No news since yesterday's Cinnamon Mine Resource/Reserves update. Big dip in a sector that was broadly higher today... 🤔
Broker Moves
Company | Broker | Action | Rating | Price Target |
|---|---|---|---|---|
ALDAmpol | Morgan Stanley | Retained | Overweight | $44.00 |
ANZANZ Group Holdings | Macquarie | Retained | Neutral | $33.50 |
BENBendigo and Adelaide Bank | Macquarie | Retained | Underperform | $9.00 |
BOQBank of Queensland | Macquarie | Retained | Underperform | $5.50 |
CBACommonwealth Bank of Australia | Macquarie | Retained | Underperform | $112.00 |
CSCCapstone Copper Corp. | Citi | Retained | Buy | $17.30(from $18.70) |
CYLCatalyst Metals | UBS | Retained | Buy | $9.25(from $10.00) |
EVNEvolution Mining | Citi | Retained | Neutral | $14.20(from $13.90) |
EVTEVT | Citi | Retained | Buy | $17.55 |
FRSForrestania Resources | Bell Potter | Retained | Speculative Buy | $1.05(from $1.25) |
GL1Global Lithium Resources | Ord Minnett | Upgraded | Buy(from Hold) | $0.85(from $0.60) |
HSNHansen Technologies | Ord Minnett | Retained | Buy | $5.26(from $5.67) |
JDOJudo Capital Holdings | Macquarie | Retained | Outperform | $1.65 |
MAHMacmahon Holdings | Ord Minnett | Retained | Hold | $1.10(from $1.00) |
MGRMirvac Group | Morgan Stanley | Retained | Equal Weight | $2.05 |
MPKMany Peaks Minerals | Canaccord Genuity | Retained | Speculative Buy | $1.90 |
NABNational Australia Bank | Macquarie | Retained | Neutral | $39.00 |
PPTPerpetual | Citi | Retained | Neutral | $17.50(from $20.25) |
RMSRamelius Resources | Macquarie | Retained | Neutral | $4.00 |
| Ord Minnett | Retained | Buy | $4.55(from $4.45) | |
RSGResolute Mining | Macquarie | Downgraded | Neutral(from Outperform) | $1.35 |
SGMSims | Ord Minnett | Retained | Lighten | $21.00 |
SGPStockland | Morgan Stanley | Retained | Equal Weight | $5.10 |
TLXTelix Pharmaceuticals | UBS | Retained | Buy | $22.00 |
TPWTemple & Webster Group | Citi | Retained | Neutral | $4.35 |
TUATuas | Citi | Retained | Buy | $3.35(from $9.95) |
TWETreasury Wine Estates | Citi | Retained | Buy | $6.95 |
TWRTower | Citi | Retained | Buy | $1.80 |
VEAViva Energy Group | Morgan Stanley | Retained | Equal Weight | $2.88 |
WBCWestpac Banking Corporation | Macquarie | Retained | Underperform | $30.00 |
Scans
Top Gainers
Code | Company | Last | % Chg |
|---|---|---|---|
| GL1 | Global Lithium Resources Ltd | $0.995 | +49.62% |
| VR8 | Vanadium Resources Ltd | $0.075 | +41.51% |
| PRB | Parbo Resources Ltd | $0.27 | +35.00% |
| WTM | Waratah Minerals Ltd | $0.795 | +31.41% |
| E79 | E79 Gold Mines Ltd | $0.034 | +25.93% |
Top Fallers
Code | Company | Last | % Chg |
|---|---|---|---|
| LMG | Latrobe Magnesium Ltd | $0.015 | -21.05% |
| MCO | Myeco Group Ltd | $0.018 | -18.18% |
| TZL | TZ Ltd | $0.027 | -18.18% |
| MXI | Maxiparts Ltd | $1.93 | -17.52% |
| CTQ | Careteq Ltd | $0.015 | -16.67% |
52 Week Highs
Code | Company | Last | % Chg |
|---|---|---|---|
| GL1 | Global Lithium Resources Ltd | $0.995 | +49.62% |
| VR8 | Vanadium Resources Ltd | $0.075 | +41.51% |
| PRB | Parbo Resources Ltd | $0.27 | +35.00% |
| NYM | Narryer Metals Ltd | $0.078 | +20.00% |
| A8G | Australasian Metals Ltd | $0.23 | +9.52% |
52 Week Lows
Code | Company | Last | % Chg |
|---|---|---|---|
| FG1 | FLYNN Gold Ltd | $0.015 | -16.67% |
| EPI | Epiminder Ltd | $0.25 | -10.71% |
| KAL | Kalgoorlie Gold Mining Ltd | $0.022 | -8.33% |
| RMY | Rma Global Ltd | $0.018 | -7.69% |
| GT1 | Green Technology Metals Ltd | $0.013 | -7.14% |
Near Highs
Code | Company | Last | % Chg |
|---|---|---|---|
| SMLL | Betashares Australian Small Companies Select ETF | $4.55 | +0.22% |
| RHC | Ramsay Health Care Ltd | $55.61 | +0.40% |
| AN3PI | Australia and New Zealand Banking Group Ltd | $102.15 | +0.29% |
| PCI | Perpetual Credit Income Trust | $1.11 | +0.91% |
| WVOL | iShares MSCI World Ex Aust Minimum Volatility ETF | $45.51 | +0.07% |
Relative Strength Index (RSI) Oversold
Code | Company | Last | % Chg |
|---|---|---|---|
| PWR | Peter Warren Automotive Holdings Ltd | $0.725 | -3.33% |
| EDV | Endeavour Group Ltd | $2.89 | -0.35% |
| VAP | Vanguard Australian Property Securities INDEX ETF | $81.84 | -0.34% |
| MRE | Metrics Real Estate Multi-Strategy Fund | $1.64 | -1.50% |
| CTD | Corporate Travel Management Ltd | $2.57 | -3.38% |
