News | Market Wraps
Evening Wrap: ASX 200 fights hard to limit losses as Lovisa and Star Entertainment slump, gold stocks only shining light
The S&P/ASX 200 closed 19.9 points lower, down 0.24%.

Mentioned
The S&P/ASX 200 closed 19.9 points lower, down 0.24%.
On the surface it looked like a quiet day on the benchmark S&P/ASX 200, a modest 0.24% fall...but this was around half a percent up from the session's low.
Lovisa (LOV) and Star Entertainment Group (SGR) were in the spotlight for the wrong reasons today – both suffering big falls. Lovisa's >10% decline came at the hands of a rating downgrade and price target cut from major broker UBS, while Star provided a disappointing update on its present liquidity (hint: it's rapidly running out of 💰!)
Gold stocks were about the only place to hide today, but losses were limited in the broader market, with Consumer stocks some of the hardest hit despite strong retail sales data.
Click/scroll through for the usual reporting of the major sector and stock-specific moves, the broker responses to them, as well as all the key upcoming economic data in tonight's Evening Wrap.
Also, I have detailed technical analysis on Gold and Brent Crude Oil in today's ChartWatch.
Let's dive in!
Today in Review
Thu 09 Jan 25, 4:56pm (AEST)
Name | Value | % Chg |
|---|---|---|
Major Indices | ||
| ASX 200 | 8,329.2 | -0.24% |
| All Ords | 8,577.8 | -0.25% |
| Small Ords | 3,119.4 | -0.70% |
| All Tech | 3,856.8 | -0.49% |
| Emerging Companies | 2,307.2 | -0.42% |
Currency | ||
| AUD/USD | 0.62 | -0.25% |
US Futures | ||
| S&P 500 | 5,948.0 | -0.19% |
| Dow Jones | 42,819.0 | -0.14% |
| Nasdaq | 21,319.75 | -0.19% |
Name | Value | % Chg |
|---|---|---|
Sector | ||
| Utilities | 9,101.8 | +0.67% |
| Materials | 16,222.9 | +0.07% |
| Health Care | 46,068.0 | +0.01% |
| Communication Services | 1,654.7 | -0.14% |
| Real Estate | 3,865.6 | -0.23% |
| Financials | 8,887.6 | -0.26% |
| Consumer Discretionary | 3,987.6 | -0.35% |
| Energy | 8,875.7 | -0.36% |
| Information Technology | 2,781.2 | -0.46% |
| Consumer Staples | 11,734.6 | -0.81% |
| Industrials | 7,730.2 | -0.93% |
Markets

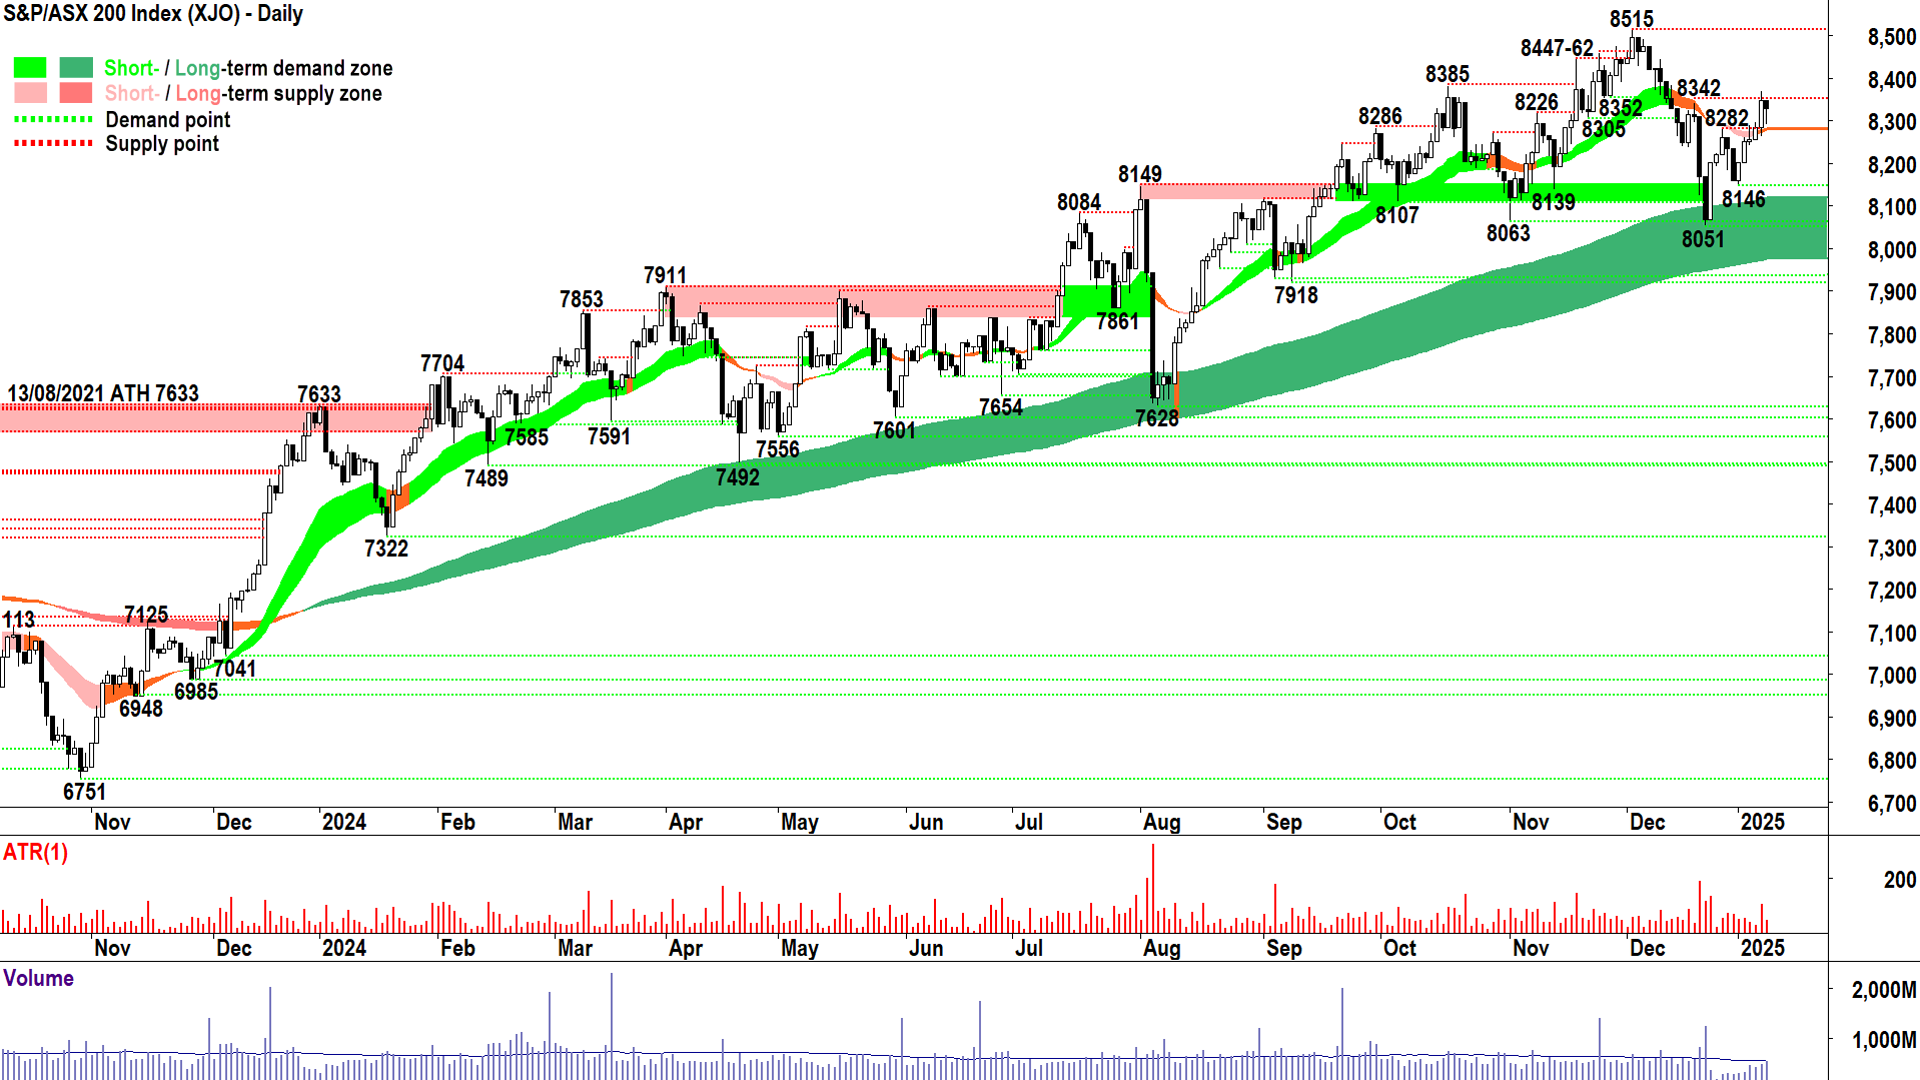
ASX 200 Session Chart
The S&P/ASX 200 (XJO) finished points lower at 8,329.2, 0.45% from its session low, and admirably given how the day started, just 0.25% from its high. Despite the fighting performance in the benchmark, in the broader-based S&P/ASX 300 (XKO), advancers lagged decliners by a dismal 80 to 200.
A bit of a nothing day today on the surface, but probably a good one to dodge in terms of five up-days, lousy leads from the US, and another rise in long term risk-free yields...we were kind of destined to be down today but in many ways we weren't.

S&P/ASX 200 (XJO) chart - It's always reassuring to see those downward pointing shadows! (click here for full size image)
I say this because the 0.45% rally from today's low creates a downward pointing shadow on the XJO chart – which we know is associated with latent excess demand. Given all the uncertainties and headlines about overvaluations, Trump tariffs, and general 2025 doom and gloom scenarios, it's always reassuring to see those downward pointing shadows! 🤞
Company | Last Price | Change $ | Change % | 1mo % | 1yr % |
|---|---|---|---|---|---|
Ora Banda Mining (OBM) | $0.715 | +$0.055 | +8.3% | +5.9% | +197.9% |
Arcadium Lithium (LTM) | $9.13 | +$0.67 | +7.9% | +15.0% | -12.1% |
Firefly Metals (FFM) | $0.960 | +$0.05 | +5.5% | -7.2% | +51.2% |
Pro Medicus (PME) | $269.38 | +$10. | +3.9% | +0.5% | +200.1% |
Bravura Solutions (BVS) | $2.28 | +$0.07 | +3.2% | +3.2% | +188.6% |
Northern Star Resources (NST) | $16.53 | +$0.47 | +2.9% | +1.1% | +28.7% |
Select Harvests (SHV) | $4.50 | +$0.12 | +2.7% | +5.9% | +59.8% |
Newmont Corporation (NEM) | $62.72 | +$1.57 | +2.6% | -2.0% | +5.4% |
Vulcan Energy Resources (VUL) | $5.81 | +$0.14 | +2.5% | -8.1% | +129.6% |
Nanosonics (NAN) | $3.12 | +$0.07 | +2.3% | -4.6% | -24.1% |
Pinnacle Investment Management Group (PNI) | $23.63 | +$0.53 | +2.3% | -3.2% | +137.2% |
Australian Clinical Labs (ACL) | $3.58 | +$0.08 | +2.3% | -1.1% | +27.0% |
West African Resources (WAF) | $1.585 | +$0.035 | +2.3% | -1.2% | +74.2% |
Sandfire Resources (SFR) | $9.51 | +$0.21 | +2.3% | -7.0% | +40.5% |
Cleanaway Waste Management (CWY) | $2.75 | +$0.06 | +2.2% | -3.5% | +3.8% |
Netwealth Group (NWL) | $30.41 | +$0.64 | +2.2% | -0.1% | +96.6% |
De Grey Mining (DEG) | $1.910 | +$0.04 | +2.1% | 0% | +63.6% |
Evolution Mining (EVN) | $5.11 | +$0.1 | +2.0% | +0.6% | +34.8% |
Fortescue (FMG) | $17.91 | +$0.34 | +1.9% | -8.1% | -35.5% |
Bellevue Gold (BGL) | $1.080 | +$0.02 | +1.9% | -20.6% | -27.3% |
MA Financial Group (MAF) | $6.02 | +$0.11 | +1.9% | -5.5% | +7.9% |
Hub24 (HUB) | $72.96 | +$1.33 | +1.9% | -4.2% | +104.7% |
Macquarie Group (MQG) | $234.10 | +$4.04 | +1.8% | +1.4% | +31.2% |
Pexa Group (PXA) | $13.15 | +$0.22 | +1.7% | +1.9% | +22.3% |
Sims (SGM) | $12.62 | +$0.19 | +1.5% | -1.8% | -10.4% |
Best stocks on the ASX today
Company | Last Price | Change $ | Change % | 1mo % | 1yr % |
|---|---|---|---|---|---|
Westgold Resources (WGX) | $2.53 | -$0.4 | -13.7% | -13.1% | +31.8% |
Avita Medical (AVH) | $3.05 | -$0.46 | -13.1% | -21.0% | -19.1% |
Lovisa (LOV) | $26.75 | -$3.14 | -10.5% | -12.0% | +16.4% |
Appen (APX) | $2.81 | -$0.22 | -7.3% | +30.1% | +393.0% |
Droneshield (DRO) | $0.785 | -$0.055 | -6.5% | +17.2% | +112.2% |
GQG Partners (GQG) | $1.940 | -$0.13 | -6.3% | -6.7% | +15.5% |
Liontown Resources (LTR) | $0.560 | -$0.035 | -5.9% | -10.4% | -63.6% |
Clarity Pharmaceuticals (CU6) | $3.98 | -$0.24 | -5.7% | -27.9% | +97.6% |
Mesoblast (MSB) | $2.81 | -$0.15 | -5.1% | +69.3% | +886.0% |
Weebit Nano (WBT) | $2.94 | -$0.15 | -4.9% | +2.8% | -25.0% |
Nuix (NXL) | $5.90 | -$0.29 | -4.7% | -11.4% | +174.4% |
WA1 Resources (WA1) | $13.44 | -$0.6 | -4.3% | -0.4% | -8.8% |
Megaport (MP1) | $6.78 | -$0.29 | -4.1% | -12.5% | -20.3% |
Paladin Energy (PDN) | $7.95 | -$0.33 | -4.0% | +4.3% | -21.7% |
Audinate Group (AD8) | $7.01 | -$0.29 | -4.0% | -10.1% | -56.9% |
Computershare (CPU) | $33.58 | -$1.19 | -3.4% | +1.8% | +36.7% |
Boss Energy (BOE) | $2.63 | -$0.09 | -3.3% | +1.9% | -42.7% |
Reliance Worldwide Corporation (RWC) | $5.02 | -$0.16 | -3.1% | -6.3% | +17.6% |
Silex Systems (SLX) | $5.97 | -$0.19 | -3.1% | +1.0% | +47.4% |
Neuren Pharmaceuticals (NEU) | $12.08 | -$0.38 | -3.1% | -5.6% | -51.3% |
Worst stocks on the ASX today
We continue our catch up of local and global indices, commodities, bonds and more in ChartWatch this evening with a look at the charts of Gold and Brent Crude Oil.
ChartWatch
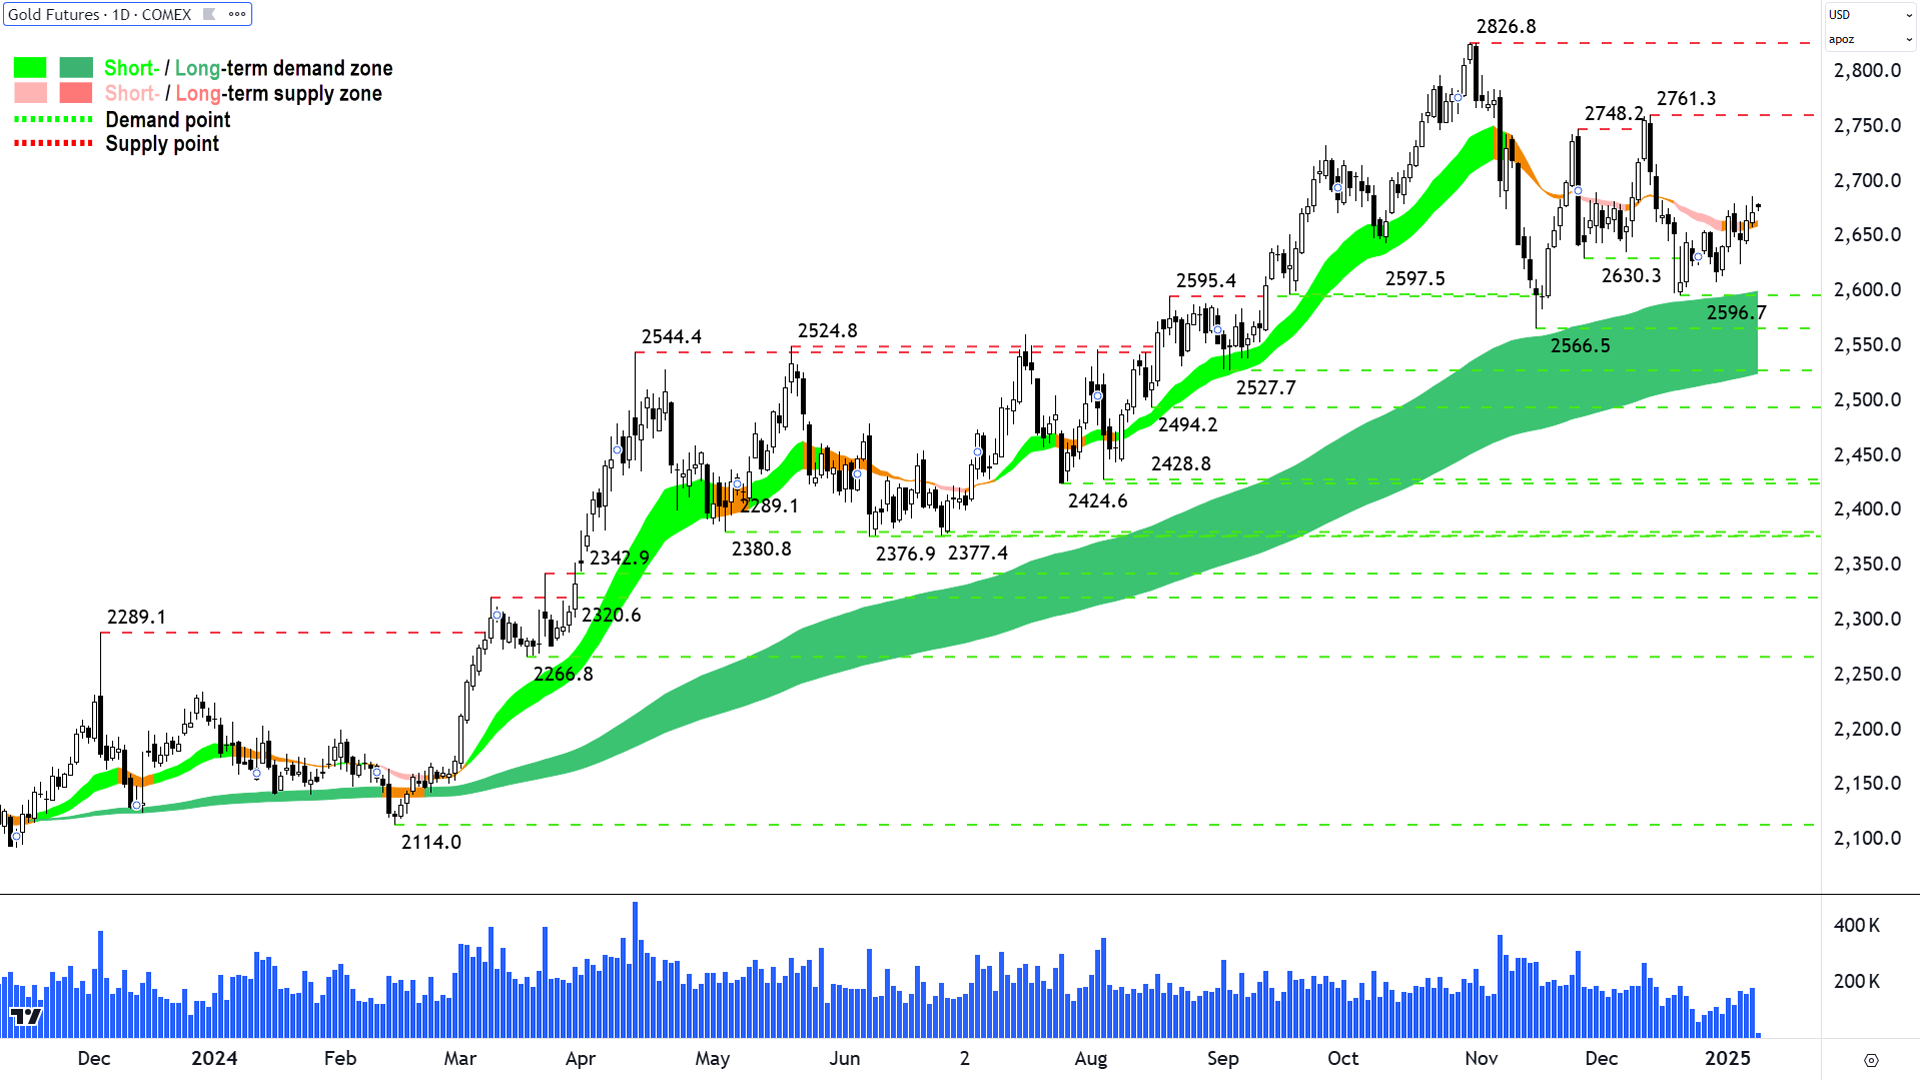
Gold Futures (Front month, back-adjusted) COMEX
%20COMEX%20Chart%209%20January%202025.png)
Gold has gone cold 🧊 as risk-free yields run hot 🔥 (click here for full size image)
The last time we covered gold was in ChartWatch in the Evening Wrap on 11 December.
In that update, just before the last massive leg up in long term risk-free rates, gold was actually starting to look good again after the Trump slump.
Gold hates higher risk-free yields. It doesn’t have a yield, and worse, you usually have to pay someone to sit on your gold with a shotgun.

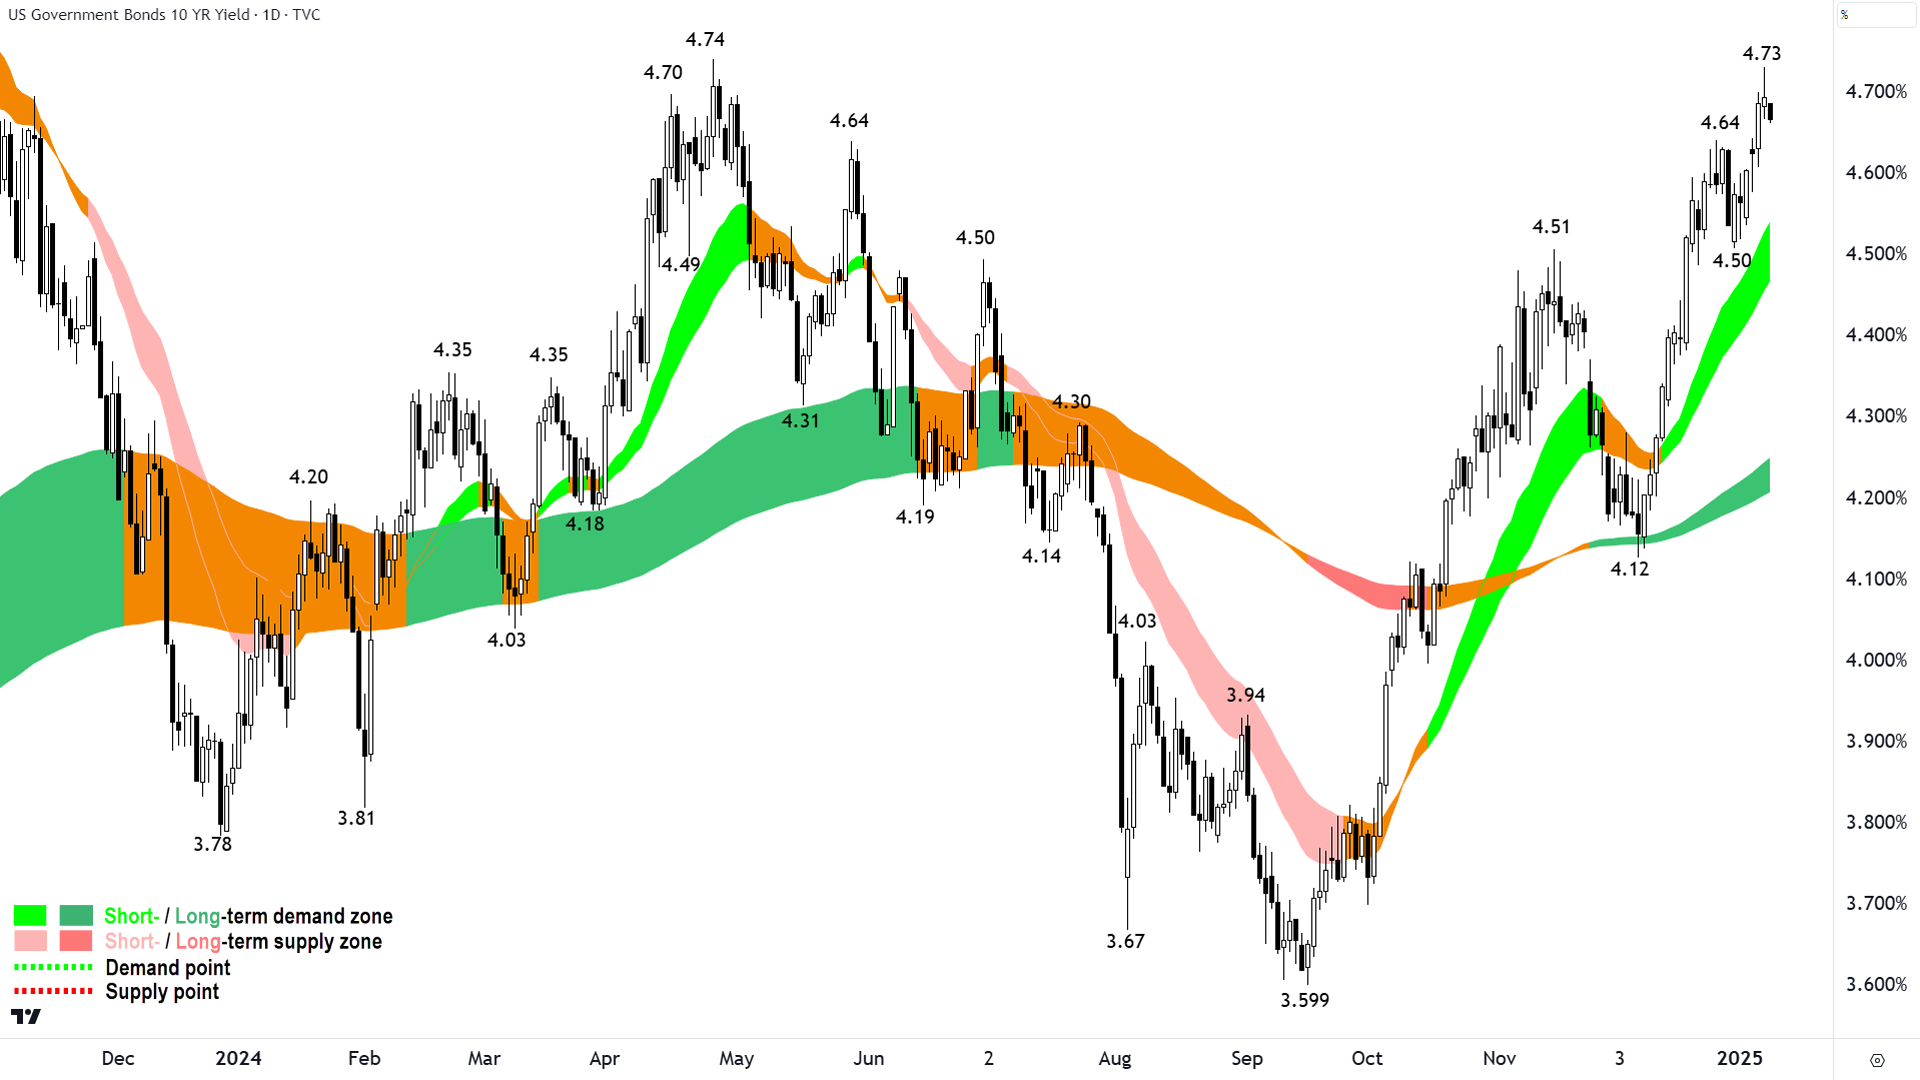
US 10-year T-Bonds, i.e., imaginary IOU’s from Uncle Sam (click here for full size image)
This means there’s a substantial opportunity cost to owning gold compared to risk-free bonds which are considered to be a competing safe haven asset class…but it depends on your definition of “safe”.
Are long term imaginary IOU’s from Uncle Sam actually safe? 🤔
Perhaps this is why gold has largely held its own during the long term yield melt-up in the US 10’s yield – which tipped an eye watering 4.73% last night…😱
As can be seen by the main above chart, gold’s short term trend is neutral, and it’s long term trend remains solidly set to the upside. In summary, Gold hasn’t prospered over the last 6 weeks, but higher rates haven’t dealt it a deathblow either.
Neutral is the obvious call here, until either:
Bullish: Close above 2761.3 (but really probably 2826.8)
Bearish: Close below 2566.5 (but really probably below the dynamic demand of the long term uptrend ribbon, presently bottoming out around 2530)
Between these, it’s likely to be more chop.
Still, it’s always worth watching candles and price action for potential early signs of a pending bullish / bearish course of action. You know the drill here:
Bullish: Candles with white bodies and or downward pointing shadows; Price action of rising peaks and rising troughs
Bearish: Candles with black bodies and or upward pointing shadows; Price action of falling peaks and falling troughs
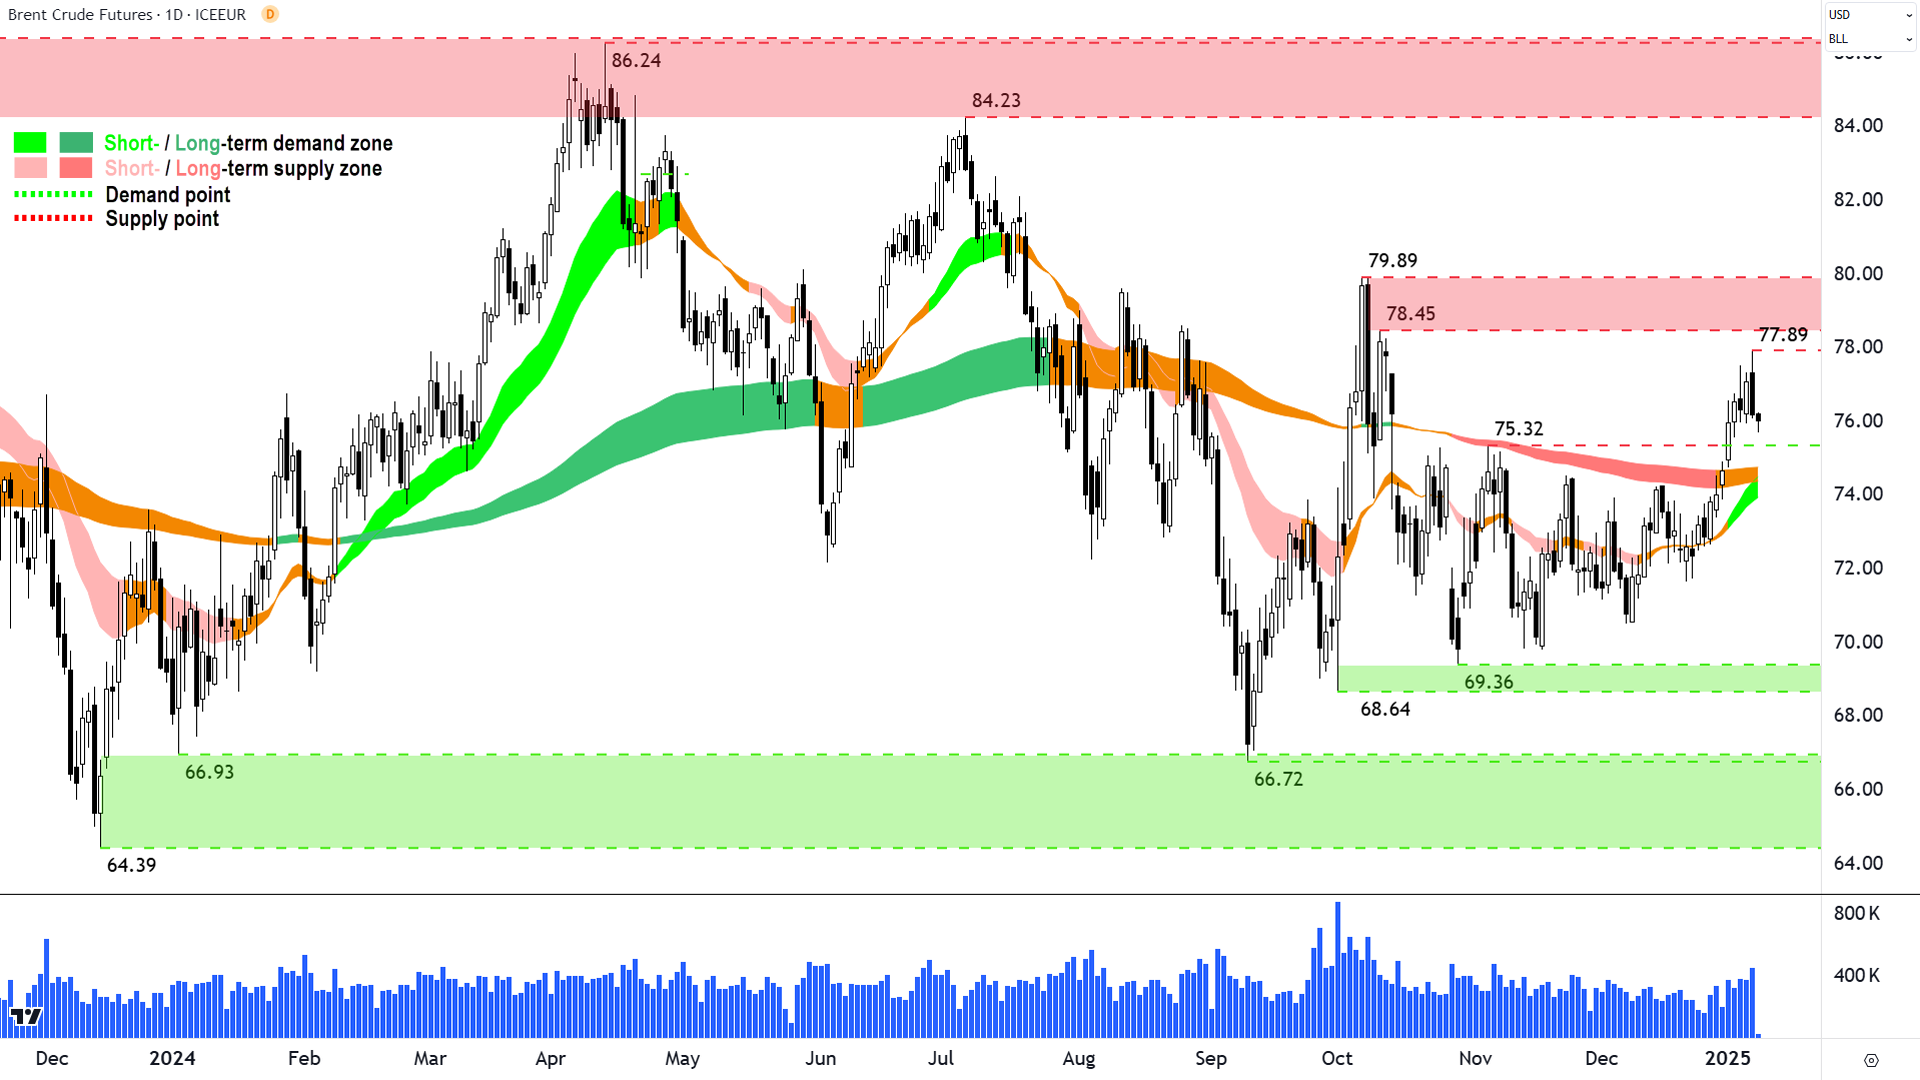
Brent Crude Oil Futures (Front month, back-adjusted) ICE
%20ICE%20Chart%209%20January%202025.png)
Brent has put a dent in overhead supply (click here for full size image)
The last time we covered Brent was in ChartWatch in the Evening Wrap on 18 December.
In that update, it was stuck in a well-defined trading range between 67.10 and 79.89, but mainly chopping in a narrower range between 67.74 and 75.32.
A New Year rally has pushed Brent through supply at 75.32, and up to challenge the major supply zone of 78.45-79.89. This zone appears to be well defended, though, as per yesterday's solid supply side candle (it’s the second last candle in the chart above).
Supply is there and its credible.
I see demand at 75.32, and if Brent can hold this level with some decent demand-side candles, there’s a good chance it can continue its new short term uptrend to retest 78.45-79.89.
That’s probably as far as we want to get ahead given circumstances, but you know to watch candles in the supply zone to determine if a future rally is sustainable (demand-side candles are a must!).
Expect both short and long term trend ribbons to also act as demand zones (dynamic), and as long as Brent continues to trade above those it’s in reasonable shape.
Below them, and or with the logging of a lower peak to 77.89 accompanied by supply-side candles – we could be cooling our heels back in the trading range for the indefinite future…
Economy
Today
11:30 AUS Retail Sales November m/m
+0.8% vs +1.0% forecast and +0.6% in October
November's gain was the biggest increase in 10 months and equates to a +3.0% p.a. growth rate, and whilst a slight miss on expectations, still indicating strong consumer activity
Fairly neutral in terms of RBA calculations, March 31- April 1 meeting still most likely timing of first 0.25% rate cut
CHN Consumer Price Index (CPI) & Producer Price Index (PPI) December y/y
CPI: +0.1% as forecast vs +0.2% in November
PPI: -2.3% vs -2.4% forecast and -2.5% in November
Slightly better than expected on the PPI, either way, there's nothing in either that prevents Beijing from proceeding with stimulus on the basis of any inflation concerns
Later this week
Saturday
00:30 USA Non-Farm Employment Change December (+154,000 forecast vs +227,000 in November)
00:30 USA Unemployment Rate (4.2% forecast vs 4.2% in November)
00:30 USA Average Hourly Earnings December m/m (+0.3% forecast vs +0.4% in November)
Latest News
Interesting Movers
Trading higher
+8.3% Ora Banda Mining (OBM) - No news, initiated at buy at Moelis, price target set at $0.84
+7.9% Arcadium Lithium (LTM) - Final hurdle to RIO takeover cleared overnight with approval of the deal by the US Committee on Foreign Investment
+5.5% Firefly Metals (FFM) - No news, generally stronger ASX gold sector today (2 decent days of gains now…) as the gold price continues to firm (see ChartWatch section above for technical analysis on gold)
+3.9% Pro Medicus (PME) - No news, rise is consistent with prevailing short and long-term uptrends, a regular in ChartWatch ASX Scans Uptrends lists 🔎📈
+3.2% Bravura Solutions (BVS) - No news, rise is consistent with prevailing short and long-term uptrends, a regular in ChartWatch ASX Scans Uptrends lists 🔎📈
+2.9% Northern Star Resources (NST) - No news, ditto generally strong ASX gold stocks today
+2.7% Select Harvests (SHV) - Becoming a substantial holder, rise is consistent with prevailing short and long-term uptrends, a recent regular in ChartWatch ASX Scans Uptrends lists 🔎📈
+2.6% Newmont Corporation (NEM) - No news, ditto generally strong ASX gold stocks today
Trading lower
-33.3% The Star Entertainment Group (SGR) - Update on cash and liquidity, fall is consistent with prevailing short and long-term downtrends, one of the most Featured stocks in ChartWatch ASX Scans Downtrends lists in 2024! 🔎📉
-13.7% Westgold Resources (WGX) - Group Production Lifts in Q2, FY25
-13.1% Avita Medical (AVH) - No news, continued negative response to yesterday's AVH Updates Expected Q4 & FY24 Revenue, FY25 Guidance
-10.5% Lovisa (LOV) - No news, downgraded to sell from neutral at UBS and price target cut to $27 from $29, fall is consistent with prevailing short-term downtrend, long-term trend is transitioning from up to down, a recent regular in ChartWatch ASX Scans Downtrends lists 🔎📉
-7.4% Chalice Mining (CHN) - No news, fall is consistent with prevailing short and long-term downtrends, a regular in ChartWatch ASX Scans Downtrends lists 🔎📉
-7.3% Appen (APX) - No news, pullback after recent strong rally as ASX tech stocks suffer second day of losses
-7.1% Cettire (CTT) - Change in substantial holding, fall is consistent with prevailing short and long-term downtrends, a regular in ChartWatch ASX Scans Downtrends lists 🔎📈
-6.5% Droneshield (DRO) - No news, consistent with recent volatility since Monday's $9.7 million Latin American contract
-6.3% GQG Partners (GQG) - No news, continued negative response to yesterday's FUM as at 31 December 2024
-6.3% Ioneer (INR) - No news, fall is consistent with prevailing short and long-term downtrends, a regular in ChartWatch ASX Scans Downtrends lists 🔎📉
-5.9% Liontown Resources (LTR) - No news, fall is consistent with prevailing short and long-term downtrends, a regular in ChartWatch ASX Scans Downtrends lists 🔎📉
-5.7% Clarity Pharmaceuticals (CU6) - No news, fall is consistent with prevailing short and long-term downtrends, a regular in ChartWatch ASX Scans Downtrends lists 🔎📉
Broker Notes
29METALS (29M)
Retained at sell at Canaccord Genuity; Price Target: $0.21 from $0.22
AGL Energy (AGL)
Retained at overweight at Morgan Stanley; Price Target: $12.88
AMP (AMP)
Retained at neutral at Macquarie; Price Target: $1.70
Retained at hold at Ord Minnett; Price Target: $1.70
Austin Engineering (ANG)
initiated at buy at Bell Potter; Price Target: $0.86
ASX (ASX)
Retained at lighten at Ord Minnett; Price Target: $60.70
Challenger (CGF)
Retained at buy at Ord Minnett; Price Target: $6.85
Computershare (CPU)
Downgraded to neutral from outperform at Macquarie; Price Target: $34.00 from $28.00
Retained at accumulate at Ord Minnett; Price Target: $36.25
Core Lithium (CXO)
Retained at neutral at Goldman Sachs; Price Target: $0.08 from $0.09
Genesis Minerals (GMD)
Downgraded to hold from buy at Moelis Australia; Price Target: $3.00 from $2.90
Hillgrove Resources (HGO)
Retained at buy at Canaccord Genuity; Price Target: $0.10
Insurance Australia Group (IAG)
Retained at accumulate at Ord Minnett; Price Target: $9.45
IGO (IGO)
Retained at sell at Canaccord Genuity; Price Target: $4.30 from $4.60
Retained at buy at Goldman Sachs; Price Target: $6.05 from $6.20
Lovisa (LOV)
Downgraded to sell from neutral at UBS; Price Target: $27.00 from $29.00
Liontown Resources (LTR)
Retained at hold at Canaccord Genuity; Price Target: $0.60 from $0.80
Retained at neutral at Goldman Sachs; Price Target: $0.71 from $0.87
Metals Acquisition (MAC)
Retained at buy at Canaccord Genuity; Price Target: $21.25 from $22.00
Magellan Financial Group (MFG)
Retained at neutral at Goldman Sachs; Price Target: $11.00 from $10.10
Metals X (MLX)
Retained at hold at Canaccord Genuity; Price Target: $0.43 from $0.45
Medibank Private (MPL)
Retained at buy at Ord Minnett; Price Target: $4.25
Macquarie Group (MQG)
Retained at overweight at Morgan Stanley; Price Target: $248.00
NIB (NHF)
Retained at buy at Ord Minnett; Price Target: $6.90
Nickel Industries (NIC)
Retained at hold at Canaccord Genuity; Price Target: $0.85 from $1.00
Ora Banda Mining (OBM)
Initiated at buy at Moelis Australia; Price Target: $0.84
Origin Energy (ORG)
Retained at underweight at Morgan Stanley; Price Target: $8.86
Pilbara Minerals (PLS)
Retained at buy at Canaccord Genuity; Price Target: $3.60 from $3.90
QBE Insurance Group (QBE)
Retained at buy at Goldman Sachs; Price Target: $22.50
Retained at hold at Ord Minnett; Price Target: $21.90
Steadfast Group (SDF)
Retained at buy at Ord Minnett; Price Target: $7.15
Sandfire Resources (SFR)
Upgraded to buy from hold at Canaccord Genuity; Price Target: $10.75 from $11.25
Summit Minerals (SUN)
Retained at accumulate at Ord Minnett; Price Target: $20.35
Scans
Top Gainers
Code | Company | Last | % Chg |
|---|---|---|---|
| MGU | Magnum Mining and Exploration Ltd | $0.013 | +30.00% |
| D3E | D3 Energy Ltd | $0.068 | +23.64% |
| VRX | VRX Silica Ltd | $0.052 | +20.93% |
| PIM | Pinnacle Minerals Ltd | $0.06 | +20.00% |
| GR8 | Great Dirt Resources Ltd | $0.16 | +18.52% |
Top Fallers
Code | Company | Last | % Chg |
|---|---|---|---|
| NTD | Ntaw Holdings Ltd | $0.17 | -34.62% |
| SGR | The Star Entertainment Group Ltd | $0.13 | -33.33% |
| MRZ | Mont Royal Resources Ltd | $0.03 | -30.23% |
| SBW | Shekel Brainweigh Ltd | $0.026 | -29.73% |
| XPN | Xpon Technologies Group Ltd | $0.011 | -21.43% |
52 Week Highs
Code | Company | Last | % Chg |
|---|---|---|---|
| AKA | Aureka Ltd | $0.17 | +17.24% |
| RXL | ROX Resources Ltd | $0.24 | +11.63% |
| VR1 | Vection Technologies Ltd | $0.039 | +11.43% |
| NFM | New Frontier Minerals Ltd | $0.02 | +5.26% |
| RBD | Restaurant Brands New Zealand Ltd | $3.75 | +5.04% |
52 Week Lows
Code | Company | Last | % Chg |
|---|---|---|---|
| NTD | Ntaw Holdings Ltd | $0.17 | -34.62% |
| SGR | The Star Entertainment Group Ltd | $0.13 | -33.33% |
| MRZ | Mont Royal Resources Ltd | $0.03 | -30.23% |
| CDD | Cardno Ltd | $0.15 | -18.92% |
| RVT | Richmond Vanadium Technology Ltd | $0.185 | -9.76% |
Near Highs
Code | Company | Last | % Chg |
|---|---|---|---|
| PCI | Perpetual Credit Income Trust | $1.165 | -0.43% |
| WVOL | Ishares MSCI World Ex Aust Minimum Volatility ETF | $41.99 | +0.41% |
| AII | Almonty Industries Inc | $1.07 | -0.47% |
| VVLU | Vanguard Global Value Equity Active ETF | $73.50 | -0.34% |
| IHD | Ishares S&P/ASX DIV Opportunities Esg Screened ETF | $14.44 | -0.41% |
Relative Strength Index (RSI) Oversold
Code | Company | Last | % Chg |
|---|---|---|---|
| GRR | Grange Resources Ltd | $0.20 | -4.76% |
| ZIM | Zimplats Holdings Ltd | $11.91 | -3.17% |
| CUV | Clinuvel Pharmaceuticals Ltd | $11.46 | -2.63% |
| NTD | Ntaw Holdings Ltd | $0.17 | -34.62% |
| SEK | Seek Ltd | $21.97 | -0.81% |
