
The ASX 200 slipped as weak Chinese economic data sent commodity prices sliding and investors fleeing mining stocks. Iron ore, copper, gold and lithium miners were hardest hit, while tech, real estate and consumer staples led the gainers.
Be sure to click/scroll through for the usual reporting of the major sector and stock-specific moves, the broker responses to them, as well as all the key economic data in tonight's Evening Wrap. Also, I have detailed technical analysis on the Nasdaq Composite and the S&P/ASX 200 in today's ChartWatch.
Let’s dive in!
Today in Review
Name | Value | % Chg |
|---|---|---|
Major Indices | ||
| ASX 200 | 9,044.7 | -0.41% |
| All Ords | 9,165.4 | -0.43% |
| Small Ords | 3,218.0 | -0.42% |
| All Tech | 3,064.2 | +0.59% |
| Emerging Companies | 2,767.8 | -0.84% |
Currency | ||
| AUD/USD | 0.6761 | -0.16% |
US Futures | ||
| S&P 500 | 7,542.5 | -0.53% |
| Dow Jones | 52,325.0 | -0.18% |
| Nasdaq | 27,724.5 | -1.11% |
Name | Value | % Chg |
|---|---|---|
Sector | ||
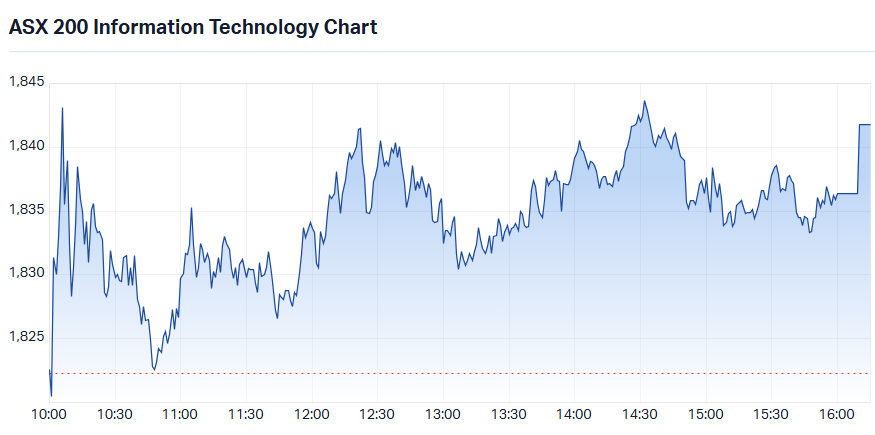
| Information Technology | 1,841.8 | +1.07% |
| Real Estate | 3,536.1 | +0.82% |
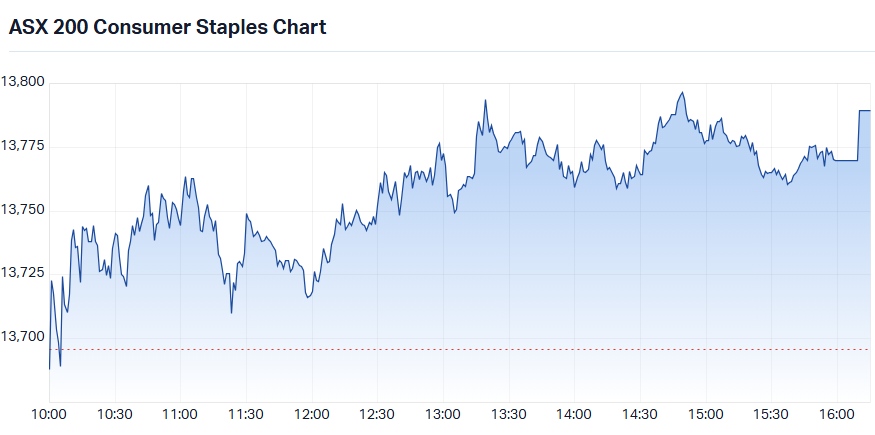
| Consumer Staples | 13,789.6 | +0.69% |
| Communication Services | 1,663.9 | +0.50% |
| Industrials | 8,616.7 | +0.30% |
| Utilities | 10,795.4 | +0.12% |
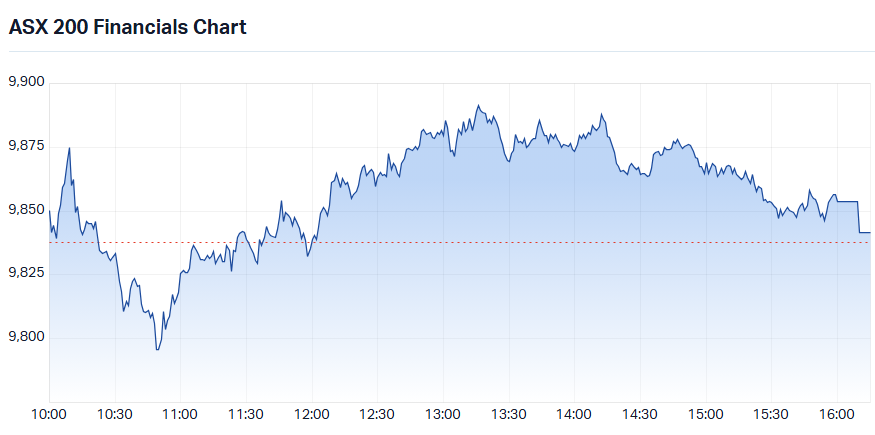
| Financials | 9,841.6 | +0.04% |
| Health Care | 35,282.7 | -0.09% |
| Consumer Discretionary | 3,811.5 | -0.15% |
| Energy | 10,354.7 | -0.34% |
| Materials | 22,414.4 | -2.17% |
ASX 200 Intraday Chart
Markets
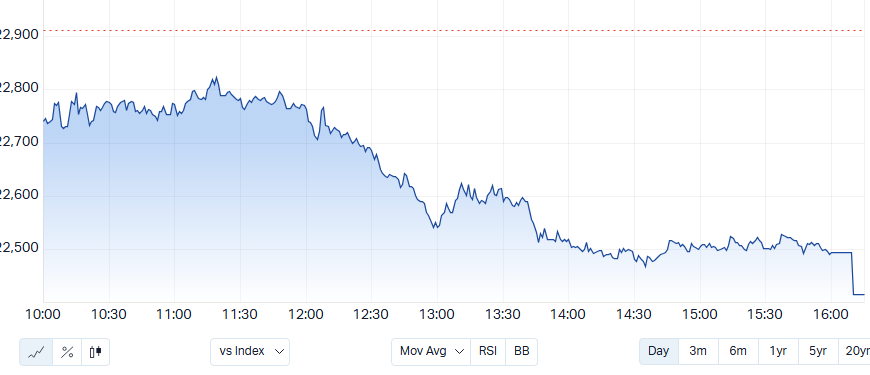
The S&P/ASX 200 (XJO) finished 37.5 points lower at 9,044.7, 0.41% from its session high and smack–bang on its session low. In the broader-based S&P/ASX 300 (XKO) advancers lagged decliners by 119 to 153.
Take a look at the intraday chart above. 15 of those 37.5 points came in the closing price auction. Why / how does this occur? Big funds had fill-by-close sell orders that were too large to complete during regular trading due to low-liquidity. They have no choice but to offer the balance of their orders at prices low enough to attract other big fundies in to soak them up.
But check out the sectors the big money went / was withdrawn from based on the intraday charts below... the results will suprise you!
S&P/ASX 200 Information Technology Sector Index (XIJ) intraday chart
Information Technology (XIJ) (+1.1%) shrugged off a weak Friday lead from the Nasdaq, where Nvidia extended losses after chief executive Jensen Huang resigned. Gains were concentrated in two major constituents that had badly lagged the Nasdaq’s AI-frenzied rise as perceived victims of the ‘SaaSpocalypse’ – fears that AI will gut demand for subscription software. Xero (XRO) (+4.7%) rallied, with last week’s positive update appearing to lure capital back into beaten-down ASX tech leaders, while WiseTech Global (WTC) (+2.8%) also gained.
A-REIT (XPJ) (+0.8%) also rose, albeit with few clear drivers today. The sector has shown resilience since the RBA’s last board meeting, with investors betting local official interest rates have peaked – a tailwind for property trusts, whose valuations and borrowing costs are highly sensitive to rates. Centuria Capital Group (CNI) (+6.5%) and HMC Capital (HMC) (+4.1%) led the gains. David Jones landlord Vicinity Centres (VCX) (+2.9%) also rallied, while GPT Group (GPT) (+1.4%) and Stockland (SGP) (+1.1%) added to the advance.
Consumer Staples (XSJ) (+0.7%) led the defensive rotation, with capital freed up from dumping miners finding its way into sectors whose earnings tend to hold up regardless of the economic cycle. Agribusiness group Elders (ELD) (+7.5%) rallied after reporting a 187% jump in full-year net profit.
S&P/ASX 200 Consumer Staples Sector Index (XIJ) intraday chart
Communication Services (XTJ) (+0.5%) was another beneficiary of the rotation, with investors favouring utility-like telcos. Utilities (XUJ) (+0.1%) edged higher on the same defensive flows.
Financials (XFJ) (+0.0%) played its typical anchor role. The banks were strong early as they soaked up rotational flows out of materials, but ebbed substantially into the close to land mixed. ANZ Group Holdings (ANZ) (+0.6%) and Commonwealth Bank of Australia (CBA) (+0.2%) finished higher, while National Australia Bank (NAB) (-0.1%) and Westpac Banking Corporation (WBC) (-0.2%) slipped.
Insurers edged higher, with Suncorp Group (SUN) (+0.5%) and QBE Insurance Group (QBE) (+0.3%) both in the green.
S&P/ASX 200 Financials Sector Index (XFJ) intraday chart
Materials (XMJ) (-2.2%) was the session’s chief casualty as investors dumped miners across the board. The leads for mining and resources stocks could not have been weaker — and reflected some poor economic data out of China today. They are, however, consistent with recent trends flagged here and in ChartWatch — and therefore should be no surprise to readers of this column!
October’s Chinese activity data missed across the board. Fixed asset investment fell 8.1% year-to-date against a forecast 7.0% decline, industrial production grew 4.8% annually (forecast 5.3%), and retail sales rose just 0.4% (forecast 0.8%), while new home prices fell again. A slight dip in unemployment to 5.1% was the lone bright spot. Weaker investment and factory activity dampens the demand outlook for the commodities China imports in bulk – much of it from Australia.
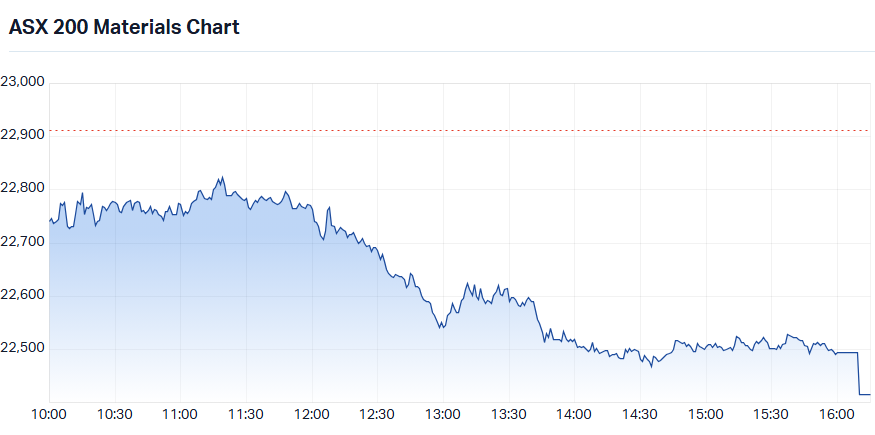
S&P/ASX 200 Materials Sector Index (XMJ) intraday chart
Iron ore miners were hit hard as SGX iron ore futures fell 1.9% to US$88.75 per tonne in the Asian session, with fears of rising Chinese iron ore stockpiles adding to the pressure. Mineral Resources (MIN) (-3.6%) and Champion Iron (CIA) (-3.4%) led the losses, with Fortescue (FMG) (-2.9%) also lower. Diversified majors BHP Group (BHP) (-2.8%) and Rio Tinto (RIO) (-2.2%) were hit through both their iron ore and copper exposures. (Every single one is a constituent of the ChartWatch ASX Scans downtrends list! 📉)
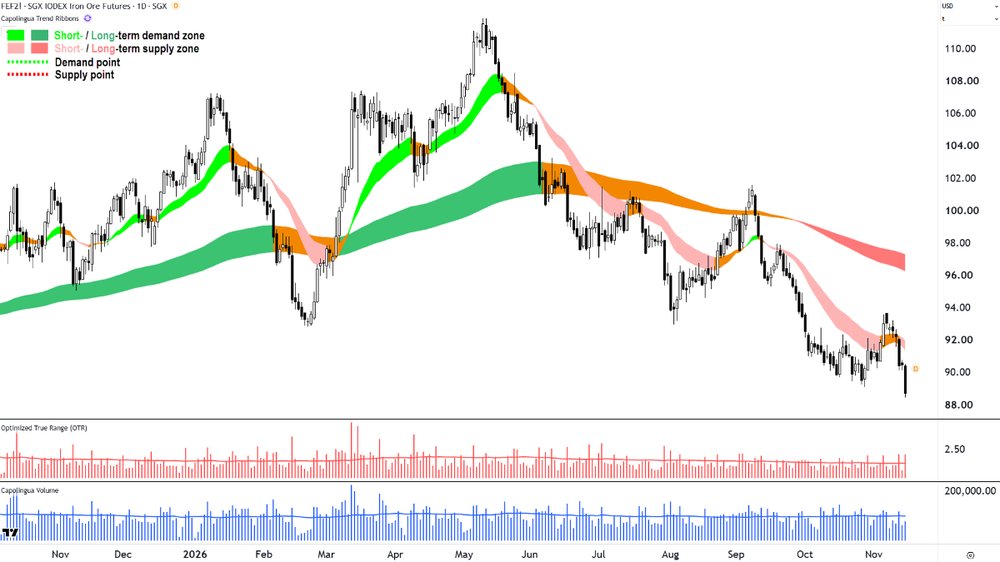
Iron Ore 62% (Front month, back-adjusted) SGX
Copper miners fared no better, with COMEX copper futures down 1.3% to US$6.014 per pound in the Asian session after falling 1.7% on Friday. There are also concerns that President Trump’s tariffs, which have propped up copper prices this year, may not go ahead following the Democrats’ clean sweep in the US midterms. Capstone Copper (CSC) (-4.8%) and Sandfire Resources (SFR) (-3.4%) were among the worst performers.
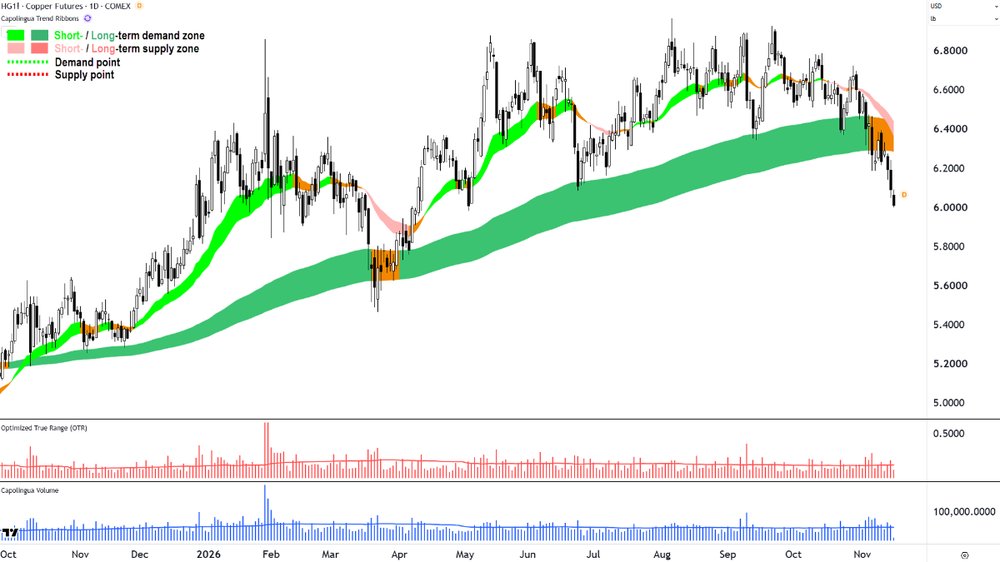
High Grade Copper Futures (Front month, back-adjusted) COMEX
Critical minerals stocks were also caught in the sell-off. IperionX (IPX) (-4.7%) and WA1 Resources (WA1) (-4.2%) led the declines, with Chalice Mining (CHN) (-4.2%) also lower.
Lithium stocks slumped – again! – as GFEX lithium carbonate futures in China fell 3.2% to CNY 87,660 per tonne. Vulcan Energy Resources (VUL) (-3.1%) and Liontown (LTR) (-3.0%) were among the decliners.
The Gold Sub-Index (XGD) (-1.9%) extended last week’s losses as a spike in US bond yields weighed on precious metals. Higher yields raise the opportunity cost of holding gold, which pays no interest. COMEX gold futures slipped 0.3% to US$3,874.70 per ounce in the Asian session, while COMEX silver futures tumbled 3.3% to US$47.80 per ounce. Genesis Minerals (GMD) (-3.4%) and Evolution Mining (EVN) (-2.9%) led the declines, with Northern Star Resources (NST) (-2.3%) also lower.
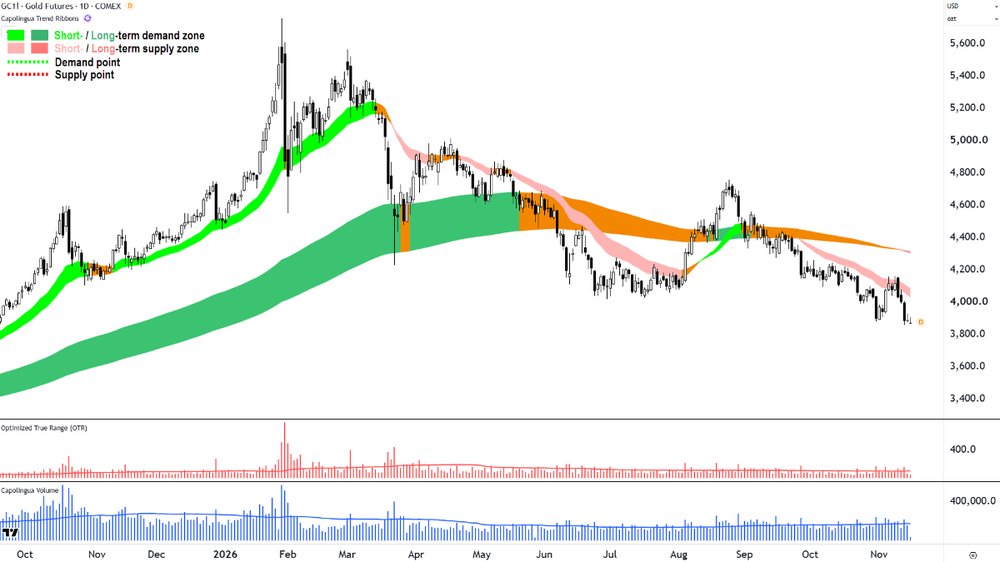
Gold Futures (Front month, back-adjusted) COMEX
Uranium stocks were also sold, with COMEX uranium futures down 0.6% to US$90.20 per pound. Deep Yellow (DYL) (-3.9%) and Bannerman Energy (BMN) (-2.4%) led the declines, with Paladin Energy (PDN) (-2.2%) also lower.
Today's best ASX Top 300 gainers
Company | Last Price | Change $ | Change % | 1mo % | 1yr % |
|---|---|---|---|---|---|
| Elders (ELD) | $7.03 | +$0.49 | +7.5% | +12.5% | +0.9% |
| Centuria Capital Group (CNI) | $1.235 | +$0.075 | +6.5% | +17.1% | -47.7% |
| Meridian Energy (MEZ) | $4.68 | +$0.26 | +5.9% | +2.4% | -8.9% |
| Xero (XRO) | $80.56 | +$3.63 | +4.7% | +39.6% | -34.2% |
| Domino's Pizza Enterprises (DMP) | $25.13 | +$1.01 | +4.2% | +16.5% | +15.4% |
| HMC Capital (HMC) | $3.54 | +$0.14 | +4.1% | +35.6% | +22.1% |
| Nanosonics (NAN) | $2.94 | +$0.11 | +3.9% | +5.0% | -26.7% |
| The Star Entertainment Group (SGR) | $0.17 | +$0.005 | +3.0% | +41.7% | +97.7% |
| EBOS Group (EBO) | $18.09 | +$0.52 | +3.0% | +10.0% | -27.8% |
| Vicinity Centres (VCX) | $2.50 | +$0.07 | +2.9% | +5.5% | +0.4% |
| Spark New Zealand (SPK) | $1.795 | +$0.05 | +2.9% | +16.6% | -9.6% |
| Wisetech Global (WTC) | $47.40 | +$1.31 | +2.8% | +37.4% | -27.0% |
| Tasmea (TEA) | $10.02 | +$0.27 | +2.8% | +5.5% | +90.9% |
| Regal Partners (RPL) | $2.03 | +$0.05 | +2.5% | -1.0% | -25.9% |
| Digico Infrastructure REIT (DGT) | $2.48 | +$0.06 | +2.5% | +24.0% | +4.6% |
| Southern Cross Electrical Engineering (SXE) | $3.91 | +$0.09 | +2.4% | -10.5% | +74.6% |
| Storage King Group (SKG) | $1.16 | +$0.025 | +2.2% | +11.5% | -15.6% |
| News Corporation (NWS) | $44.25 | +$0.94 | +2.2% | -5.3% | -2.7% |
| Austal (ASB) | $4.37 | +$0.09 | +2.1% | +13.5% | -33.4% |
| Block, Inc. (XYZ) | $123.99 | +$2.49 | +2.0% | +14.4% | +32.0% |
Today's worst ASX Top 300 losers
Company | Last Price | Change $ | Change % | 1mo % | 1yr % |
|---|---|---|---|---|---|
| GQG Partners Inc. (GQG) | $0.66 | -$0.045 | -6.4% | -36.2% | -54.5% |
| New Hope Corporation (NHC) | $4.92 | -$0.31 | -5.9% | -13.8% | +15.0% |
| Develop Global (DVP) | $3.33 | -$0.19 | -5.4% | -14.8% | -0.3% |
| DroneShield (DRO) | $1.12 | -$0.06 | -5.1% | -21.1% | -51.9% |
| Southern Cross Gold Consolidated (SX2) | $8.15 | -$0.42 | -4.9% | -17.6% | +5.4% |
| Silex Systems (SLX) | $2.93 | -$0.15 | -4.9% | -15.8% | -65.7% |
| Capstone Copper Corp. (CSC) | $10.44 | -$0.53 | -4.8% | -16.3% | -22.0% |
| 4DMedical (4DX) | $2.19 | -$0.11 | -4.8% | -46.3% | +52.1% |
| Summerset Group Holdings (SNZ) | $5.11 | -$0.24 | -4.5% | -4.7% | -51.8% |
| Cromwell Property Group (CMW) | $0.345 | -$0.015 | -4.2% | +7.8% | -24.2% |
| Sunrise Energy Metals (SRL) | $12.09 | -$0.49 | -3.9% | -13.3% | +190.6% |
| EQ Resources (EQR) | $0.265 | -$0.01 | -3.6% | -5.4% | +409.6% |
| Mineral Resources (MIN) | $45.69 | -$1.72 | -3.6% | +3.0% | -10.0% |
| FireFly Metals (FFM) | $1.36 | -$0.05 | -3.5% | +0.4% | -21.7% |
| Champion Iron (CIA) | $1.98 | -$0.07 | -3.4% | -18.5% | -62.4% |
| Genesis Minerals (GMD) | $6.81 | -$0.24 | -3.4% | -1.4% | +8.3% |
| Metals X (MLX) | $1.565 | -$0.055 | -3.4% | -4.9% | +85.2% |
| Sandfire Resources (SFR) | $18.82 | -$0.66 | -3.4% | -5.9% | +15.8% |
| Iluka Resources (ILU) | $5.88 | -$0.20 | -3.3% | +16.2% | -9.5% |
| Graincorp (GNC) | $7.13 | -$0.24 | -3.3% | +9.9% | -10.8% |
Chartwatch
Nasdaq Composite Index
Nasdaq Composite Index chart
Analysis
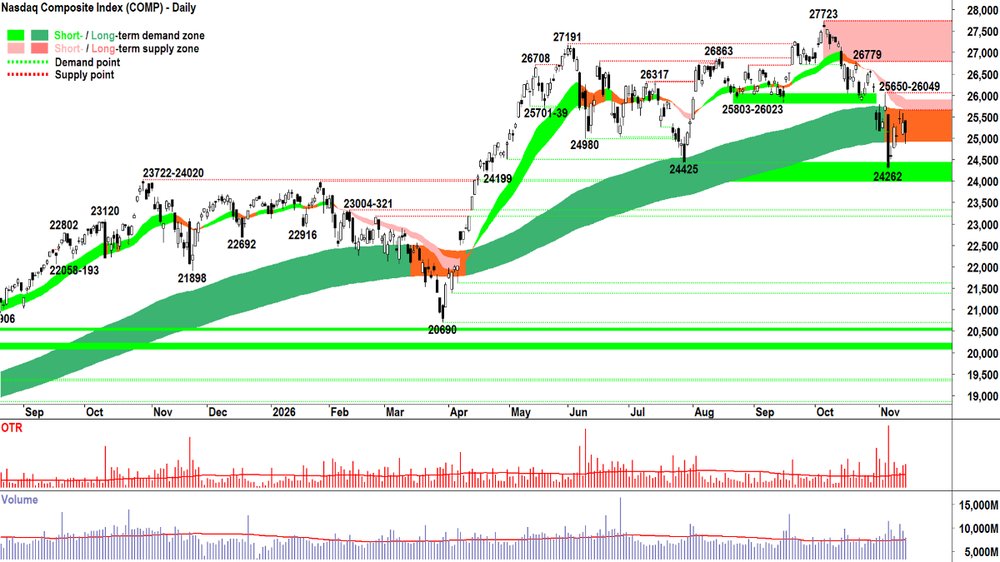
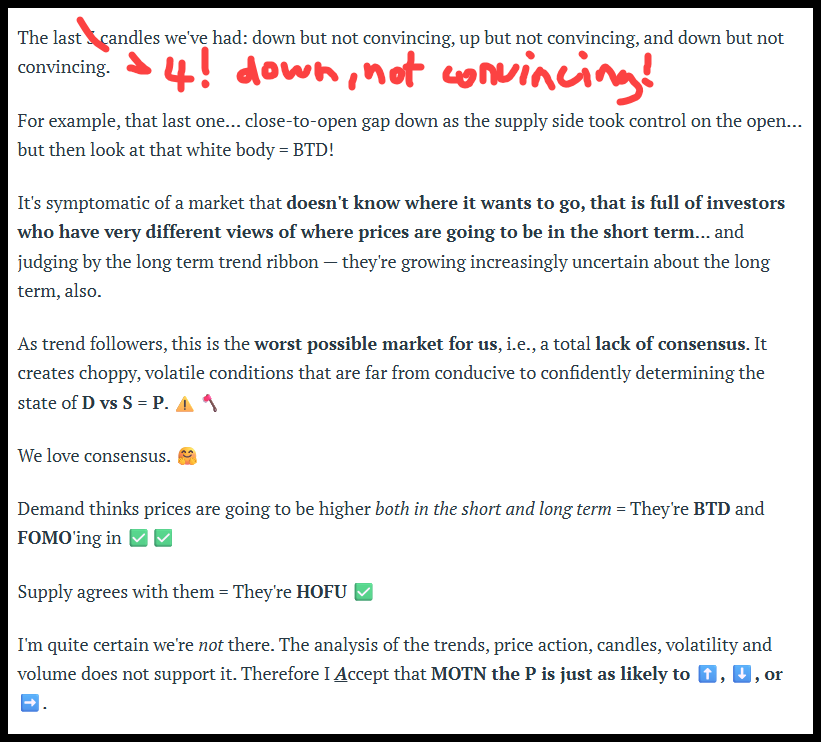
Ditto Friday's analysis with one small amendment! 🤦
View
No change required to my Act: I'm at 1/3RP on US stocks (RP = Risk Position – it reflects my personal allowable capital allocation limit for my investments in US stocks. So 1/2RP is 50%, 2/3RP is 67% and FRP is 100%).
Key Levels
The long term trend ribbon is the closest (dynamic) zone of supply (presently 24921-25667) but the short term trend ribbon (presently 25657-25911) is likely the critical go-no-go for the current short term downtrend. There appears to be a substantial zone of potential latent demand between 23722-24425.
S&P/ASX 200 (XJO)
S&P/ASX 200 (XJO) chart
Analysis
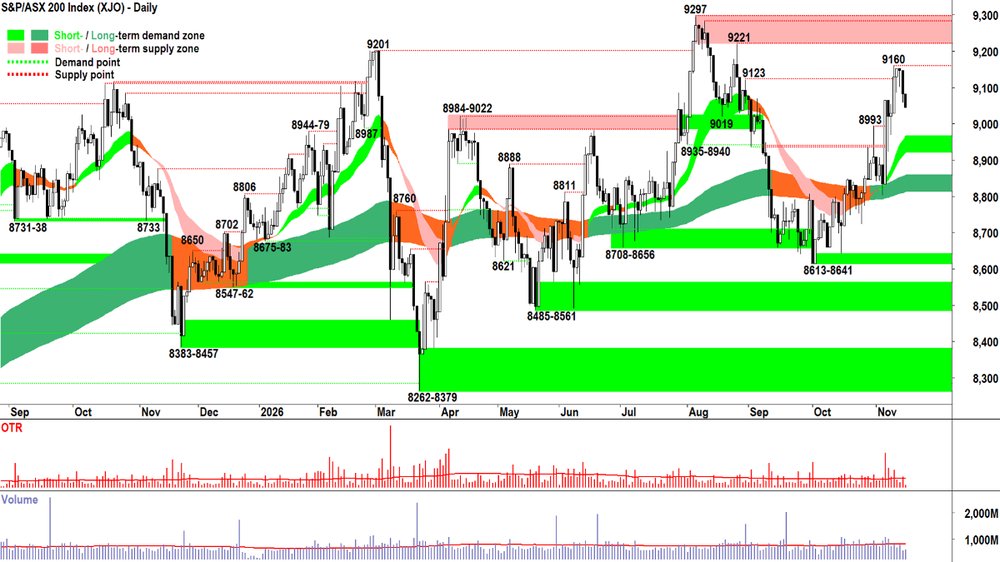
If you had to guess today's candle on the OTP today, the one we got would pretty much be it! Probably MOTN a black candle rather than a white, but given we're not heavily exposed to the NVIDIA / AI trade unwind that hit US stocks on Friday — not likely to be a big one...
Banks up (a bit). Defensives up. Growth and cyclicals down... with only the amount that Paul was allocated from Peter's share determining the final print...
Push. Pull. And the candle's colour and size, or lack-thereof, demonstrates the extent of the present stagnation and malaise. 🤦
This is not a whinge! Far from it!
Heck, I'd much rather have something "a bit mediocre but infinitely predictable" than something "wonderful but randomly erratic".
The OTP is what it is. 🤷
I.e., a function of the unique backwater that is the Australian share market... Beholden to fund managers that must invest no matter what — because the wall of guaranteed superannuation money keeps rolling in — yet they're faced with so little to choose from.
Despite all of its vagaries and foibles, there's one thing that we can be sure of (MOTN!): the model I demonstrate to you here each day, works. Trends, price action, candles, volume and volatility. Just do the work. Determine the MOTN scenario. Allocate risk accordingly. ✅✅✅
View
Disappointing today — and given what's happening in mining — a little disturbing. But today's candle is insufficient to signal a return to supply side control of the OTP's price.
Therefore, I remain at 2/3RP on Australian shares (i.e., 67% invested vs 33% cash, with some of the invested portion allocated to shorts). Happy to use the full risk allocation if I can find suitable setups.
Key Levels
9221-9297 is the closest zone of supply. The short term trend ribbon is the closest zone of (dynamic) demand (presently 8901-8943).
(Glossary of acronyms! Old Tin Pot (OTP): S&P/ASX 200 | MOTN: More Often Than Not | FOMO: Fear Of Missing Out | HOFU: Holding On For Upside | BTD: Buy The Dip | NUTE: No Urgency To Enter | FOHO: Fear Of Holding On | STR: Sell The Rally | RP: Risk Position | FFS: Fund Flow Shenanigans!)
***CHARTWATCH LIVE — BUY STOCKS NOW OR SELL THE RALLY? 📺***
ChartWatch LIVE Webinars – WEEKLY Wednesday's @ 12pm AEDT
Learn more about technical analysis and trend following through real case studies on ASX stocks. Australia's premier technical analyst, Carl Capolingua, shares his unique insights on stocks as requested by viewers. Ask about a company in your portfolio or anything related to trading and investing and get Carl's expert opinion.
Places are limited so >REGISTER NOW!<
Economy
TODAY
CHN October Data Dump
Fixed Asset Investment: -8.1% year to date/p.a. vs -7.0% year to date/p.a. forecast and -7.2% year to date/p.a. in September.
Industrial Production: +4.8% p.a. vs +5.3% p.a. forecast and +5.5% p.a. in September.
Retail Sales: +0.4% p.a. vs +0.8% p.a. forecast and +1.1% p.a. in September.
New Home Prices: -0.15% m/m vs -0.14% m/m in September
Unemployment Rate: 5.1% vs 5.2% forecast and 5.2% in September
Reader: Apart from the slight improvement in the unemployment rate, a worrying set of numbers for the Chinese economy — particularly those big misses on FAI, IP, and retail sales! ⚠️
LATER THIS WEEK
TUESDAY
04:00 USA Chair of the Federal Reserve Kevin Warsh speaks
09:50 AUS RBA Governor Michelle Bullock speaks
WEDNESDAY
00:30 USA Core Retail Sales (+0.4% m/m forecast vs +0.9% m/m previous)
11:30 AUS MI Leading Index
11:30 AUS September Quarter Wage Price Index (+0.9% q/q forecast vs +0.8% q/q previous)
THURSDAY
06:00 USA FOMC November Meeting Minutes
11:30 AUS October Employment Data
Change: +25,200 forecast vs -39,300 in September
Rate: 4.7% forecast, unchanged vs September
FRIDAY
12:00 People's Bank of China ("PBOC") Loan Prime Rate ("LPR")
1-year LPR: 3.00% p.a. forecast, unchanged
5-year LPR: 3.50% p.a. forecast, unchanged
Interesting Movers
Trading higher
- Fortifai (FTI) $0.40+25.0%
No news today. Likely a positive response from Friday's announcement that Tom Reilly had been appointed as a special advisor to the FTI board, plus trading update.
- Elders (ELD) $7.03+7.5%
Announced FY26 results. NPAT rose 187% to $144.2 million, boosted by the Delta Ag acquisition (including $7.3m in synergies). Revenue rose 31% to $4 billion. Dividend maintained at $0.18 per share fully franked. ELS was recently added to the ChartWatch ASX Scans Uptrends List. 📈
- Centuria Capital Group (CNI) $1.24+6.5%
No news. Performance reflected general strength in the broader real estate sector.
- DUG Technology (DUG) $1.76+5.4%
Issued a trading update for the four months to 31 October. Multi-Client revenue US$7.6 million in FY27 YTD (up from US$0.1 million in the pcp). HPC and Software revenue US$11.2 million (up 266%). Services revenue US$15.6 million (down 22%) as some clients now license DUG’s processing software and HPC capacity and run the work themselves. Management expects Services revenue to recover over the remainder of FY27. Normalised EBITDA margin increased to 33%.
- HMC Capital (HMC) $3.57+4.8%
No news. Performance reflected general strength in the broader real estate sector. HMC is a recent regular in the ChartWatch ASX Scans Uptrends List. 📈
- Xero (XRO) $79.79+3.7%
No news today. Continued positive response to Thursday's well received trading update. XRO has recently been added to the ChartWatch ASX Scans Uptrends List. 📈
Trading Lower
- Adore Beauty Group (ABY) $0.16-39.6%
Issued a FY27 trading and guidance update. Management cut full-year earnings guidance after a 'challenging' start to the year. Group revenue fell 8% in the first 20 weeks of FY27 and management cut FY27 underlying EBITDA guidance to $4–$6.5m (previously $9–$13m). ABY is a regular in the ChartWatch ASX Scans Downtrends List. 📉
- Viridis Mining and Minerals (VMM) $2.61-10.0%
Announced that it has received the second US$5 million tranche under its existing US$30 million binding agreement with ORE Investments and Régia Capital. The tranche was settled through the issue of 2,080,125 new shares at $3.40 per share.
- Kantra Copper (KAN) $0.98-6.2%
No news. Performance reflected general weakness in the broader copper sector, which fell on the back of continued weakness in copper prices on Friday. COMEX copper futures now trading at 6-month low.
- New Hope Corporation (NHC) $4.92-5.9%
Released its quarterly activity report and FY27 trading update. Management reported a 9.8% decrease in production and a 3.2% drop in sales for the quarter (blaming planned operational issues at Bengalla). Average realised sales price was down ~6%, with a modest decline in Underlying EBITDA to $168.1m vs $169.3m pcp. NHC is a recent regular in the ChartWatch ASX Scans Downtrends List. 📉
- Ainsworth Game Technology (AGI) $1.06-2.3%
Released an ASX statement after HotCopper posts (14 Nov 2026) and a 'probity report' alleged a number of unproven allegations. The report was prepared by HWL Ebsworth on behalf of Kjerulf Ainsworth — shareholder and son of founder Len Ainsworth. Management said the Regulatory and Compliance Committee will oversee and investigate the allegations contained in the KDHA Report.
- IDP Education (IEL) $2.54-1.2%
Rejected a third takeover offer by Blackstone, calling the latest bid “opportunistic” and saying the US private equity giant continues to “substantially undervalue” the business.
Broker Moves
Company | Broker | Action | Rating | Price Target |
|---|---|---|---|---|
A11Atlantic Lithium | Macquarie | Retained | Neutral | $0.35 |
ACFAcrow | Morgans | Retained | Buy | $1.45(from $1.40) |
ALLAristocrat Leisure | Ord Minnett | Retained | Accumulate | $70.00 |
| UBS | Retained | Buy | $73.60(from $71.20) | |
AX1Accent Group | Citi | Retained | Neutral | $0.65 |
| Morgans | Downgraded | Hold(from Accumulate) | $0.68(from $0.77) | |
| UBS | Retained | Neutral | $0.67(from $0.75) | |
AXQAura Consolidated Group, Inc. | Canaccord Genuity | Retained | Buy | $6.10(from $7.30) |
AYAArtrya | Bell Potter | Retained | Buy | $5.20(from $4.30) |
| Ord Minnett | Retained | Buy | $7.00 | |
BENBendigo and Adelaide Bank | UBS | Retained | Neutral | $10.50 |
BGLBellevue Gold | UBS | Retained | Buy | $1.90 |
BHPBHP Group | Barrenjoey | Retained | Neutral | $63.00 |
| Morgan Stanley | Retained | Overweight | $68.00 | |
| UBS | Retained | Neutral | $62.00 | |
BMCBMC Minerals . | Ord Minnett | Downgraded | Speculative Buy(from Buy) | $5.90(from $6.40) |
BOQBank of Queensland | UBS | Retained | Neutral | $6.80 |
CBACommonwealth Bank of Australia | UBS | Retained | Sell | $135.00 |
CNICenturia Capital Group | Morgan Stanley | Retained | Overweight | $1.70 |
COHCochlear | Citi | Retained | Neutral | $140.00 |
| Morgan Stanley | Retained | Equal Weight | $133.00 | |
| UBS | Retained | Neutral | $135.00 | |
COSCOSOL | Ord Minnett | Retained | Hold | $0.21(from $0.20) |
CPUComputershare | Ord Minnett | Downgraded | Hold(from Accumulate) | $44.15(from $43.75) |
| UBS | Retained | Neutral | $44.25(from $41.55) | |
CRNCoronado Global Resources Inc | Barrenjoey | Retained | Neutral | $0.20 |
CTDCorporate Travel Management | Morgans | Downgraded | Hold(from Buy) | $3.90(from $3.06) |
CU6Clarity Pharmaceuticals | Canaccord Genuity | Retained | Buy | $8.38 |
CUPCount | Canaccord Genuity | Retained | Buy | $2.30(from $2.00) |
DPMDPM Metals Inc. | Macquarie | Retained | Neutral | $59.00(from $61.00) |
ELDElders | Citi | Retained | Neutral | $6.60 |
ELTElementos | Morgans | Retained | Speculative Buy | $0.60 |
ELVElevra Lithium | Macquarie | Retained | Outperform | $9.00 |
EVNEvolution Mining | UBS | Retained | Buy | $16.00 |
FMGFortescue | UBS | Retained | Neutral | $14.90 |
GEMG8 Education | Canaccord Genuity | Retained | Hold | $0.23 |
GGPGreatland Resources | UBS | Retained | Buy | $17.10 |
GL1Global Lithium Resources | Macquarie | Retained | Neutral | $1.15 |
GLCGlencore plc | UBS | Retained | Buy | $13.10 |
GLFGemlife Communities Group | Morgans | Retained | Accumulate | $4.75(from $5.74) |
GMDGenesis Minerals | UBS | Retained | Buy | $10.70 |
GMGGoodman Group | Morgan Stanley | Retained | Overweight | $36.15 |
GNCGraincorp | Canaccord Genuity | Retained | Buy | $7.51 |
| Morgans | Downgraded | Hold(from Accumulate) | $7.75(from $7.48) | |
| Ord Minnett | Retained | Accumulate | $7.60 | |
GQGGQG Partners Inc. | Macquarie | Retained | Neutral | $0.70(from $1.10) |
| Morgans | Downgraded | Hold(from Accumulate) | $0.82(from $1.52) | |
| Ord Minnett | Downgraded | Speculative Buy(from Buy) | $0.80(from $1.90) | |
IGOIGO | Macquarie | Retained | Outperform | $7.00 |
JDOJudo Capital Holdings | UBS | Retained | Neutral | $1.05 |
JNSJanus Electric Holdings | Bell Potter | Initiated | Speculative Buy | $0.90 |
KARKaroon Energy | Morgan Stanley | Retained | Overweight | $1.77(from $1.84) |
LTRLiontown | Macquarie | Retained | Outperform | $0.75 |
MI6Minerals 260 | Morgans | Retained | Buy | $1.57 |
| Ord Minnett | Downgraded | Speculative Buy(from Buy) | $1.60(from $1.35) | |
| UBS | Retained | Buy | $1.40 | |
MINMineral Resources | UBS | Retained | Buy | $72.00 |
MMSMcMillan Shakespeare | Macquarie | Downgraded | Neutral(from Outperform) | $17.48(from $21.22) |
MQGMacquarie Group | UBS | Retained | Neutral | $265.00 |
NABNational Australia Bank | UBS | Retained | Buy | $45.00 |
NCKNick Scali | Citi | Retained | Sell | $13.25 |
NEMNewmont Corporation | UBS | Retained | Buy | $215.00 |
NHCNew Hope Corporation | Barrenjoey | Retained | Neutral | $6.40 |
NSTNorthern Star Resources | UBS | Retained | Buy | $31.60 |
NXGNexGen Energy (Canada) | Morgans | Upgraded | Buy(from Accumulate) | $15.15(from $15.60) |
| Ord Minnett | Downgraded | Speculative Buy(from Buy) | $14.80 | |
OBMOra Banda Mining | UBS | Retained | Buy | $2.00 |
OMAOmega Oil & Gas | Canaccord Genuity | Retained | Speculative Buy | $1.40 |
ORIOrica | Morgans | Retained | Accumulate | $26.98(from $26.52) |
| Ord Minnett | Retained | Buy | $27.00 | |
PDNPaladin Energy | Barrenjoey | Retained | Overweight | $12.20(from $13.00) |
| Morgans | Retained | Buy | $11.25(from $13.10) | |
| Ord Minnett | Downgraded | Lighten(from Accumulate) | $8.50 | |
PLSPLS Group | Macquarie | Retained | Outperform | $4.50 |
PMEPro Medicus | Bell Potter | Retained | Buy | $235.00(from $226.00) |
PMTPMET Resources Inc | Macquarie | Retained | Outperform | $0.70 |
PNRPantoro Gold | UBS | Retained | Buy | $4.70 |
PRUPerseus Mining | UBS | Retained | Buy | $9.25 |
QALQualitas | Canaccord Genuity | Retained | Buy | $4.80 |
RIORio Tinto | UBS | Retained | Neutral | $171.00 |
RMSRamelius Resources | UBS | Retained | Buy | $5.90 |
RPLRegal Partners | Bell Potter | Retained | Buy | $3.50(from $4.50) |
| Canaccord Genuity | Retained | Buy | $3.25(from $3.75) | |
| Morgans | Retained | Buy | $4.00(from $4.25) | |
| Ord Minnett | Retained | Buy | $3.20(from $3.40) | |
SGHSGH | Bell Potter | Retained | Hold | $45.00 |
SKOSerko | Citi | Retained | Buy | $2.90 |
SMRStanmore Resources | Barrenjoey | Retained | Overweight | $3.20 |
SPZSmart Parking | Canaccord Genuity | Retained | Buy | $1.50(from $1.80) |
SSMService Stream | Morgan Stanley | Retained | Overweight | $2.90 |
TLCThe Lottery Corporation | Morgans | Retained | Accumulate | $5.90(from $5.40) |
VULVulcan Energy Resources | Morgan Stanley | Initiated | Equal Weight | $1.40 |
WBCWestpac Banking Corporation | UBS | Retained | Buy | $41.50 |
WC8Wildcat Resources | Macquarie | Retained | Outperform | $0.85 |
WGNWagners Holding Company | Morgans | Retained | Buy | $5.90(from $5.25) |
WHCWhitehaven Coal | Barrenjoey | Retained | Neutral | $7.50 |
| UBS | Retained | Neutral | $8.05 | |
XROXero | Morgans | Retained | Accumulate | $90.00(from $85.00) |
| Ord Minnett | Retained | Buy | $110.00 |
Scans
Top Gainers
Code | Company | Last | % Chg |
|---|---|---|---|
| AUG | Augustus Minerals Ltd | $0.035 | +34.62% |
| FTI | Fortifai Ltd | $0.40 | +25.00% |
| T88 | Taiton Resources Ltd | $0.046 | +21.05% |
| AVE | Avecho Biotechnology Ltd | $0.012 | +20.00% |
| IOV | Ion Video Ltd | $0.72 | +20.00% |
Top Fallers
Code | Company | Last | % Chg |
|---|---|---|---|
| ABY | Adore Beauty Group Ltd | $0.15 | -43.40% |
| SCP | Scalare Partners Holdings Ltd | $2.60 | -23.53% |
| OR3 | Ore Resources Ltd | $0.037 | -17.78% |
| BPP | Babylon Pump & Power Ltd | $0.042 | -16.00% |
| BOC | Bougainville Copper Ltd | $0.135 | -15.63% |
52 Week Highs
Code | Company | Last | % Chg |
|---|---|---|---|
| IOV | Ion Video Ltd | $0.72 | +20.00% |
| AMX | Aerometrex Ltd | $0.40 | +9.59% |
| CLG | Close the Loop Ltd | $0.044 | +7.32% |
| GRS | Gwardar Resources Ltd | $0.77 | +6.94% |
| DMP | Domino's PIZZA Enterprises Ltd | $25.13 | +4.19% |
52 Week Lows
Code | Company | Last | % Chg |
|---|---|---|---|
| ABY | Adore Beauty Group Ltd | $0.15 | -43.40% |
| OR3 | Ore Resources Ltd | $0.037 | -17.78% |
| BPP | Babylon Pump & Power Ltd | $0.042 | -16.00% |
| NAEDA | New Age Exploration Ltd | $0.017 | -15.00% |
| ITS | Infotrust Ltd | $0.20 | -13.04% |
Near Highs
Code | Company | Last | % Chg |
|---|---|---|---|
| RHC | Ramsay Health Care Ltd | $55.03 | -0.70% |
| OZBD | Betashares Australian Composite Bond ETF | $43.16 | -0.58% |
| AN3PI | Australia and New Zealand Banking Group Ltd | $102.65 | 0.00% |
| PCI | Perpetual Credit Income Trust | $1.085 | 0.00% |
| WVOL | iShares MSCI World Ex Aust Minimum Volatility ETF | $49.25 | +0.22% |
Relative Strength Index (RSI) Oversold
Code | Company | Last | % Chg |
|---|---|---|---|
| WHI | Whitefield Income Ltd | $1.15 | -1.29% |
| BTXX | Digitalx Bitcoin ETF | $21.82 | -7.39% |
| GQG | GQG Partners Inc | $0.705 | -0.70% |
| SCP | Scalare Partners Holdings Ltd | $3.40 | -10.53% |
| SPL | Starpharma Holdings Ltd | $0.425 | 0.00% |