

The ASX 200 eked out a gain to close out a 2.3% monthly rise — its best since February — as South Korea's KOSPI posted a record intraday gain of nearly 18% following government stabilisation measures. That move unleashed a global risk-on surge that lifted copper, eased bond yields, and pushed capital back into gold and base metals stocks. Defensive sectors gave ground — because if there are winners on the ASX... There must also be losers!
Be sure to click/scroll through for the usual reporting of the major sector and stock-specific moves, the broker responses to them, as well as all the key economic data in tonight's Evening Wrap. Also, I have detailed technical analysis on the Nasdaq Composite and the S&P/ASX 200 in today's ChartWatch.
Let’s dive in!
Today in Review
Name | Value | % Chg |
|---|---|---|
Major Indices | ||
| ASX 200 | 8,976.8 | +0.10% |
| All Ords | 9,137.0 | +0.16% |
| Small Ords | 3,314.6 | +1.40% |
| All Tech | 2,939.2 | +0.46% |
| Emerging Companies | 2,778.9 | +2.47% |
Currency | ||
| AUD/USD | 0.7032 | +0.04% |
US Futures | ||
| S&P 500 | 7,494.5 | +0.29% |
| Dow Jones | 52,563.0 | +0.35% |
| Nasdaq | 28,475.0 | +0.84% |
Name | Value | % Chg |
|---|---|---|
Sector | ||
| Materials | 23,187.9 | +1.43% |
| Real Estate | 3,638.1 | +0.71% |
| Information Technology | 1,770.3 | +0.56% |
| Utilities | 9,587.8 | +0.54% |
| Energy | 10,646.2 | +0.37% |
| Industrials | 8,344.8 | -0.04% |
| Consumer Discretionary | 4,030.2 | -0.24% |
| Financials | 9,895.5 | -0.37% |
| Communication Services | 1,639.4 | -0.73% |
| Consumer Staples | 13,344.4 | -1.26% |
| Health Care | 26,634.0 | -1.85% |
ASX 200 Intraday Chart
%20intraday%20chart_31%20Jul.png)
Markets
The S&P/ASX 200 (XJO) finished 9.1 points higher at 8,976.8, 0.92% from its session high and 0.1% from its low. Despite the flameout in the benchmark, in the broader-based S&P/ASX 300 (XKO) advancers still managed to beat decliners by 165 to 117.
For the week, the XJO finished up 204 points or 2.3% higher, 2.3% from its intraweek low and 1.2% from its intraweek high. It was a wild ride!
Talking about wild rides, check out the chart of South Korea's benchmark KOSPI Composite Index. 🎢
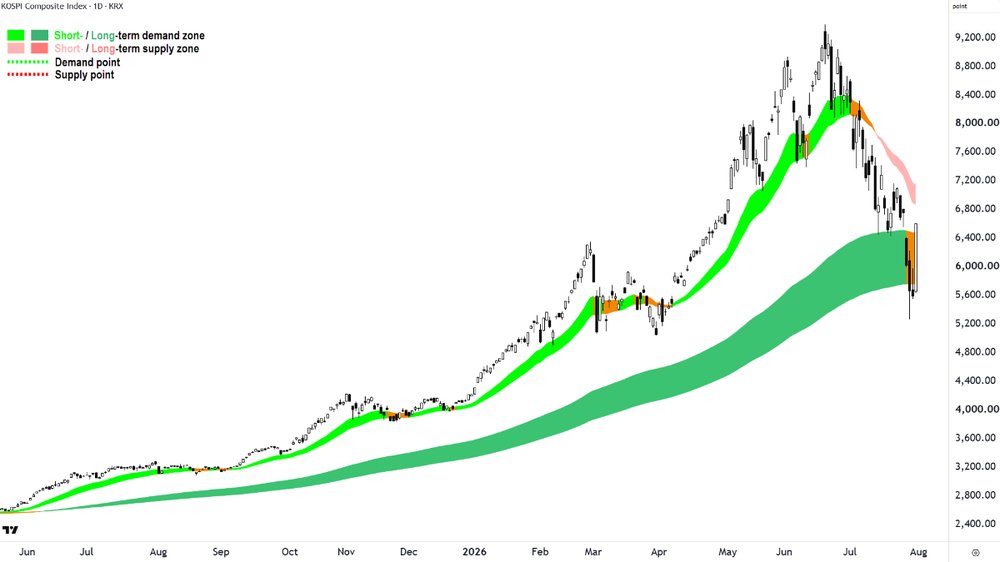
You think we had a wild week... It was nothing like what the South Korean's experienced! 🎢
Sometimes it only takes one candle to tell you how serious things got. Let's hope that it's crisis averted (hint: it usually isn't!).
More on the "PPT" in ChartWatch, but for now note that moves in overseas markets generally drove capital towards more risk-on sectors like mining, and as bond yields eased overnight, towards interest rate sensitives and bond proxies.
The Gold Sub-Index (XGD) (+1.6%) led the session as the KOSPI's extraordinary 18% intraday bounce — triggered by South Korean government intervention to stabilise its plunging market — sent a shockwave of risk-on sentiment through global markets, easing benchmark bond yields as capital rotated toward growth assets.
Lower yields reduce the opportunity cost of holding gold, and lower diesel costs as crude oil pulled back further, improves mining margins simultaneously. Kingsgate Consolidated (KCN) (+7.7%), Black Cat Syndicate (BC8) (+5.3%), West African Resources (WAF) (+5.2%), and Predictive Discovery (PDI) (+4.7%) all surged.
Materials (XMJ) (+1.4%) was another beneficiary of the KOSPI rally, but also as the price of copper rebounded — LME benchmark cash copper added 1.2% on Thursday and COMEX copper futures gained a further 0.3% to US$6.492/lb in Asian trade after surging 2.6% overnight. Arguably, copper's designation as the essential metal of AI infrastructure helped.
Sandfire Resources (SFR) (+2.4%), Nickel Industries (NIC) (+3.2%), BHP (BHP) (+2.0%), Rio Tinto (RIO) (+1.3%), Iluka Resources (ILU) (+4.9%), and WA1 Resources (WA1) (+4.7%) all advanced in the sector, but Fortescue (FMG) (-1.9%) was a notable exception after it disclosed a US$525 million after-tax impairment on its Iron Bridge magnetite project.
Real Estate (XPJ) (+0.7%) and Utilities (XUJ) (+0.5%) both caught the lower bond yield tailwind — when yields ease, bond-proxy sectors whose stable income streams compete with risk-free government bonds find relative appeal improving. Lendlease (LLC) (+1.7%), Goodman Group (GMG) (+1.7%), and Ingenia Communities (INA) (+1.4%) led Real Estate, while Origin Energy (ORG) (+0.9%) — which reported a 7% lift in business electricity volumes in the June quarter from growing data centre demand — led Utilities.
Information Technology (XIJ) (+0.6%) was mixed rather than uniformly strong, despite the KOSPI's AI-driven surge lifting US tech peers substantially. WiseTech Global (WTC) (-4.2%) was a conspicuous outlier, declining without a confirmed new catalyst.
Energy (XEJ) (+0.4%) advanced despite ICE Brent crude futures falling 1.7% to US$85.46/bbl — oil's month-end pullback insufficient to arrest buying in oil and gas stocks that had been consistently well-bid through July. Woodside Energy (WDS) (+0.2%) was marginally positive.
Health Care (XHJ) (-1.8%) was the day's worst performer, with the defensive rotation unwinding sharply as risk appetite improved globally. CSL (CSL) (-3.8%) was the primary drag after Macquarie designated it its "least preferred" stock in the healthcare sector. Sonic Healthcare (SHL) (-2.8%), Cochlear (COH) (-1.8%), and ResMed (RMD) (-1.5%) were also lower.
Consumer Staples (XSJ) (-1.3%) gave back defensive gains for exactly the same reason as healthcare — staples stocks were the hiding place during July's volatility, and today they were sold as risk appetite returned. A2 Milk (A2M) (-2.5%), Metcash (MTS) (-1.9%), and Woolworths (WOW) (-1.7%) were the main laggards.
Financials (XFJ) (-0.4%) were marginally negative — the late-session buying that has repeatedly cushioned the sector over recent weeks did not materialise today, and the major banks drifted slightly lower. QBE Insurance (QBE) (-2.5%) was the sharpest faller within a soft insurance cohort.
%20chart_30%20Jul_close_up.png)
Sprott Uranium Miners ETF (NYSE-URNM) chart
Uranium stocks staged a sharp recovery as the Sprott Uranium Miners ETF gained 4.9% overnight — a reversal that, like many commodity-adjacent ETF moves this week, appeared driven by global fund flows rather than any change in uranium fundamentals. Deep Yellow (DYL) (+8.6%), Bannerman Energy (BMN) (+7.7%), Paladin Energy (PDN) (+7.0%), NexGen Energy (NXG) (+5.4%), and Boss Energy (BOE) (+3.0%) all surged.
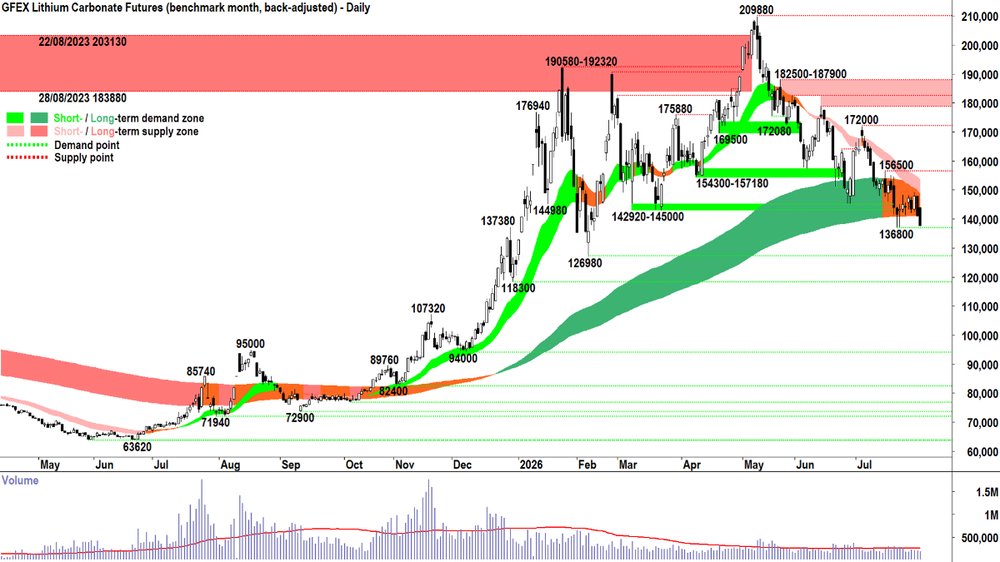
GFEX lithium carbonate futures chart 🌵
Lithium was split — GFEX lithium carbonate futures fell a further 1.9% to CNY 138,360/t, their lowest level since February 9 and now 34% below the 13 May high of CNY 209,880/t. Yet most lithium stocks defied the bearish commodity lead: Core Lithium (CXO) (+6.7%), Elevra Lithium (ELV) (+4.3%), and IGO (IGO) (+1.6%) all advanced on what appeared to be global fund flow buying rather than any fundamental improvement. Pilbara Minerals (PLS) (-1.4%) and Liontown Resources (LTR) (-2.0%) were the exceptions, tracking the commodity price lower.
Today's best ASX Top 300 gainers
Company | Last Price | Change $ | Change % | 1mo % | 1yr % |
|---|---|---|---|---|---|
| 4DMedical (4DX) | $3.63 | +$0.42 | +13.1% | -20.9% | +1412.5% |
| Clarity Pharmaceuticals (CU6) | $2.37 | +$0.27 | +12.9% | +12.9% | -45.8% |
| Megaport (MP1) | $18.10 | +$1.87 | +11.5% | -10.8% | +24.4% |
| Silex Systems (SLX) | $4.61 | +$0.43 | +10.3% | -13.8% | +8.5% |
| Electro Optic Systems Holdings (EOS) | $6.69 | +$0.59 | +9.7% | -30.7% | +108.4% |
| Deep Yellow (DYL) | $1.32 | +$0.105 | +8.6% | -7.7% | -12.6% |
| FireFly Metals (FFM) | $1.75 | +$0.135 | +8.4% | -0.6% | +72.4% |
| Lindian Resources (LIN) | $0.78 | +$0.06 | +8.3% | -17.9% | +642.9% |
| Ora Banda Mining (OBM) | $1.135 | +$0.085 | +8.1% | +0.9% | +74.6% |
| Zip Co (ZIP) | $2.55 | +$0.19 | +8.1% | -18.5% | -21.1% |
| Southern Cross Electrical Engineering (SXE) | $4.33 | +$0.32 | +8.0% | -9.2% | +143.9% |
| IperionX (IPX) | $3.05 | +$0.22 | +7.8% | -20.8% | -48.7% |
| Kingsgate Consolidated (KCN) | $4.04 | +$0.29 | +7.7% | -22.6% | +82.0% |
| Capstone Copper Corp. (CSC) | $13.69 | +$0.91 | +7.1% | +3.2% | +59.9% |
| Paladin Energy (PDN) | $9.42 | +$0.62 | +7.0% | 0.0% | +51.7% |
| Brazilian Rare Earths (BRE) | $3.75 | +$0.23 | +6.5% | -14.2% | +70.5% |
| Benz Mining Corp (BNZ) | $3.45 | +$0.20 | +6.2% | +31.2% | +430.8% |
| Pinnacle Investment Management Group (PNI) | $15.98 | +$0.83 | +5.5% | -7.0% | -28.6% |
| NexGen Energy (Canada) (NXG) | $13.27 | +$0.68 | +5.4% | -5.4% | +25.2% |
| SKS Technologies Group (SKS) | $7.30 | +$0.37 | +5.3% | -20.7% | +228.8% |
Today's worst ASX Top 300 losers
Company | Last Price | Change $ | Change % | 1mo % | 1yr % |
|---|---|---|---|---|---|
| Altium (ALU) | $0.90 | -$0.15 | -14.3% | 0.0% | 0.0% |
| Genesis Energy (GNE) | $2.05 | -$0.15 | -6.8% | -0.7% | -4.9% |
| Champion Iron (CIA) | $3.41 | -$0.21 | -5.8% | -14.3% | -18.2% |
| Domino's Pizza Enterprises (DMP) | $18.57 | -$1.02 | -5.2% | +12.9% | +1.6% |
| Ryman Healthcare (RYM) | $1.81 | -$0.09 | -4.7% | -3.2% | -20.6% |
| DroneShield (DRO) | $1.695 | -$0.075 | -4.2% | -27.3% | -54.8% |
| Wisetech Global (WTC) | $36.30 | -$1.59 | -4.2% | +7.3% | -69.6% |
| Stanmore Resources (SMR) | $2.31 | -$0.10 | -4.1% | -2.5% | +8.5% |
| CSL (CSL) | $123.06 | -$4.87 | -3.8% | +6.6% | -54.6% |
| New Hope Corporation (NHC) | $5.19 | -$0.16 | -3.0% | -2.6% | +24.2% |
| Sonic Healthcare (SHL) | $21.86 | -$0.64 | -2.8% | +4.2% | -20.8% |
| Whitehaven Coal (WHC) | $6.98 | -$0.20 | -2.8% | -12.4% | +8.4% |
| L1 Gold Fund (LGF) | $1.925 | -$0.055 | -2.8% | +9.1% | -5.2% |
| REA Group (REA) | $160.71 | -$4.43 | -2.7% | +15.9% | -32.9% |
| AUB Group (AUB) | $27.86 | -$0.76 | -2.7% | -1.8% | -17.9% |
| News Corporation (NWS) | $45.42 | -$1.21 | -2.6% | +8.9% | -13.1% |
| The a2 Milk Company (A2M) | $6.89 | -$0.18 | -2.5% | -7.5% | -14.8% |
| Premier Investments (PMV) | $13.69 | -$0.35 | -2.5% | -8.5% | -35.4% |
| QBE Insurance Group (QBE) | $24.73 | -$0.63 | -2.5% | -0.9% | +6.6% |
| Helia Group (HLI) | $5.02 | -$0.12 | -2.3% | -10.4% | -0.8% |
Chartwatch
Nasdaq Composite Index
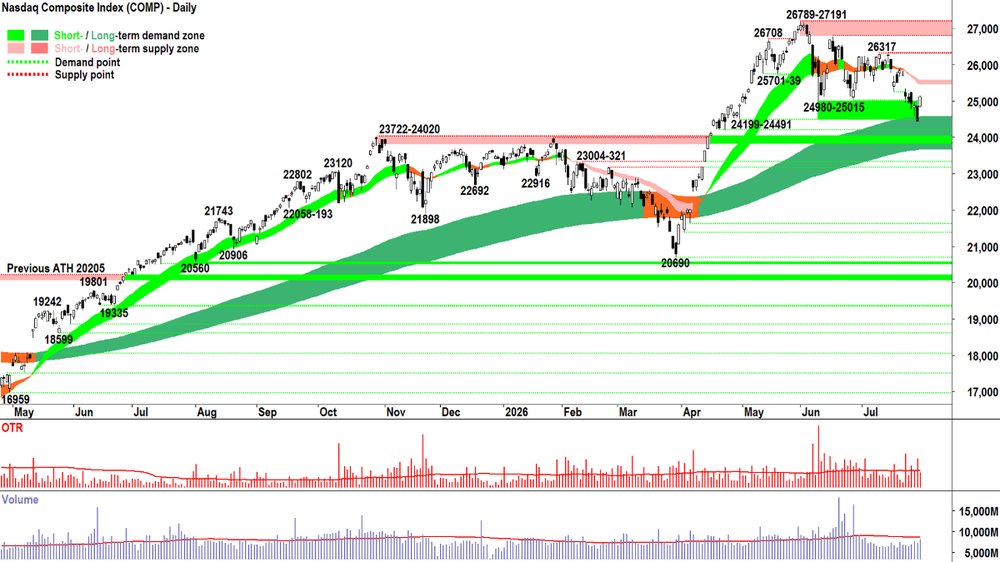
Nasdaq Composite Index chart
Analysis
Last night’s candle deserves more than being tucked away there on the far right in the image above. No, it needs a ZOOM! 🔍
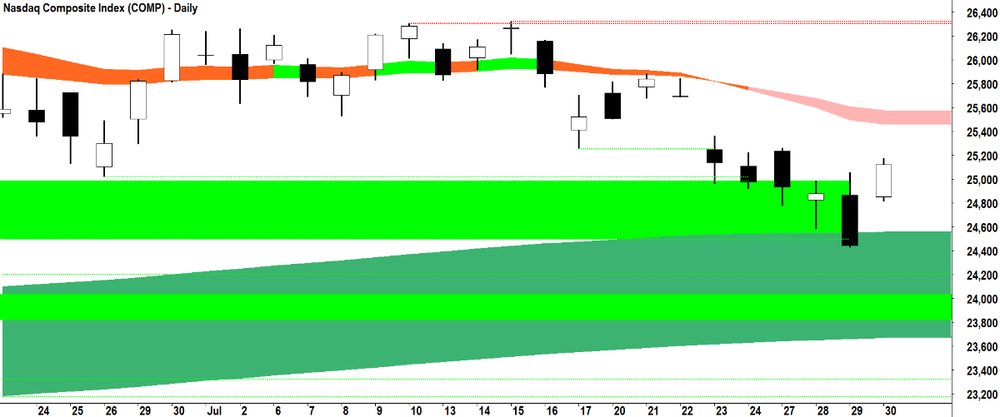
Comp chart zoomed in to highlight the "unusual" candle pattern! 🔍
Only the Comp can do something like that. That’s why it’s kinda not shocking as much as it is shocking at the same time!
As in, normally, I’d say there’s about 2 in 100 chances of Thursday’s candle following Wednesday’s.
But for the Comp, at the long term uptrend ribbon? 🤔
It’s probably closer to 10 out of 100!
As in, zooming out a little just to prove to you this is a very Comp thing to do — see the chart image below, specifically the SAME two-candle pattern at the last major low on 30-31-Mar.
I mean, it’s even almost the same days of the month (note, end of month is a notorious window for FFS!)
The two certainly have a very similar feel about them: “Nope, there’s no way this market is going to rally from here — look at the trends, price action and candles — it’s cactus!” 🌵
What’s the big deal? I hear you ask. It’s just a white candle after a black candle.
Well, to get from the bottom of the black candle’s close (when everything before it is indicating dominant supply side control), to the open of the white candle is something special.
It represents a total, utter, about-face in the demand supply environment.
But after that extraordinary about-face open, the environment wasn’t one of: STR, take profits, this is a great chance to get out given prevailing sentiment and trends — it was: keep buying and/or better cover back those shorts.
And price wasn’t so much of an issue.
FOMO
+ HOFU
+ BTD
= P ⬆️
Anyways, like I said, I’m kinda surprised but not surprised because I know the Comp so well. That’s why I check it every day. No other market on the planet moves like this on a consistent basis.
Now, if you believe in Santa Claus, the Easter Bunny, the Tooth Fairy, and that The Rock is an “actor”, then you — like me — probably also believe in the Plunge Protection Team (PPT). (Note: I called the possibility of an imminent PPT intervention in markets on Monday!)
And the long term uptrend ribbon is about to come into calculations (i.e., potential for some long term positional demand kicking in to buy the dip / Plunge Protection Team doing what they're good at)...
— Carl Capolingua, Evening Wrap, Monday 27 July 2026 (ChartWatch, Nasdaq Composite)
I could pass off that rare and unlikely two-candle pattern as a bit of a fluke: demand and supply shifted, suddenly, so price moved…
Or I could call it some of the best work the PPT has done since last time — with last time coinciding with the market meltdown caused by You Know Who doing you know what back in March!
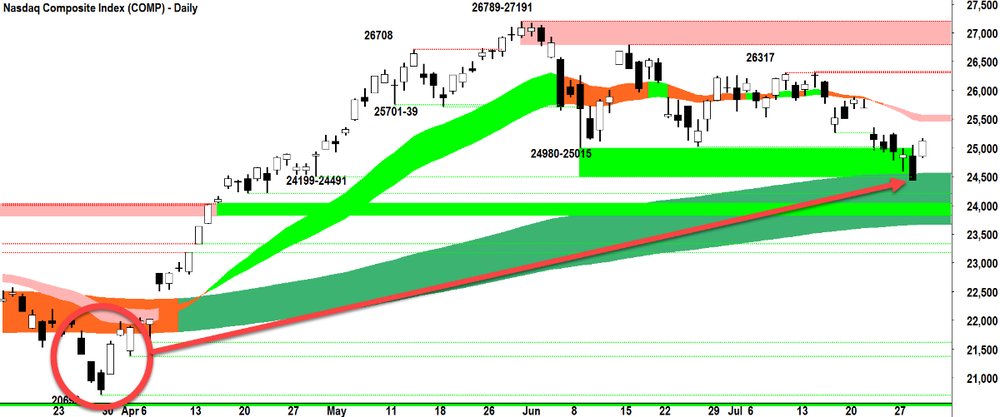
Some of the best work the PPT has done since the last time — there's last time!
This time, there’s certainly a bit of that, but there’s also a lot of South Korean stocks’ meltdown and the corresponding declines in the US AI cohort that have attached to them some pretty big leveraged bets.
Things were looking dicey at Wednesday’s close. MOTN about to get very SPICY kinda suff! 🌶️🔥
But now, if you’re short… You’re seriously rethinking whether you should cover back (i.e., growing latent demand)…
Next, if you’re in too much cash (like me)… You’re now seriously rethinking whether you want remain underweight risk (i.e., growing latent demand)…
And if you own stock and were you-know-whatting your pants on Wednesday night… You’re now, well, actually rather relieved! You’re now thinking you don’t need to sell anymore (i.e., shrinking latent supply).
Anyways, the upshot for the ChartWatch model is that it, quite rightly, moved to its maximum risk-aversion setting of 1/3RP yesterday.
That’s just how the cookie crumble sometimes!
That move is on hold. Let me see how this plays out. So, we’re less than 1/2RP and greater than 1/3RP… To the degree of whatever risk came off the table in last night’s candle. Which given the candle is such a demand side monster — is probably not very much!
View
Less than 1/2RP and greater than 1/3RP 🤦. (RP = Risk Position — it reflects my personal allowable capital allocation limit for my investments in US stocks. So 1/2RP is 50%, 2/3RP is 67% and FRP is 100%).
Key Levels
26789-27191 is the key zone of supply vs long term uptrend ribbon (presently 23672-24556) is the key zone of demand.
S&P/ASX 200 (XJO)
%20chart_31%20Jul.png)
S&P/ASX 200 (XJO) chart
Analysis
I don’t know if you’ve noticed, but I love markets. Even when they don’t go the way I expect — like the Comp did last night — I retain the same fascination and wonderment about them as a small child might possess when they see a 747 jumbo jet taking off for the first time (whatever the BIG ones are now, you know what I mean!).
And then there’s the OTP… 😭
No, just kidding, I’m still fascinated by our beloved OTP, too!
Hey, PPT, or simply a case of long term uptrend ribbon doing its thing on the Comp? 🤔
Could be just a case that the imaginary dark green caterpillar just did what it does best — i.e., behave as a zone of dynamic excess demand.
It certainly did that here on the OTP, as in — brilliant bloody clockwork! 💯
But, alas, as good as we looked for about an hour-and-a-half on Wednesday, yesterday’s black-bodied candle and today’s long upward pointing shadow — imply there remains a decent whack of excess supply at any price above 9,000, give or take.
In a week where the candles have made two of my portfolio risk moves look pretty stupid, I’ve got to say that it’s a very tough market for a trend follower indeed!
And that’s to be expected. We aren’t in a clear-cut demand or clear-cut supply side market. Both markets (i.e., the Comp and the OTP) were in equilibrium at the start of this week. Equilibrium means indecision and a lack of consensus. ⚖️
Equilibrium markets are prone to false starts — and we just have to roll with them. There will be a strong trend again, eventually. We must ensure we protect our capital vigilantly until that’s the case.
View
I'm 2/3RP on my Aussie portfolio ⚖️ (i.e., my personal allowable capital allocation limit for my investments in Australian stocks is 67%).
Key Levels
8984-9022 is the key zone of supply, while demand is at 8708-8656.
(Glossary of acronyms! Old Tin Pot (OTP): S&P/ASX 200 | MOTN: More Often Than Not | FOMO: Fear Of Missing Out | HOFU: Holding On For Upside | BTD: Buy The Dip | NUTE: No Urgency To Enter | FOHO: Fear Of Holding On | STR: Sell The Rally | RP: Risk Position | FFS: Fund Flow Shenanigans!)
***CHARTWATCH LIVE WEBINARS 📺🍿***
The ASX 200 just hit a 22 week high! What to consider before investing in the Australian share market 🔍
ChartWatch LIVE Webinars – WEEKLY Wednesday's @ 12pm AEDT
Learn more about technical analysis and trend following through real case studies on ASX stocks. Australia's premier technical analyst, Carl Capolingua, shares his unique insights on stocks as requested by viewers. Ask about a company in your portfolio or anything related to trading and investing and get Carl's expert opinion.
Places are limited so >REGISTER NOW!<
Economy
Today
AUS June Producer Price Index (PPI) (wholesale inflation)
Result: +1.3% m/m vs +0.3% m/m forecast and +0.4% m/m in May
Biggest increases: Housing construction materials, transport (via fuel prices), manufacturing, childcare services, takeaway food
Reader: No headlines on this one... The better than expected CPI from earlier in the week got all the attention! But PPI often leads CPI — and this is a pretty awful result! (Annualise +1.3% m/m if you're not sure! 😉)
CHN July Purchasing Managers Index (PMI)
Manufacturing: 49.2 vs 49.9 forecast and 50.3 in June
Services: 49.0 vs 50.0 forecast and 50.2 in June
Reader: 50 is the balance point between growth/contraction: >50 = growth vs <50 = contraction. So we saw the Chinese manufacturing and services sectors contract more than expected in July.
LATER THIS WEEK
That's it! 🏖️🏄
Interesting Movers
Trading higher
- iShares MSCI South Korea ETF (IKO) $237.72+15.7%
Rose on no news; this ETF tracks the KOSPI index which soared 17% today.
- 4DMedical (4DX) $3.63+13.1%
Rose after it announced its quarterly activity report and Cash Flow Report for the quarter ended 30 June 2026.
- Megaport (MP1) $18.10+11.5%
Rose on no news, likely got a boost from the global rebound in AI infrastructure stocks.
- Global X Semiconductor ETF (SEMI) $35.67+11.5%
Rose on no news; performance reflected general strength in the broader global AI and semiconductor sector following the big rally in the KOSPI.
- BetaShares Asia Technology Tigers ETF (ASIA) $19.70+10.6%
Rose on no news; performance reflected general strength in the broader global AI and semiconductor sector following the big rally in the KOSPI.
- Ora Banda Mining (OBM) $1.14+8.1%
Rose after it announced continued exploration success at its high-grade Little Gem Prospect, with new intercepts confirming widths and grades seen in previous drilling.
- Capstone Copper Corp. (CSC) $13.69+7.1%
Rose after it announced financial results for the three and six months ended 30 June 2026; Q2 2026 contained copper production 51,759 tonnes, C1 cash costs $2.82/lb and adjusted EBITDA of $354.0 million (record).
- Alcoa Corporation (AAI) $64.26+4.7%
Rose after it announced financial results for the three and six months ended 30 June 2026.
- BetaShares Australian Sustainability Leaders ETF (FAI) $0.000.0%
Rose after it announced Regal Partners Funds Management had increased its shareholding from 5.6% to 6.79%.
Trading Lower
- Champion Iron (CIA) $3.41-5.8%
Fell on no news, likely continued negative response to yesterday's quarterly results; performance reflects prevailing short and long term downtrends.
- DroneShield (DRO) $1.70-4.2%
Fell on no news; performance reflects prevailing short and long term downtrends.
- CSL (CSL) $123.06-3.8%
Fell on no news — pulling back after strong gains earlier in the week on the back of Tuesday's plasma manufacturing update.
- Fortescue (FMG) $18.51-1.9%
Fell after it announced a US$525 million after-tax impairment on its Iron Bridge magnetite project ahead of its full-year results; review of carrying value based on a revised ramp-up schedule and production scenarios will result in a non-cash impairment (charge to be excluded from underlying net profit).
Broker Moves
Company | Broker | Action | Rating | Price Target |
|---|---|---|---|---|
ACLAustralian Clinical Labs | Macquarie | Retained | Neutral | $2.30 |
ALDAmpol | E&P | Downgraded | Neutral(from Positive) | $41.00(from $40.50) |
| Jefferies | Retained | Buy | $43.50(from $38.50) | |
| JPMorgan | Retained | Overweight | $41.00(from $39.00) | |
| Macquarie | Retained | Outperform | $48.00 | |
| Morgan Stanley | Retained | Overweight | $42.00(from $35.00) | |
| Ord Minnett | Retained | Accumulate | $42.00(from $37.10) | |
| RBC Capital Markets | Downgraded | Sector Perform(from Outperform) | $40.00(from $39.00) | |
| UBS | Retained | Buy | $39.00(from $36.65) | |
ANNAnsell | Macquarie | Retained | Neutral | $35.30(from $36.00) |
ARBARB Corporation | Citi | Retained | Neutral | $17.40 |
B4PBeforepay Group | Shaw and Partners | Retained | Buy | $2.90(from $2.70) |
BBTBETR Entertainment | Morgans | Retained | Buy | $0.36(from $0.35) |
| Ord Minnett | Retained | Buy | $0.37 | |
BETBetmakers Technology Group | Ord Minnett | Retained | Buy | $0.27(from $0.25) |
BOEBoss Energy | Argonaut Securities | Retained | Buy | $2.00 |
| Bell Potter | Retained | Buy | $1.80 | |
| Canaccord Genuity | Retained | Speculative Buy | $2.50(from $2.55) | |
| Citi | Retained | Neutral | $1.60 | |
| Euroz Hartleys | Retained | Hold | $1.37 | |
| Morgan Stanley | Retained | Overweight | $1.65(from $1.70) | |
| Morgans | Retained | Accumulate | $1.40(from $1.55) | |
| Ord Minnett | Retained | Hold | $1.40 | |
| RBC Capital Markets | Retained | Sector Perform | $1.30 | |
| Shaw and Partners | Retained | Buy | $3.08 | |
BTRBrightstar Resources | Shaw and Partners | Retained | Buy | $1.23 |
COHCochlear | Macquarie | Retained | Neutral | $115.00(from $119.00) |
CSLCSL | Bell Potter | Retained | Hold | $120.00(from $100.00) |
| Macquarie | Retained | Neutral | $108.00(from $114.00) | |
DMPDomino's Pizza Enterprises | Bell Potter | Retained | Hold | $18.50(from $18.00) |
| CLSA | Retained | Hold | $19.50(from $18.60) | |
| E&P | Retained | Neutral | $21.25 | |
| JPMorgan | Retained | Neutral | $21.30(from $22.00) | |
| Ord Minnett | Downgraded | Hold(from Buy) | $21.00 | |
| RBC Capital Markets | Retained | Sector Perform | $20.00(from $17.00) | |
EOLEnergy One | Bell Potter | Retained | Buy | $17.10 |
HLSHealius | Macquarie | Retained | Neutral | $0.39 |
IDXIntegral Diagnostics | Macquarie | Retained | Outperform | $3.50 |
IPXIperionX | Bell Potter | Retained | Speculative Buy | $5.60(from $8.25) |
LM8Lunnon Metals | Shaw and Partners | Retained | Buy | $0.60(from $0.92) |
LTRLiontown | Ord Minnett | Retained | Hold | $1.40(from $1.85) |
MAFMA Financial Group | Ord Minnett | Retained | Buy | $8.90(from $9.20) |
MINMineral Resources | Ord Minnett | Retained | Buy | $73.00(from $72.00) |
MMIMetro Mining | Ord Minnett | Retained | Buy | $2.50 |
MPLMedibank Private | Macquarie | Retained | Neutral | $4.90 |
NABNational Australia Bank | CLSA | Retained | Hold | $37.10 |
| JPMorgan | Retained | Neutral | $40.90(from $39.60) | |
| Ord Minnett | Retained | Hold | $37.00 | |
NEUNeuren Pharmaceuticals | Macquarie | Retained | Outperform | $19.10 |
NHFNIB Holdings | Macquarie | Retained | Underperform | $6.05 |
NSTNorthern Star Resources | Morgans | Downgraded | Accumulate(from Buy) | $24.00(from $26.00) |
PLSPLS Group | Bell Potter | Retained | Hold | $4.70(from $6.15) |
| Citi | Retained | Buy | $5.00 | |
| Jarden | Retained | Underweight | $3.10(from $3.00) | |
| Jefferies | Retained | Buy | $6.10 | |
| Macquarie | Retained | Outperform | $6.25 | |
| Morgan Stanley | Retained | Equal Weight | $5.15 | |
| Morgans | Retained | Hold | $4.60(from $4.80) | |
| RBC Capital Markets | Retained | Outperform | $5.50(from $7.00) | |
PMEPro Medicus | Macquarie | Retained | Outperform | $224.00(from $221.00) |
PNRPantoro Gold | Argonaut Securities | Retained | Buy | $2.90 |
| Bell Potter | Retained | Hold | $2.25(from $3.55) | |
| Canaccord Genuity | Retained | Speculative Buy | $4.20 | |
| Goldman Sachs | Retained | Buy | $3.40(from $3.35) | |
| Moelis Australia | Retained | Buy | $3.65 | |
| Ord Minnett | Retained | Buy | $4.45(from $4.55) | |
PNVPolynovo | Macquarie | Retained | Outperform | $1.30 |
PPTPerpetual | Citi | Retained | Neutral | $19.00 |
PRUPerseus Mining | Argonaut Securities | Retained | Buy | $8.10(from $7.70) |
| Citi | Retained | Buy | $7.00 | |
| Euroz Hartleys | Retained | Buy | $6.65(from $6.85) | |
| JPMorgan | Retained | Overweight | $6.20 | |
| Macquarie | Retained | Outperform | $5.50 | |
REGRegis Healthcare | Macquarie | Retained | Outperform | $7.90(from $8.50) |
RHCRamsay Health Care | Macquarie | Retained | Outperform | $47.00(from $43.40) |
RMDResMed Inc. | Macquarie | Retained | Outperform | $46.60 |
RSGResolute Mining | Canaccord Genuity | Retained | Buy | $2.25(from $2.45) |
SHLSonic Healthcare | Macquarie | Retained | Outperform | $23.60(from $27.50) |
TORTorque Metals | Morgans | Retained | Speculative Buy | $0.68(from $0.90) |
VEAViva Energy Group | Morgan Stanley | Retained | Equal Weight | $2.82(from $2.39) |
VULVulcan Energy Resources | Bell Potter | Retained | Speculative Buy | $4.50(from $6.10) |
WDSWoodside Energy Group | Morgans | Retained | Hold | $32.50(from $33.40) |
WTCWisetech Global | Macquarie | Retained | Outperform | $47.10(from $97.70) |
Scans
Top Gainers
Code | Company | Last | % Chg |
|---|---|---|---|
| GRS | Gwardar Resources Ltd | $0.41 | +105.00% |
| CYB | Aucyber Ltd | $0.062 | +47.62% |
| EOL | Energy One Ltd | $14.30 | +31.80% |
| CML | Connected Minerals Ltd | $0.38 | +28.81% |
| BGT | Bio-Gene Technology Ltd | $0.023 | +27.78% |
Top Fallers
Code | Company | Last | % Chg |
|---|---|---|---|
| AIH | Advanced Innergy Holdings Ltd | $0.355 | -38.79% |
| IS3 | I Synergy Group Ltd | $0.16 | -27.27% |
| PFT | Pure Foods Tasmania Ltd | $0.019 | -26.92% |
| HMI | Hiremii Ltd | $0.025 | -19.36% |
| GRV | Greenvale Energy Ltd | $0.028 | -17.65% |
52 Week Highs
Code | Company | Last | % Chg |
|---|---|---|---|
| GRS | Gwardar Resources Ltd | $0.41 | +105.00% |
| ORP | Orpheus Uranium Ltd | $0.11 | +11.11% |
| RHT | Resonance Health Ltd | $0.064 | +10.35% |
| LUX | LUX Copper Corp. Ltd | $0.325 | +8.33% |
| SRZ | Stellar Resources Ltd | $0.365 | +7.35% |
52 Week Lows
Code | Company | Last | % Chg |
|---|---|---|---|
| AIH | Advanced Innergy Holdings Ltd | $0.355 | -38.79% |
| PFT | Pure Foods Tasmania Ltd | $0.019 | -26.92% |
| GRV | Greenvale Energy Ltd | $0.028 | -17.65% |
| ALU | Alurion Resources Ltd | $0.90 | -14.29% |
| PIA | Pengana International Equities Ltd | $1.155 | -11.83% |
Near Highs
Code | Company | Last | % Chg |
|---|---|---|---|
| GLPR | iShares Ftse GBL Property Ex Aus (Aud Hedged) ETF | $29.48 | -0.51% |
| RHC | Ramsay Health Care Ltd | $44.34 | +0.34% |
| AN3PI | Australia and New Zealand Banking Group Ltd | $103.21 | +0.51% |
| WVOL | iShares MSCI World Ex Aust Minimum Volatility ETF | $45.64 | -0.96% |
| PYC | PYC Therapeutics Ltd | $1.70 | +1.49% |
Relative Strength Index (RSI) Oversold
Code | Company | Last | % Chg |
|---|---|---|---|
| WC8 | Wildcat Resources Ltd | $0.335 | +3.08% |
| LOT | Lotus Resources Ltd | $0.24 | -5.88% |
| LYC | Lynas Rare EARTHS Ltd | $14.09 | +2.03% |
| MAQ | Macquarie Technology Group Ltd | $60.40 | -1.26% |
| ARU | Arafura Rare EARTHS Ltd | $0.18 | +2.86% |
