
The ASX 200 fell on the final trading day of the financial year as institutional funds rebalanced portfolios, with a late-session sell-off in gold and real estate stocks coinciding with a rotation into the major banks. The benchmark closed FY26 up 6.1% — its weakest financial year performance since FY22.
Be sure to click/scroll through for the usual reporting of the major sector and stock-specific moves, the broker responses to them, as well as all the key economic data in tonight's Evening Wrap. Also, I have detailed technical analysis on the Nasdaq Composite and the S&P/ASX 200 in today's ChartWatch.
Let’s dive in!
Today in Review
Name | Value | % Chg |
|---|---|---|
Major Indices | ||
| ASX 200 | 8,778.7 | -0.51% |
| All Ords | 8,986.2 | -0.45% |
| Small Ords | 3,424.9 | -0.22% |
| All Tech | 3,030.6 | +1.33% |
| Emerging Companies | 2,928.4 | +0.38% |
Currency | ||
| AUD/USD | 0.6876 | -0.15% |
US Futures | ||
| S&P 500 | 7,502.75 | +0.03% |
| Dow Jones | 52,566.0 | -0.01% |
| Nasdaq | 30,100.75 | +0.16% |
Name | Value | % Chg |
|---|---|---|
Sector | ||
| Financials | 9,349.2 | +0.42% |
| Utilities | 9,679.8 | +0.39% |
| Energy | 9,487.6 | +0.38% |
| Information Technology | 1,821.2 | +0.35% |
| Health Care | 26,043.7 | -0.29% |
| Consumer Discretionary | 3,995.6 | -0.29% |
| Industrials | 8,459.3 | -0.37% |
| Communication Services | 1,623.2 | -0.73% |
| Consumer Staples | 13,341.8 | -0.80% |
| Materials | 23,387.7 | -1.61% |
| Real Estate | 3,652.5 | -2.22% |
ASX 200 Intraday Chart
%20intraday%20chart_30%20Jun.png)
Markets
The S&P/ASX 200 (XJO) finished 44.7 points lower at 8,778.7, 0.66% from its session high and smack–bang on its session low. In the broader-based S&P/ASX 300 (XKO) advancers lagged decliners by a rather pathetic 116 to 164.
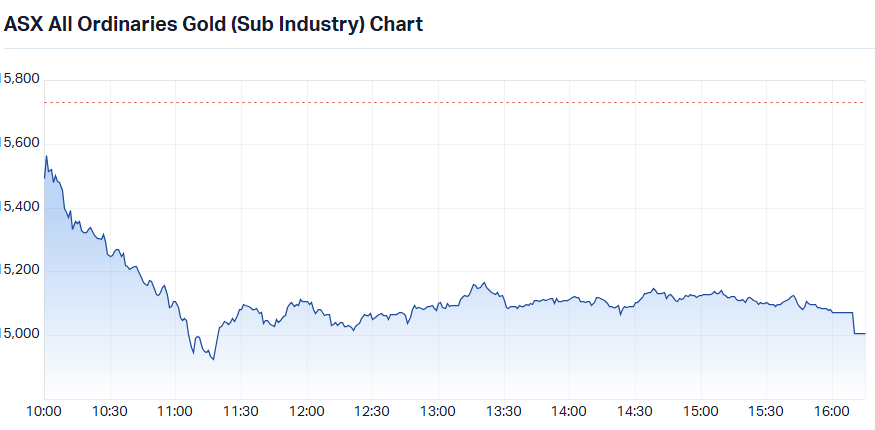
S&P/ASX All Ordinaries Gold Sub-Index intraday chart
The Gold Sub-Index (XGD) (-4.6%) was the session's standout casualty, hammered by a large, late-session sell order in the final hour of trade that the broader market struggled to explain on fundamentals alone — COMEX gold futures were essentially flat, up just 0.1% to US$4,043/oz, and COMEX silver futures actually gained 1.3% to US$59.39/oz.
The most plausible explanation is portfolio housekeeping: large funds appear to have used the final moments of the financial year to crystallise gains or rebalance sector weightings, with little regard for near-term commodity fundamentals. Perseus Mining (PRU) (-7.0%), Regis Resources (RRL) (-6.9%), Northern Star Resources (NST) (-5.8%), Pantoro Gold (PNR) (-5.3%), and Evolution Mining (EVN) (-5.2%) were all sharply lower.
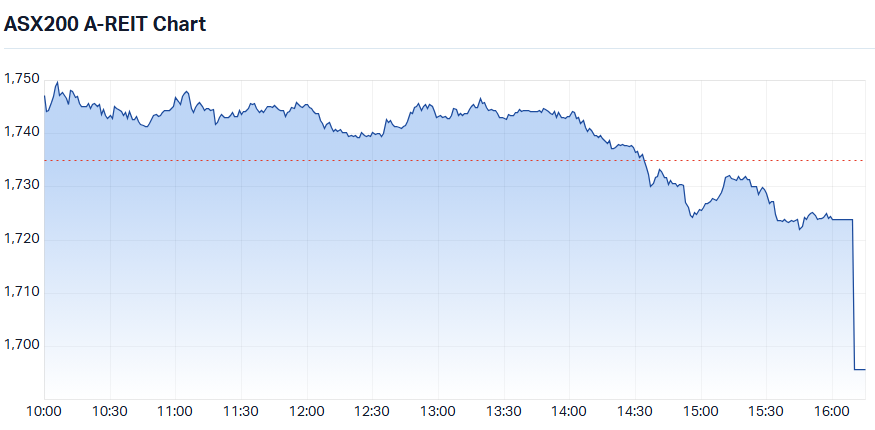
S&P/ASX 200 Real Estate Sector Index intraday chart
Real Estate (XPJ) (-2.3%) was caught in the same late-session sell-off, with the timing and magnitude of the move strongly suggesting it was part of the same large EOFY rebalancing trade that hit gold. Goodman Group (GMG) (-3.0%), Mirvac (MGR) (-2.6%), Dexus (DXS) (-2.2%), and Stockland (SGP) (-2.2%) all fell.
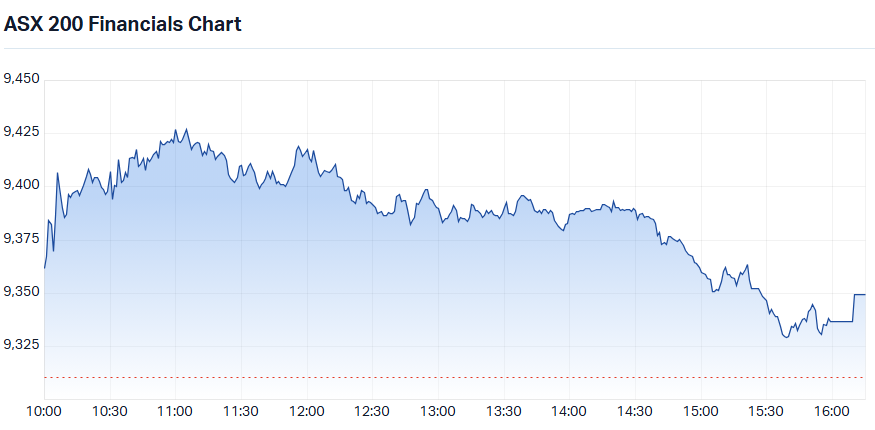
S&P/ASX 200 Financials Sector Index intraday chart
Financials (XFJ) (+0.4%) appeared to be the direct beneficiary EOFY trade — for as we know... If you are uncertain about where to stick excess cash in the ASX, you can always count on the relative safety and liquidity of the major banks. Zip Co (ZIP) (+3.5%), Washington H. Soul Pattinson (SOL) (+1.1%), Commonwealth Bank (CBA) (+0.6%) — which has now trimmed its FY26 total loss to 11% — and ANZ (ANZ) (+0.4%) all advanced.
Materials (XMJ) (-1.6%) was dragged down by the gold selling, but the sector's decline also smacked of EOFY squaring — as base metals prices were broadly positive overnight and into Asian trade, with COMEX copper futures rising 1.6% to US$6.264/lb and SGX iron ore futures adding 0.3% to US$99.15/t. The disconnect weighed on Lynas Rare Earths (LYC) (-2.5%), South32 (S32) (-2.0%), Fortescue (FMG) (-1.9%), Rio Tinto (RIO) (-0.9%), and BHP (BHP) (-0.7%).
Energy (XEJ) (+0.4%) advanced without following any obvious script, given ICE Brent crude futures actually fell 0.6% to US$73.49/bbl in Asian trade. Karoon Energy (KAR) (+5.8%) was the standout mover, bouncing from last week's savage losses, with Viva Energy (VEA) (+1.0%), Woodside Energy (WDS) (+0.9%), and Santos (STO) (+0.8%) also firmer.
Information Technology (XIJ) (+0.3%) tracked a strong overnight lead from US technology stocks — a session where the sector-level logic at least held together cleanly. Megaport (MP1) (+6.4%), Weebit Nano (WBT) (+3.1%), Dicker Data (DDR) (+3.0%), and Life360 (360) (+1.6%) all advanced.
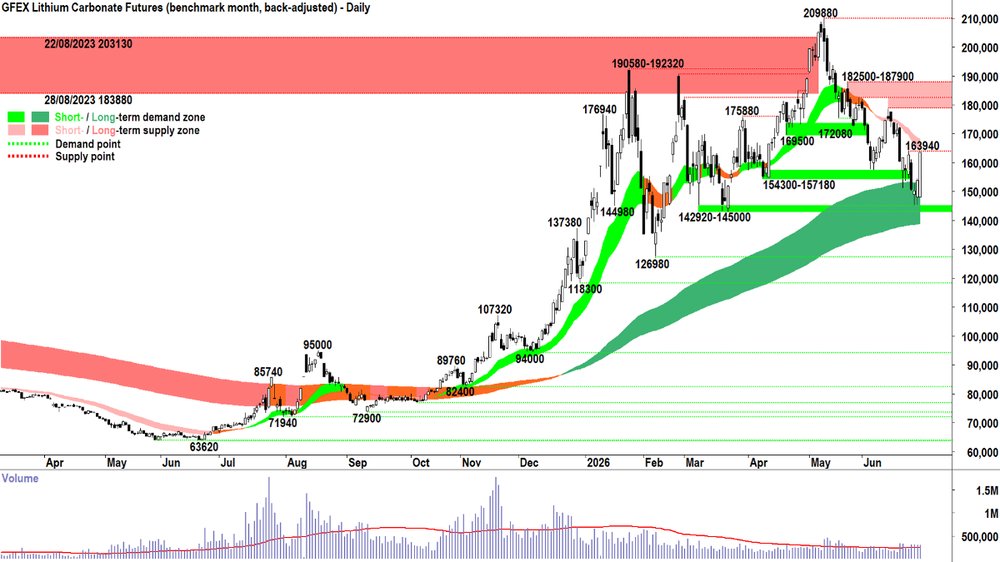
Lithium Carbonate Futures (Benchmark month, back-adjusted) GFEX
Lithium stocks were broadly higher as GFEX lithium carbonate futures staged a significant rally from a key technical support zone — the second consecutive session this has occurred — surging 6.1% to CNY 163,360/t.
Gains in equities were comparatively modest set against the scale of recent losses, and Pilbara Minerals (PLS) (-1.2%) notably missed out on the rally entirely. Wildcat Resources (WC8) (+3.0%), Galan Lithium (GLN) (+2.8%), Core Lithium (CXO) (+2.0%), Liontown Resources (LTR) (+1.5%), and Vulcan Energy Resources (VUL) (+1.3%) all advanced.
Today's best ASX Top 300 gainers
Company | Last Price | Change $ | Change % | 1mo % | 1yr % |
|---|---|---|---|---|---|
| Artrya (AYA) | $6.10 | +$0.78 | +14.7% | +23.2% | +747.2% |
| Cobram Estate Olives (CBO) | $4.40 | +$0.33 | +8.1% | +6.8% | +106.6% |
| Neuren Pharmaceuticals (NEU) | $17.75 | +$1.15 | +6.9% | +22.1% | +25.8% |
| Electro Optic Systems Holdings (EOS) | $10.30 | +$0.64 | +6.6% | -7.5% | +261.4% |
| Megaport (MP1) | $21.58 | +$1.29 | +6.4% | +44.0% | +54.7% |
| IperionX (IPX) | $4.08 | +$0.23 | +6.0% | -30.0% | -14.1% |
| Karoon Energy (KAR) | $1.455 | +$0.08 | +5.8% | -25.6% | -24.2% |
| Elsight (ELS) | $7.10 | +$0.34 | +5.0% | -6.7% | +300.0% |
| Nickel Industries (NIC) | $0.95 | +$0.04 | +4.4% | -10.4% | +36.7% |
| Arafura Rare Earths (ARU) | $0.245 | +$0.01 | +4.3% | -7.5% | +40.0% |
| Computershare (CPU) | $38.28 | +$1.46 | +4.0% | +10.7% | -4.0% |
| DroneShield (DRO) | $2.42 | +$0.09 | +3.9% | -28.6% | +6.1% |
| Sunrise Energy Metals (SRL) | $17.23 | +$0.64 | +3.9% | +8.4% | +2040.4% |
| Regal Partners (RPL) | $2.88 | +$0.10 | +3.6% | +9.5% | +32.7% |
| EQ Resources (EQR) | $0.29 | +$0.01 | +3.6% | +26.1% | +607.3% |
| Contact Energy (CEN) | $7.83 | +$0.27 | +3.6% | -3.1% | -6.2% |
| AMP (AMP) | $1.605 | +$0.055 | +3.5% | +0.6% | +27.4% |
| Zip Co (ZIP) | $3.24 | +$0.11 | +3.5% | +40.9% | +5.5% |
| Catapult Sports (CAT) | $3.07 | +$0.10 | +3.4% | -8.9% | -47.6% |
| Judo Capital Holdings (JDO) | $0.94 | +$0.03 | +3.3% | -39.7% | -39.9% |
Today's worst ASX Top 300 losers
Company | Last Price | Change $ | Change % | 1mo % | 1yr % |
|---|---|---|---|---|---|
| Minerals 260 (MI6) | $0.73 | -$0.085 | -10.4% | -13.6% | +508.3% |
| Resolute Mining (RSG) | $0.945 | -$0.085 | -8.3% | -26.5% | +54.9% |
| Ricegrowers (SGLLV) | $13.96 | -$1.24 | -8.2% | +14.9% | +25.2% |
| Vault Minerals (VAU) | $4.17 | -$0.32 | -7.1% | -0.7% | +52.7% |
| Perseus Mining (PRU) | $4.80 | -$0.36 | -7.0% | -7.2% | +41.2% |
| Regis Resources (RRL) | $6.03 | -$0.45 | -6.9% | -1.5% | +37.4% |
| Ora Banda Mining (OBM) | $1.055 | -$0.07 | -6.2% | -22.7% | +37.9% |
| Northern Star Resources (NST) | $18.95 | -$1.17 | -5.8% | +0.7% | +2.2% |
| Abacus Group (ABG) | $0.965 | -$0.055 | -5.4% | -6.8% | -13.8% |
| Pantoro Gold (PNR) | $2.31 | -$0.13 | -5.3% | -23.0% | -23.8% |
| Kingsgate Consolidated (KCN) | $4.95 | -$0.27 | -5.2% | -18.6% | +119.0% |
| Evolution Mining (EVN) | $11.75 | -$0.64 | -5.2% | -3.2% | +50.8% |
| Genesis Minerals (GMD) | $5.21 | -$0.28 | -5.1% | -11.1% | +21.2% |
| Domino's Pizza Enterprises (DMP) | $15.63 | -$0.82 | -5.0% | -13.1% | -18.9% |
| Ramelius Resources (RMS) | $2.92 | -$0.15 | -4.9% | -9.3% | +15.9% |
| Greatland Resources (GGP) | $11.45 | -$0.57 | -4.7% | -16.1% | +61.0% |
| West African Resources (WAF) | $2.68 | -$0.12 | -4.3% | -15.5% | +18.1% |
| Whitehaven Coal (WHC) | $7.63 | -$0.34 | -4.3% | -12.8% | +40.5% |
| Predictive Discovery (PDI) | $0.68 | -$0.03 | -4.2% | -8.1% | +76.6% |
| Emerald Resources NL (EMR) | $5.49 | -$0.22 | -3.9% | -7.3% | +40.1% |
Chartwatch
Nasdaq Composite Index
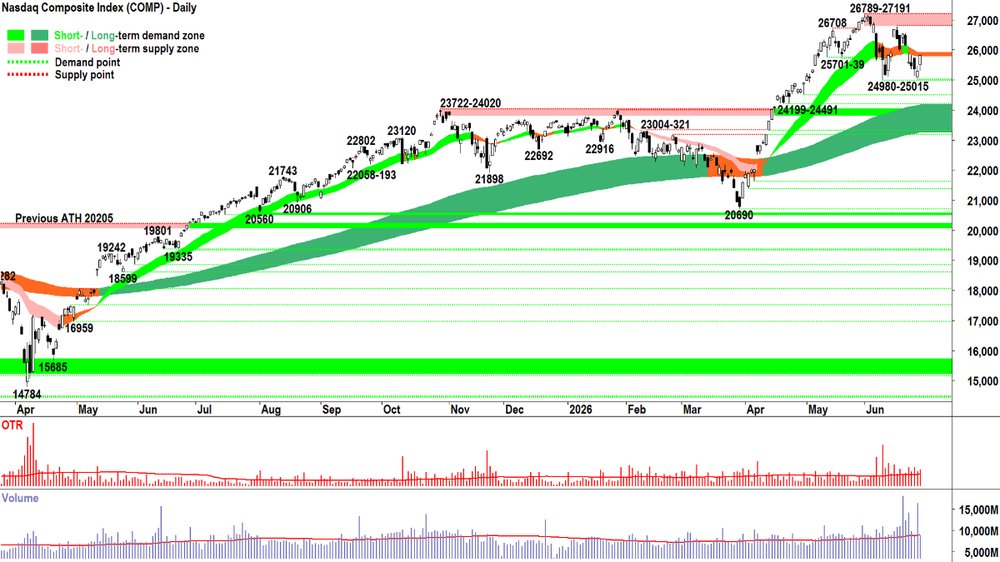
Nasdaq Composite Index chart
Analysis
Clean.
As a whistle. D > S = P ⬆️
There was some excess supply early, but it met a wall of demand... Which persisted into the close.
Above average OTR = A notable session.
Only average volume... But this is super interesting in its own right!!!
Why? Because it begs the question: Has the elevated supply side engagement come to an end? 🤔
If it has, then in its place, all that remains is... The same insatiable demand that we've grown to expect from the Comp in a bull market! 🚀
This is a very likely possibility.
However, as clear a demand-side-dominant showing that Monday's candle was – it would be unwise to get too far ahead of ourselves given:
The short term trend ribbon is still signalling equilibrium (it's very flat and very amber)
Price action is compressing lower peaks and rising troughs (also signalling short term equilibrium)
Candles are roughly balanced (i.e., ZEBRA! 🦓) rather than signalling clear demand side control
These are the most tricky period's for trend followers like me: a strong signal in an otherwise still-tentative demand-supply environment. The long term uptrend is a valuable guide – as I've said many times here before – never doubt the ability of the Comp to manufacture the most incredible rally out of seemingly nowhere (no rhyme, no reason – just is! 😉).
Before I up my portfolio risk setting from 1/2RP to 2/3RP, let me see at least a strong close above the short term trend ribbon (presently 25795-25912) – but preferably also a strong challenge to the 26789-27191 supply zone. That's the big one...
FOMO is catching, granted, and it makes my conservatism appear unwarranted... But if the next leg resembles the last leg: i.e., +6000-odd points... Then what's the harm in making sure? 🤷
View
I am 1/2RP on the Comp ⚖️ (RP = Risk Position — it reflects my personal allowable capital allocation limit for my investments in US stocks. So 1/2RP is 50%, 2/3RP is 67% and FRP is 100% 🪣).
Key Levels
26789-27191 is the key zone of supply. 24980 is the key point of demand. The short term uptrend ribbon (presently 25795-25912) will likely also act as a zone of dynamic excess supply.
S&P/ASX 200 (XJO)
%20chart_30%20Jun.png)
S&P/ASX 200 (XJO) chart
Analysis
8 days of light green short term uptrend ribbon, two days of amber, and today – back to light green.
I didn't program the ribbons to flip-flop like that, and ordinarily, I hope you agree they don't do it very often... But the math of it is both painful and simple: when the price action is so choppy and net-net flat – the short term trend ribbon is prone to some flip-flop!
And then we get to the fact that today's candle is such a pathetic follow up to the strong demand side showings of the prior two. But neither you, nor I, are surprised! 🤦
As stupid-and-fund-flows-manipulated as today's candle is – it adds so little to the demand-supply picture: I am going to refrain from even analysing it.
There's no change to the prevailing sideways chop. 🪓🪓🪓
The return to double green suggests a positive bias, but not enough yet to convince me to improve upon my 1/2RP stance.
View
I am 1/2RP on the OTP (i.e., my personal allowable capital allocation limit for my investments in Australian stocks is 50%).
Key levels
8984-9022 is the key zone of supply. Beyond that, it's 9201. Demand is 8708, but the long-term trend ribbon (presently 8699-8749) will likely also come into play as a dynamic zone of excess demand.
(Glossary of acronyms! OTP (Old Tin Pot): S&P/ASX 200 | MOTN: More Often Than Not | FOMO: Fear Of Missing Out | HOFU: Holding On For Upside | BTD: Buy The Dip | NUTE: No Urgency To Enter | FOHO: Fear Of Holding On | STR: Sell The Rally | RP: Risk Position)
***CHARTWATCH LIVE WEBINARS 📺🍿***
BHP & RIO vs CSL battle royale! Is the ASX Resources run over!? Copper, Iron Ore, Lithium and more
ChartWatch LIVE Webinar
ChartWatch LIVE Webinars – WEEKLY Wednesday's @ 12pm AEDT
Learn more about technical analysis and trend following through real case studies on ASX stocks. Australia's premier technical analyst, Carl Capolingua, shares his unique insights on stocks as requested by viewers. Ask about a company in your portfolio or anything related to trading and investing and get Carl's expert opinion.
Places are limited so >REGISTER NOW!<
Economy
Today
11:30 AUS May Private Sector Credit
Result: +0.7% m/m vs +0.6% m/m forecast and +0.7% m/m in April (solid result, i.e., consumers continue to borrow, and slightly higher than expected)
11:30 CHN June Purchasing Managers Index (PMI)
Manufacturing: 50.3 vs 50.2 forecast and 50.0 in May (readings over 50 indicate growth in a sector, so the Chinese manufacturing sector grew modestly in June, and slightly better than expected)
Services: 50.2 vs 49.9 forecast and 50.1 in May (modest growth versus a forecast decline)
Later this week
Wednesday
00:00 USA May Conference Board Consumer Confidence (94.2 forecast vs 93.1 in April)
00:00 USA May JOLTS Job Openings (7.28 million forecast vs 7.62 million in April)
11:30 AUS May Building Approvals (+0.2% m/m forecast vs -3.4% in April)
19:00 EUR June Core Consumer Price Index (CPI) Flash Estimate (+2.5% p.a. forecast vs +% p.a. in May)
23:00 USA Federal Reserve Chairman Kevin Warsh Speaks
Thursday
00:00 USA June Institute of Supply Managers (ISM) Manufacturing PMI
PMI: 53.7 forecast vs 54.0 in May
Prices: 79.0 forecast vs 82.1 in May
22:30 USA June Non-Farm Payrolls
Employment change: +114,000 forecast vs +172,000 in May
Unemployment rate: 4.3% forecast, unchanged
Average hourly earnings: +0.3% m/m forecast vs +0.3% m/m in May
Friday
ALL DAY USA Independence Day Holiday
Interesting Movers
Trading higher
- Tivan (TVN) $0.30+11.3%
Rose after awarding an early contractor involvement contract to MDM Mining & Civil for the access road design for the Speewah Fluorite Project as it progresses a Definitive Feasibility Study.
- Euroz Hartleys Group (EZL) $1.35+8.0%
Rose after agreeing to sell its Capital Markets business to BMO Financial Group for A$145 million; the sale realises value for shareholders and Euroz Hartleys will continue as a standalone private wealth business.
- Arafura Rare Earths (ARU) $0.25+4.3%
Rose after signing a binding term sheet with a member of an Indian industrial group for 500 tpa of NdPr oxide over a minimum five-year period (option to extend two years) with pricing based on a seaborne traded index to support development of the Nolans project.
- Capricorn Metals (CMM) $12.64+0.6%
Rose after subsidiary Crimson Metals received approval from the Commonwealth Department of Climate Change, Energy, the Environment and Water (DCCEEW) for expansion and operation of the Mount Gibson Gold Project, allowing progress on capital purchasing and contracts.
- Brazilian Critical Minerals (BRC) $0.000.0%
Rose after announcing completion of its Bankable Feasibility Study (BFS) on the 100%-owned Ema Rare Earths Project; BFS confirms Ema as a long-life, economically resilient project with post-tax NPV US$1.47B (assuming NdPr US$108/kg) and a payback period of 6 months.
Trading Lower
- Berkeley Energia (BKY) $0.46-6.1%
Fell after subsidiary Berkeley Exploration filed for arbitration against the Kingdom of Spain before ICSID alleging Energy Charter Treaty violations and seeking compensation in the order of US$1.25 billion relating to actions against the Salamanca project.
- Domino's Pizza Enterprises (DMP) $15.63-5.0%
Fell after announcing the Master Franchise Agreements for France and Belgium have been extended to 30 September 2026 to allow completion of renewal legal agreements and compliance with local regulatory preconditions.
- Collins Foods (CKF) $8.15-2.5%
Fell after reporting underlying net profit of $61.4 million for FY26 (2% above consensus) and noting weaker trading in Germany and the Netherlands (down 7.2% and 7.8% respectively) despite 4% same-store sales growth in the first eight weeks of 2026-27.
Broker Moves
Company | Broker | Action | Rating | Price Target |
|---|---|---|---|---|
AEUAtomic Eagle | Shaw and Partners | Retained | Buy | $1.40 |
ALKAlkane Resources | UBS | Retained | Buy | $2.15(from $2.30) |
ASGAutosports Group | UBS | Retained | Buy | $2.90(from $3.35) |
ASLAndean Silver | Canaccord Genuity | Retained | Speculative Buy | $6.00 |
AX1Accent Group | Citi | Retained | Neutral | $0.65 |
| Morgan Stanley | Retained | Equal Weight | $0.75 | |
BGLBellevue Gold | UBS | Retained | Buy | $1.80(from $2.00) |
BMNBannerman Energy | Shaw and Partners | Retained | Buy | $6.50 |
BOEBoss Energy | Morgan Stanley | Retained | Overweight | $1.80 |
BRIBig River Industries | Ord Minnett | Retained | Buy | $1.65(from $1.70) |
CHNChalice Mining | UBS | Retained | Buy | $2.00(from $3.00) |
CKFCollins Foods | Citi | Initiated | Buy | $10.30 |
CNICenturia Capital Group | Jarden | Downgraded | Overweight(from Buy) | $2.15(from $2.10) |
COHCochlear | Macquarie | Retained | Neutral | $119.00(from $115.00) |
CRNCoronado Global Resources Inc | UBS | Downgraded | Neutral(from Buy) | $0.21(from $0.38) |
CSLCSL | Citi | Retained | Neutral | $110.00 |
| Macquarie | Retained | Neutral | $114.00(from $111.00) | |
| Ord Minnett | Retained | Hold | $117.00 | |
CYLCatalyst Metals | Morgans | Retained | Buy | $13.58(from $15.13) |
DRRDeterra Royalties | Morgan Stanley | Retained | Overweight | $4.45 |
| UBS | Retained | Neutral | $4.75(from $3.95) | |
EVNEvolution Mining | Morgans | Retained | Accumulate | $15.00(from $16.00) |
| UBS | Downgraded | Neutral(from Buy) | $12.60(from $14.00) | |
FHEFrontier Energy | Ord Minnett | Initiated | Speculative Buy | $0.34 |
FMGFortescue | Morgan Stanley | Retained | Underweight | $18.85 |
GGPGreatland Resources | Argonaut Securities | Retained | Buy | $14.80(from $15.20) |
| Citi | Retained | Buy | $16.00 | |
| Macquarie | Retained | Outperform | $14.00 | |
| Moelis Australia | Retained | Sell | $12.10 | |
IGOIGO | Morgan Stanley | Retained | Underweight | $6.85 |
ILUIluka Resources | Morgan Stanley | Retained | Overweight | $7.95 |
JBHJB Hi-Fi | Bell Potter | Retained | Buy | $87.00 |
| UBS | Downgraded | Neutral(from Buy) | $83.00(from $85.00) | |
KARKaroon Energy | Jarden | Retained | Buy | $2.25(from $2.30) |
| Morgans | Upgraded | Buy(from Hold) | $1.77(from $1.67) | |
| RBC Capital Markets | Retained | Sector Perform | $2.25(from $2.30) | |
LYCLynas Rare Earths | Morgan Stanley | Retained | Equal Weight | $20.45 |
MGRMirvac Group | Citi | Upgraded | Buy(from Neutral) | $2.00(from $1.84) |
MINMineral Resources | UBS | Retained | Buy | $79.00(from $83.00) |
NEMNewmont Corporation | Morgans | Retained | Buy | $198.00(from $206.00) |
| UBS | Retained | Buy | $180.00(from $195.00) | |
NEUNeuren Pharmaceuticals | Macquarie | Retained | Outperform | $19.10 |
NICNickel Industries | UBS | Retained | Buy | $1.20(from $0.95) |
NSTNorthern Star Resources | Argonaut Securities | Downgraded | Hold(from Buy) | $22.00(from $25.00) |
| Morgans | Retained | Buy | $26.00(from $30.00) | |
| UBS | Retained | Buy | $23.75(from $24.35) | |
PDNPaladin Energy | Morgan Stanley | Retained | Overweight | $13.65 |
PLSPLS Group | Morgan Stanley | Retained | Equal Weight | $5.60 |
PNRPantoro Gold | UBS | Retained | Buy | $5.10(from $6.20) |
PXAPEXA Group | Macquarie | Retained | Outperform | $19.05 |
RIORio Tinto | Morgan Stanley | Retained | Equal Weight | $171.50 |
| UBS | Retained | Neutral | $183.00 | |
RMSRamelius Resources | Morgans | Retained | Buy | $5.80(from $6.10) |
| UBS | Retained | Buy | $4.85(from $5.00) | |
RPLRegal Partners | Canaccord Genuity | Initiated | Buy | $3.75 |
RRLRegis Resources | Morgans | Retained | Buy | $9.39(from $10.07) |
S32South32 | Morgan Stanley | Retained | Overweight | $4.85 |
SFRSandfire Resources | Morgan Stanley | Retained | Underweight | $16.00 |
SGPStockland | Citi | Upgraded | Buy(from Neutral) | $5.10(from $4.30) |
SX2Southern Cross Gold Consolidated | UBS | Retained | Buy | $12.25(from $12.50) |
TCLTransurban Group | Citi | Retained | Neutral | $15.80 |
TLSTelstra Group | Bell Potter | Retained | Buy | $5.10 |
WHCWhitehaven Coal | Morgan Stanley | Retained | Overweight | $9.55 |
| UBS | Downgraded | Neutral(from Buy) | $8.70(from $9.10) |
Scans
Top Gainers
Code | Company | Last | % Chg |
|---|---|---|---|
| BMH | Baumart Holdings Ltd | $0.035 | +483.33% |
| SDV | Scidev Ltd | $0.145 | +38.10% |
| PCL | Pancontinental Energy NL | $0.011 | +37.50% |
| SP3 | Spectur Ltd | $0.015 | +36.36% |
| ATV | Activeport Group Ltd | $0.026 | +30.00% |
Top Fallers
Code | Company | Last | % Chg |
|---|---|---|---|
| ACS | Accent Resources NL | $0.025 | -35.90% |
| TRM | Truscott Mining Corporation Ltd | $0.04 | -33.33% |
| MEL | Metgasco Ltd | $0.011 | -21.43% |
| TD1 | Tali Digital Ltd | $0.063 | -20.25% |
| CHRCB | Charger Metals NL | $0.016 | -20.00% |
52 Week Highs
Code | Company | Last | % Chg |
|---|---|---|---|
| BMH | Baumart Holdings Ltd | $0.035 | +483.33% |
| BCM | Brazilian Critical Minerals Ltd | $0.058 | +23.40% |
| AYA | ARTRYA Ltd | $6.10 | +14.66% |
| AAP | Australian Agricultural Projects Ltd | $0.074 | +13.85% |
| APW | Aims Property Securities Fund | $4.16 | +12.43% |
52 Week Lows
Code | Company | Last | % Chg |
|---|---|---|---|
| TRM | Truscott Mining Corporation Ltd | $0.04 | -33.33% |
| MEL | Metgasco Ltd | $0.011 | -21.43% |
| CHRCB | Charger Metals NL | $0.016 | -20.00% |
| HAL | Halo Technologies Holdings Ltd | $0.012 | -14.29% |
| RBX | Resource Base Ltd | $0.025 | -13.79% |
Near Highs
Code | Company | Last | % Chg |
|---|---|---|---|
| GLPR | iShares Ftse GBL Property Ex Aus (Aud Hedged) ETF | $29.63 | -0.50% |
| RHC | Ramsay Health Care Ltd | $43.98 | -0.32% |
| WVOL | iShares MSCI World Ex Aust Minimum Volatility ETF | $46.39 | +0.63% |
| PYC | PYC Therapeutics Ltd | $1.685 | +2.12% |
| EGH | Eureka Group Holdings Ltd | $0.675 | +0.75% |
Relative Strength Index (RSI) Oversold
Code | Company | Last | % Chg |
|---|---|---|---|
| NVX | Novonix Ltd | $0.15 | +3.45% |
| JPHQ | Jpmorgan US 100Q EQ Prem Inc (Hedged) Active ETF | $57.25 | +1.71% |
| JHGA | JPM GBL Equity Premium Income Hedged Complex ETF | $43.82 | -0.57% |
| IRI | Integrated Research Ltd | $0.27 | -3.57% |
| JDO | Judo Capital Holdings Ltd | $0.94 | +3.30% |
