
News | Market Wraps
Evening Wrap: ASX 200 dips as iron ore stocks FMG, CIA and RIO tumble, banks and Woodside bounce
The S&P/ASX 200 closed 11.2 points lower, down 0.14%.

Mentioned
The S&P/ASX 200 closed 11.2 points lower, down 0.14%.
A rally in major banking stocks, plus a tidy post-rating upgrade gain for Woodside Energy (WDS) helped the ASX 200 avoid a much bigger loss as threatened by the opening decline.
Elsewhere, continued simmering global growth concerns weighed on commodities prices, and therefore on stocks in the Resources sector. Key iron ore stocks were particularly harshly dealt with as the price of iron ore again traded lower in Singapore today. Gold stocks also pulled-back with the gold price.
Click/scroll through for the usual reporting of the major sector and stock-specific moves, the broker responses to them, as well as all the key upcoming economic data in tonight's Evening Wrap.
Also, I have detailed technical analysis on US 10-year T-Bond yields, the NASDAQ Composite, the Russell 200 and the ASX200 in today's ChartWatch.
Let's dive in!
Today in Review
Wed 26 Feb 25, 5:36pm (AEST)
Name | Value | % Chg |
|---|---|---|
Major Indices | ||
| ASX 200 | 8,240.7 | -0.14% |
| All Ords | 8,477.3 | -0.24% |
| Small Ords | 3,152.7 | -0.67% |
| All Tech | 3,799.0 | -1.26% |
| Emerging Companies | 2,312.5 | -1.74% |
Currency | ||
| AUD/USD | 0.6325 | -0.30% |
US Futures | ||
| S&P 500 | 5,992.25 | +0.37% |
| Dow Jones | 43,771.0 | +0.19% |
| Nasdaq | 21,268.0 | +0.56% |
Name | Value | % Chg |
|---|---|---|
Sector | ||
| Energy | 8,364.7 | +1.29% |
| Financials | 8,691.7 | +0.71% |
| Industrials | 7,995.8 | +0.51% |
| Health Care | 43,680.9 | +0.36% |
| Utilities | 9,129.2 | +0.23% |
| Consumer Discretionary | 4,066.2 | +0.06% |
| Information Technology | 2,603.6 | -0.52% |
| Consumer Staples | 12,110.0 | -1.10% |
| Communication Services | 1,671.5 | -1.12% |
| Real Estate | 3,735.9 | -1.31% |
| Materials | 16,491.0 | -1.61% |
Markets

ASX 200 Session Chart
The S&P/ASX 200 (XJO) finished 11.2 points lower at 8,240.7, 0.37% from its session low and 0.17% from its high. In the broader-based S&P/ASX 300 (XKO), advancers again lagged decliners by a sizeable margin, this time by 108 to 174.
At the top line, a rebound in banking / Financials (XFJ) (+0.71%) stocks helped the index claw back early losses – for the second time this week. Unfortunately, today's rally from the opening lows was not as emphatic as Monday's, leaving some questions with respect to Aussie investors' appetite to buy the dip (more on this issue and the current dip in ChartWatch below).
A rally in Woodside Energy (ASX: WDS) (+3.4%) spurred by several broker target price increases in response to yesterday's results, plus and a rating upgrade to Buy from Neutral at Citi, helped Energy (XEJ) (+1.3%) to best-sector honours today.
Like yesterday, defensives/bond proxies Health Care (XHJ) (+0.36%) and Utilities (XUJ) (+0.23%) also eked gains. It's what happens when investors don't want to play complete risk-on but they still have to put some cash to work.
Simmering global growth concerns weighed on commodities pricing over the past 24-hours, and therefore, on stock prices in the Resources (XJR) (-1.5%) sector today.
Particularly harshly dealt with were iron ore stocks, with Rio Tinto (ASX: RIO) (-3.4%), Champion Iron (ASX: CIA) (-5.4%), and BHP Group (ASX: BHP) (-1.5%) each getting a touch-up. Fortescue (ASX: FMG) (-6.2%) looked the worst, but it did go ex-dividend today by $0.50 fully franked (i.e., accounting for about half of its decline).
A pullback in the gold price similarly hampered the Gold (XGD) sub-index (-2.0%).
These were all top line items, generally consistent with recent themes or relevant sector heavyweight moves.
Below the surface, however, there was both ecstasy and carnage. Which version the stocks in your portfolio experienced depended on whether they beat or missed the all important consensus estimates for whichever earnings results they released today.
Moves in the substantial double-digits were not uncommon (throw in a takeover for betting tech company Pointsbet (ASX: PBH) (+33%)) and it will make for some very interesting reading in the aptly named Interesting Moves section below!
ChartWatch
US 10 Year T-Bond Yield

Risk has taken a beating last few trading sessions...🤕 (click here for full size image)
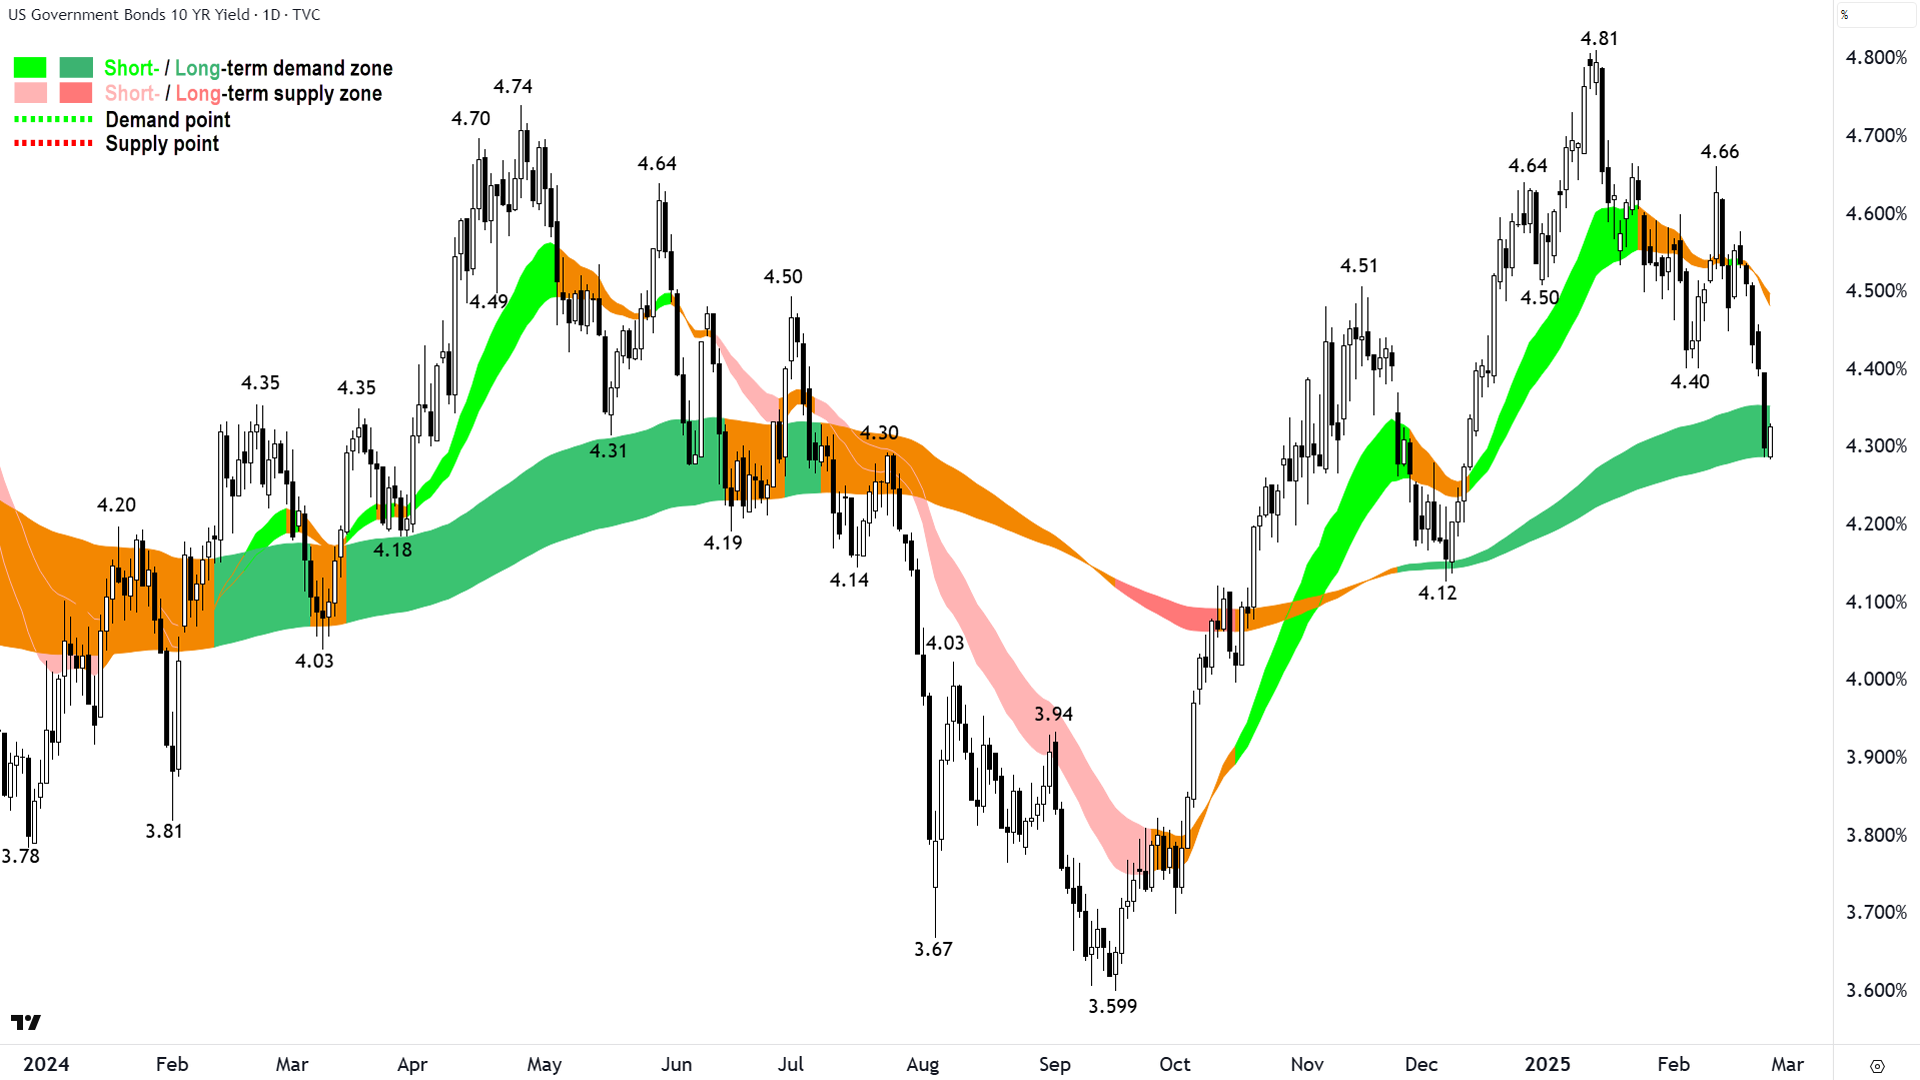
A picture tells a thousand words, as does a slew of black candles...
Yields down – sharply – order of magnitude one and a half times a regular 0.25% rate cut from the Fed since that last 12 Feb peak at 4.66%.
It represents both a major repricing of the health of the US and global economies, the fact that lower and not higher interest rates are more likely in response, and a rush to the relative safe haven of risk-free bonds (that were yielding roughly three-and-half times the S&P 500's dividend yield when this last move began!).
In short: Risk has taken a beating over the last few sessions.
The last white candle on the chart above is live, so we must discount it. But, it's exactly the kind of showing we'll need to see here over the next few sessions to steady the ship in Risk Land (aka the stock market!).
When investors are obsessed with falling growth and other potential exogenous shocks, stocks prefer not to see lower risk-free market yields. I get this is confusing, because typically, when markets aren't of a risk-off mindset, lower risk-free yields are typically favoured by stock investors.
NASDAQ Composite Index

Close to the brink...😨 (click here for full size image)
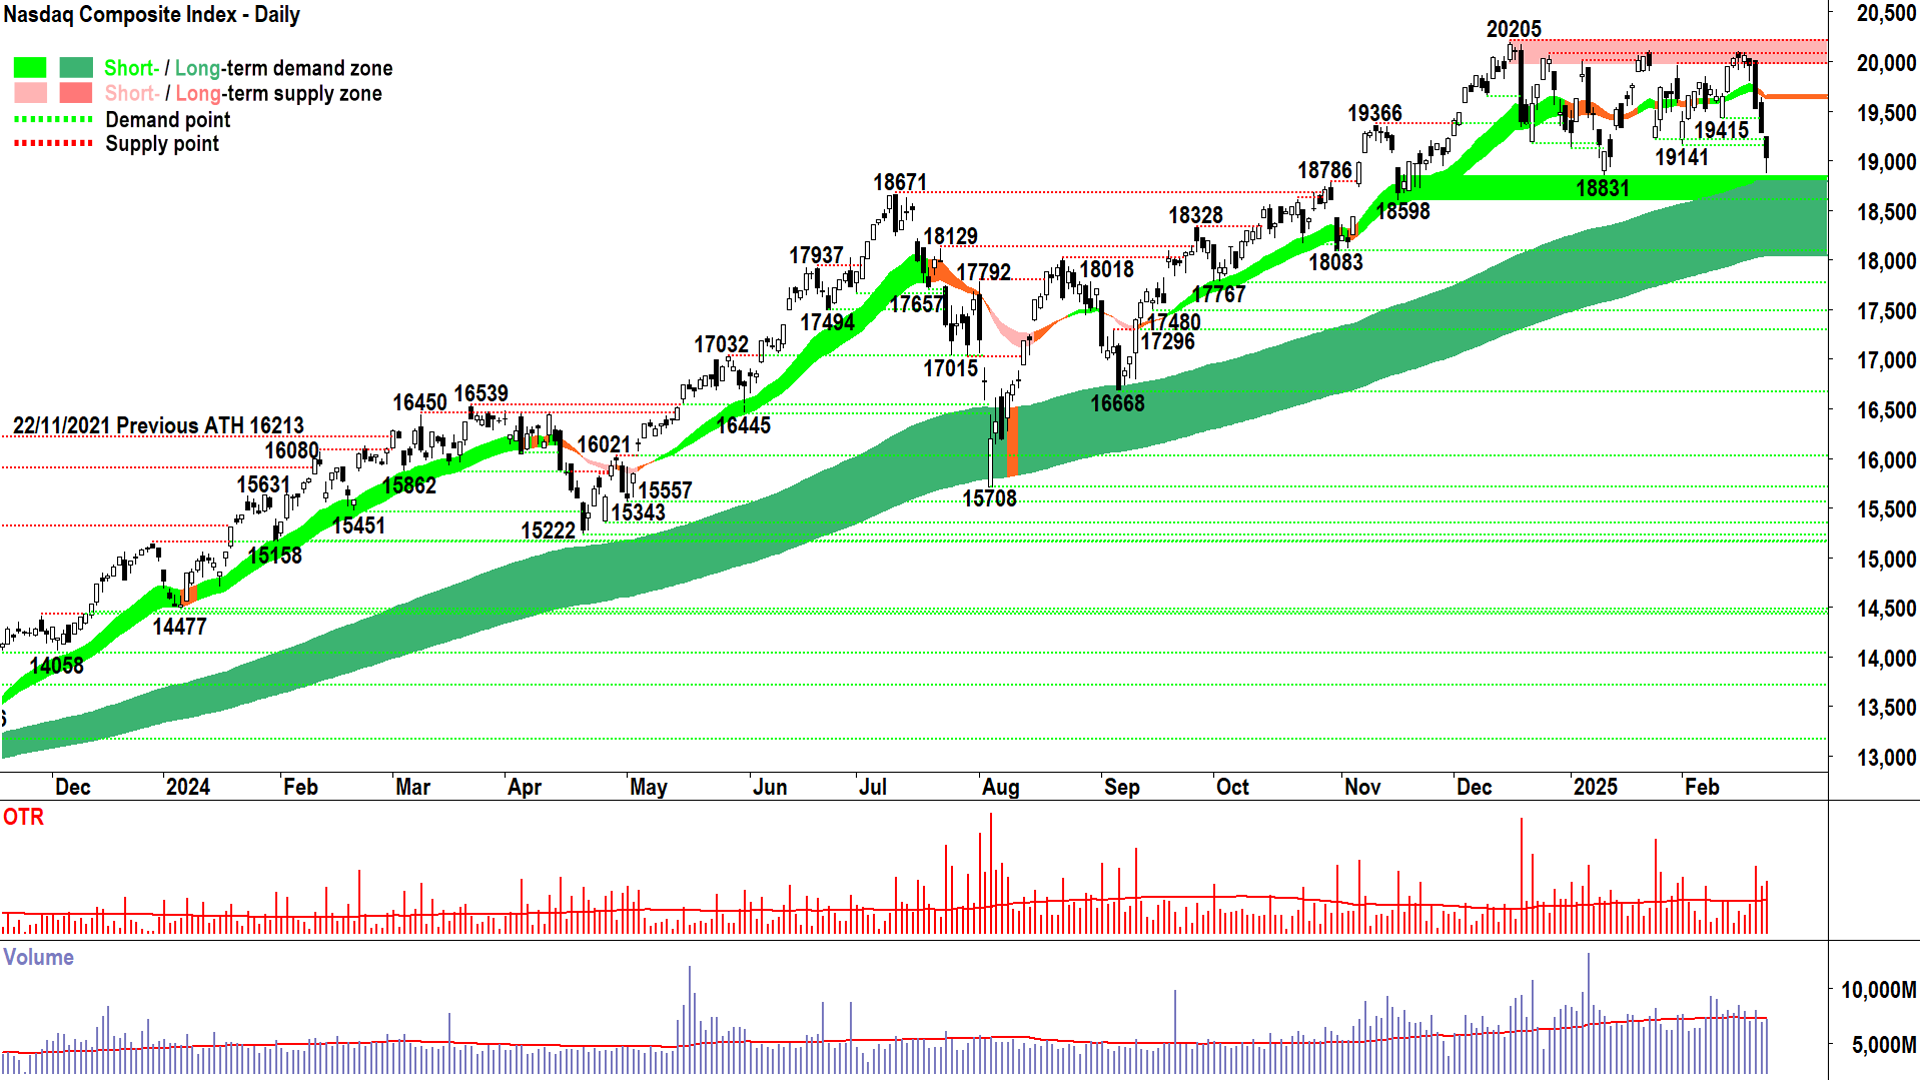
The above chart has caused us to arrive here – at the potential dynamic demand of the long term uptrend ribbon on the Comp. It's the great big dark green caterpillar crawling from bottom left to top right across the above chart.
It has, since its formation, by pure coincidence, repelled several at-the-time-seemingly-worrying pullbacks.
We're just about at the dark green caterpillar again. Will history repeat?
No idea. I can't tell the future! 🔮
But I do know that more often than not the long term trend ribbon is usually pretty good at repelling most at-the-time-seemingly-worrying pullbacks during a long term uptrend, and most at-the-time-seemingly-promising rallies during a long term downtrend. No doubt you've observed it yourself in countless ChartWatch ASX Scans examples.
I have no reason to assume otherwise at this stage...but...I would prefer to see the fingerprints of demand appearing at the long term uptrend ribbon to increase the probability it will do its job again this time.
So, this means the appearance of demand-side candles (i.e., white candles and or downward pointing shadows like the modest one last night), setting of rising troughs and subsequently also rising peaks, a return to a predominance if demand-side candles more generally, and an eventual close back above the short term trend ribbon.
The opposite would suggest a greater probability we're set for a more severe challenging of the prevailing long term uptrend – and should symptoms persist – potentially a nullification of the prevailing long term uptrend or a changing of it.
Russell 2000 Index (RUT)
%20chart%2025%20February%202025.png)
Past the brink...😱 (click here for full size image)

We haven't done this one for a while, and to jog your memory, it is a broad-based (i.e., 2,000 constituents) US index of smaller capitalisation stocks. When I say smaller, the top 100 or so would easily figure in our ASX 200 – so not that small!
The great thing about the RUT is that it really does represent the heart of corporate America. Also, because the stock market usually leads the economy, if the RUT sneezes, it usually means the US economy is about to catch a cold.
Finally, in terms of the influence of the biggest stocks in the RUT, the top 10-20 stocks have a much smaller influence on the index's performance compared to other market capitalisation-weighted alternatives like the Comp and the S&P 500. This item means when it moves, it's usually moving due to a broader-based undertow than the Comp or the S&P 500 and not due to just a few large-caps.
In summary, we'd ideally don't want to see the RUT doing what it's doing right now...kinda rolling over.
While the Comp is still above its dark green caterpillar, and the XJO below similarly so, on Monday morning our time the RUT closed below its dark green caterpillar for the first time since the current bull market began.
Oops. 😱
There are some potential static points of historical demand at work in the system, but it looks like only 2158 remains after last night's demise of 2170. Below the long term trend ribbon (officially amber/neutral as of last night's candle) and below 2158, the next obvious point of demand isn't until 2058.
If a 10% decline from a market high is a correction, then the RUT is now firmly in correction territory (2467-247 = 2220). A 20% correction is considered a bear market (ooooh the "Bear" word!), and FYI this kicks in at 1,973.
S&P/ASX 200 (XJO)
%20chart%2026%20February%202025.png)
Given the above, what's our brink setting? 🤔 (click here for full size image)
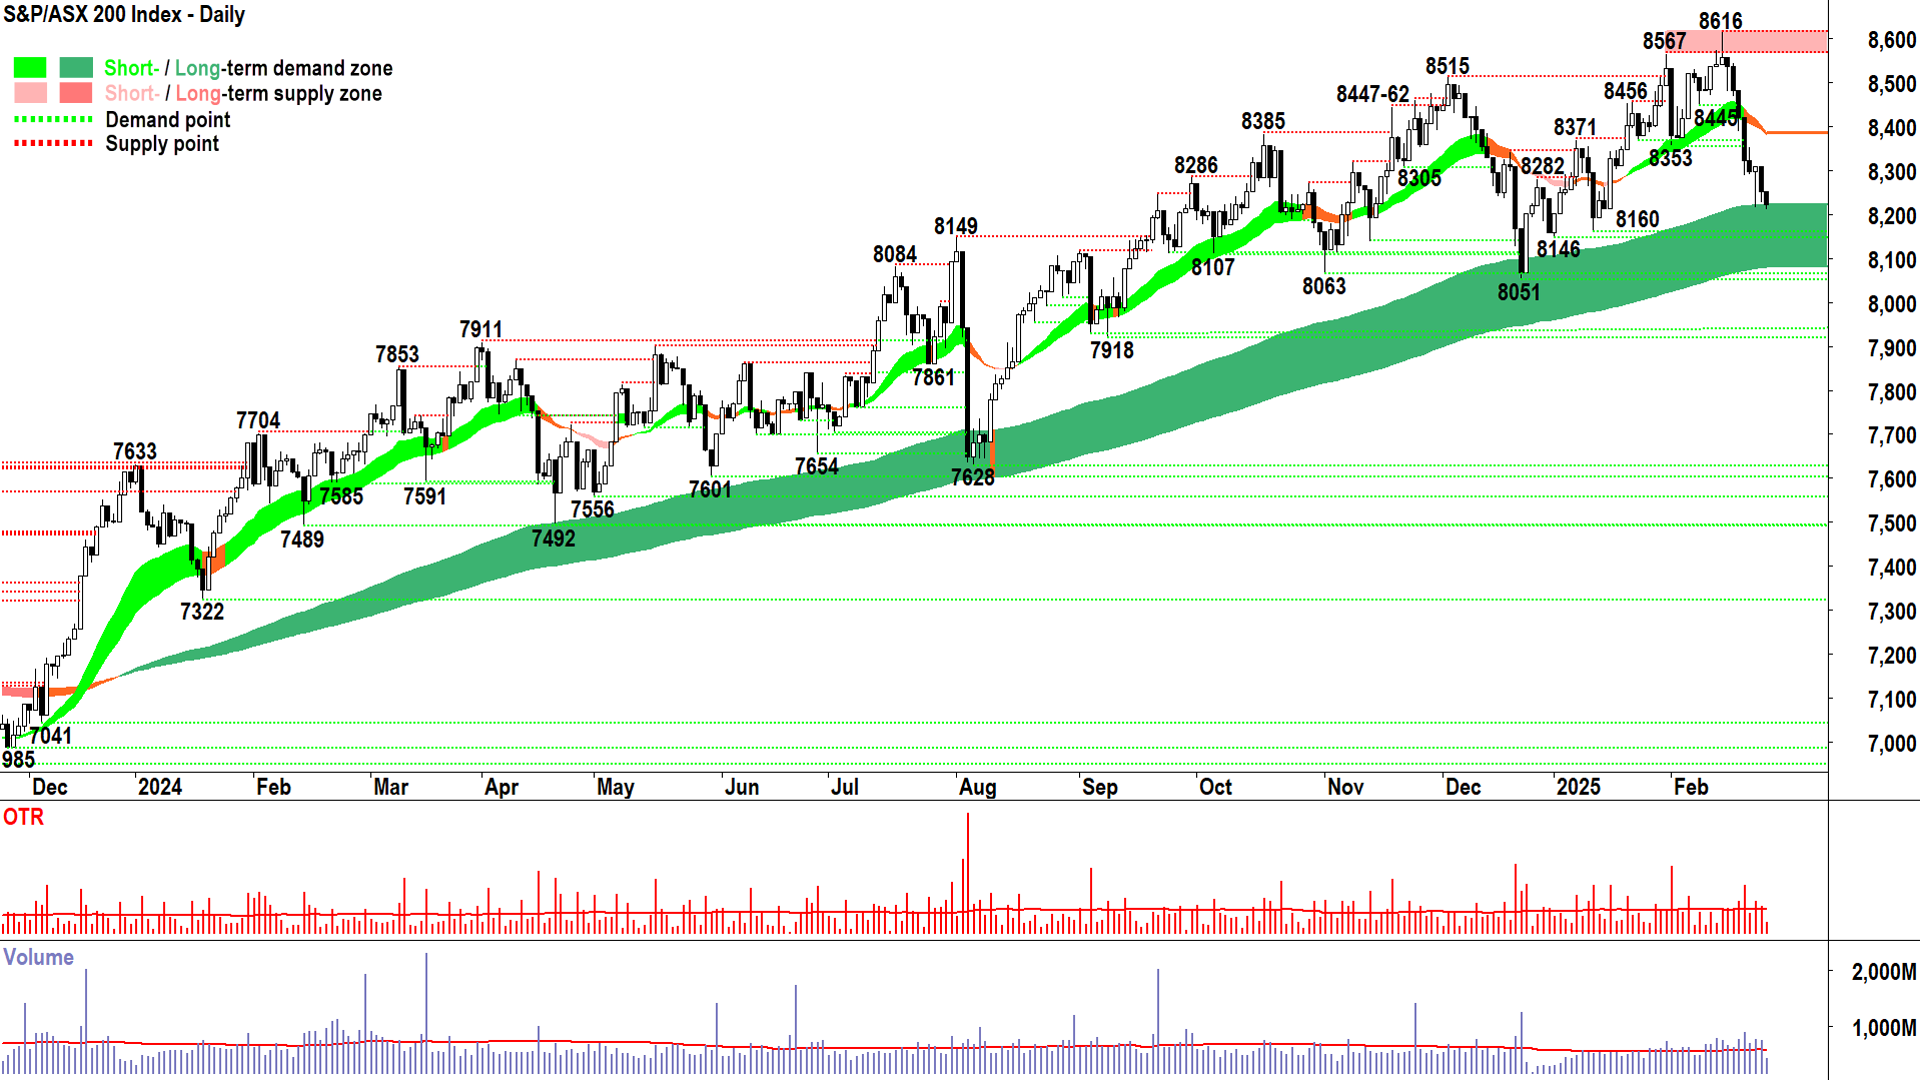
Given all of the above, where does that leave us?
I can tell you:
Doing the work. Analysing the candles and the price action. With objective calm and discipline to follow the cues the demand-supply environment is giving us.
It's where we should always be.
There's every reason to be alert to the possibility of trend change in the above chart of the XJO. The price is below the short term trend ribbon which has neutralised and turned lower. The price action is falling troughs but ironically still rising peaks – the last rising peak being the all time high no less! (No doubt the irony is lost on us both!). Candles are predominantly supply-side in nature (i.e., black bodies and or upward pointing shadows).
In summary: We observe convincing signals in the price action and candles of short term supply-side control.
The long term stuff all still looks intact – so baby and bathwater kind of stuff. For now.
I won't repeat myself about what I said we need to see right now at the long term uptrend ribbon in order to demonstrate the demand-side still wants to put up a fight – that it still wants to be in stocks and not in the alternative relative safety of cash or bonds.
Because when market thinking decisively turns to such things...well, that really is bear market kind of stuff.
A super interesting end to the week (and probably next week) coming up, so I suggest you stay on your toes! ⚠️
Economy
Today
AUS Consumer Price Index (CPI) January y/y
+2.5% p.a. actual vs +2.6% p.a. forecast and steady with +2.5% p.a. in December
Steady, smack-bang in the middle of the RBA's 2-3% target range sounds good, right? 🤔 Not so much! The RBA's preferred measure of AUS inflation, the trimmed mean, rose to +2.8% p.a. in January from +2.7% p.a. in December. But, as you can see from the chart below, the overall trend in both measures remains lower, albeit with a bit of a flattening out at the end there...🧐
It's the flattening out (and blip up in the trimmed mean) that's more than likely going to be viewed by the RBA as proof that underlying inflation remains naggingly high. Quite possibly, today's data may temper the Board's desire for further rate cuts any time soon.
.png)
All groups monthly CPI indicator, Australia, annual movement (%) Source: ABS
Later this week
Thursday
02:00 USA New Home Sales January (679,000 forecast vs 698,000 in December)
Friday
00:30 USA Preliminary GDP December quarter y/y (+2.3% p.a. forecast vs +2.3% p.a. in September quarter)
00:30 USA Core Durable Goods Orders January m/m (+0.4% m/m vs +0.3% m/m in December)
Saturday
00:30 USA Core Personal Consumption Expenditures (PCE) Price Index January m/m (+0.3% m/m vs +0.2% m/m in December)
Note: This is the Federal Reserve's preferred measure of US inflation!
12:30 CHN Manufacturing & Services Purchasing Managers Index February (PMI)
Manufacturing: 50.0 vs 49.1 in January
Services: 50.3 vs 50.2 in January
Latest News
Interesting Movers
Trading higher
+32.5% Pointsbet (PBH) - BlueBet Offer to Acquire PointsBet and H1FY25 Investor Presentation.
+16.7% Arafura Rare Earths (ARU) - No news, big move on no official announcement…possibly something to do with LYC's results today and some commentary made in an associated AFR article about China's increasing stranglehold on the rare earths market and that smaller players may be "absorbed".
+14.6% EML Payments (EML) - 1HFY25 Investor Presentation, rise is consistent with prevailing short term uptrend and long term trend is transitioning from down to up 🔎📈
+14.6% Dusk Group (DSK) - DSK 1H FY25 Investor Presentation.
+13.4% Bapcor (BAP) - 1H25 Results Presentation.
+10.3% Worley (WOR) - Presentation - Half year results 2025.
+8.3% Johns Lyng Group (JLG) - No news since 25-Feb 1H25 Results Presentation, plenty of broker downgrades and target price cuts for this one today (see Broker Moves section below for more details), likely rebounded after yesterday's sharp sell-off due to results.
+7.9% Firefly Metals (FFM) - No news since 25-Feb FireFly BMO Conference Presentation, initieated at Outperform at Macquarie with a $1.50 target price.
+7.8% Light & Wonder (LNW) - LNW Announces Fourth Quarter and Full year 2024 Results, rise is consistent with prevailing short and long term uptrends, a recent regular in ChartWatch ASX Scans Uptrends list 🔎📈
+7.4% Smartgroup Corporation (SIQ) - 2024 Full Year Investor Presentation.
+6.5% G8 Education (GEM) - FY24 Investor Presentation.
+6.0% Ridley Corporation (RIC) - No news, upgraded to buy from hold at PAC Partners.
+5.9% Healius (HLS) - Change in substantial holding from PPT.
+5.9% Tabcorp (TAH) - No news, rise is consistent with prevailing short term uptrend and long term trend is transitioning from down to up, a recent regular in ChartWatch ASX Scans Uptrends list 🔎📈
+5.6% Tyro Payments (TYR) - Tyro Payments H1 FY25 Investor Presentation.
Trading lower
-33.3% Appen (APX) - FY24 Results and FY25 Outlook.
-30.8% Arovella Therapeutics (ALA) - Arovella $15m Placement to fund Phase 1.
-20.0% Platinum Asset Management (PTM) - PTM - Investment leadership changes and turnaround progress, repelled perfectly from long term downtrend ribbon! 🔎📉
-19.0% Helloworld Travel (HLO) - HLO Half Year 2025 Investor Presentation, repelled perfectly from long term downtrend ribbon! 🔎📉
-15.9% Brainchip (BRN) - Ceasing to be a substantial holder - Mankar.
-15.2% Kelsian Group (KLS) - 1HFY25 Results Investor Presentation, fall is consistent with prevailing short and long term downtrends, one of the most Featured (highest conviction) stocks in ChartWatch ASX Scans Downtrends list 🔎📉
-12.2% Integral Diagnostics (IDX) - FY25 Half Year Results Investor Presentation.
-11.8% Siteminder (SDR) - H1FY25 Investor Presentation.
-11.6% Australian Clinical Labs (ACL) - 1H25 financial results investor presentation.
-10.6% Readytech (RDY) - Half Year Results - Investor Presentation.
-10.2% Flight Centre Travel Group (FLT) - FY25 Half Year Investor Pres. (inc guidance commentary), repelled perfectly from long term downtrend ribbon! 🔎📉
-7.7% Novonix (NVX) - No news since 20-Feb Response to ASX Aware Letter, fall is consistent with prevailing short and long term downtrends, one of the most Featured (highest conviction) stocks in ChartWatch ASX Scans Downtrends list 🔎📉
Broker Moves
Life360 (360)
Retained at overweight at Morgan Stanley; Price Target: $25.00
Australian Clinical Labs (ACL)
Retained at outperform at RBC Capital Markets; Price Target: $4.25
Audinate Group (AD8)
Retained at overweight at Morgan Stanley; Price Target: $11.00
Adairs (ADH)
Retained at buy at Bell Potter; Price Target: $2.65 from $2.85
Amplitude Energy (AEL)
Upgraded to buy from hold at Bell Potter; Price Target: $0.260 from $0.220
Ainsworth Game Technology (AGI)
Retained at neutral at Macquarie; Price Target: $0.900 from $0.850
AGL Energy (AGL)
Retained at overweight at Morgan Stanley; Price Target: $12.66
Australian Dairy Nutritionals (AHF)
Retained at buy at Bell Potter; Price Target: $1.050 from $1.120
Ampol (ALD)
Upgraded to outperform from neutral at Macquarie; Price Target: $29.45 from $30.65
ANZ Group (ANZ)
Retained at equal-weight at Morgan Stanley; Price Target: $27.20
APA Group (APA)
Retained at hold at Morgans; Price Target: $7.21 from $7.13
Retained at buy at Ord Minnett; Price Target: $8.60
AUB Group (AUB)
Retained at buy at Goldman Sachs; Price Target: $37.00
Retained at overweight at JP Morgan; Price Target: $35.00
Retained at outperform at Macquarie; Price Target: $35.45 from $34.20
Retained at overweight at Morgan Stanley; Price Target: $38.00 from $37.05
Retained at buy at Ord Minnett; Price Target: $35.58 from $36.94
Avjennings (AVJ)
Retained at hold at Bell Potter; Price Target: $0.700
Bapcor (BAP)
Retained at sector perform at RBC Capital Markets; Price Target: $5.00
Bega Cheese (BGA)
Upgraded to buy from hold at PAC Partners; Price Target: $6.45
BHP Group (BHP)
Retained at overweight at Morgan Stanley; Price Target: $48.50
Car Group (CAR)
Retained at overweight at Morgan Stanley; Price Target: $42.50
Commonwealth Bank of Australia (CBA)
Retained at underweight at Morgan Stanley; Price Target: $127.00
Centuria Industrial Reit (CIP)
Retained at buy at Bell Potter; Price Target: $3.35 from $3.25
Retained at outperform at Macquarie; Price Target: $3.34 from $3.32
Retained at equal-weight at Morgan Stanley; Price Target: $3.31
Retained at buy at UBS; Price Target: $3.82 from $3.80
Coronado Global Resources (CRN)
Retained at outperform at Macquarie; Price Target: $0.800 from $1.000
Corporate Travel Management (CTD)
Retained at overweight at Morgan Stanley; Price Target: $18.30
Cettire (CTT)
Retained at underperform at RBC Capital Markets; Price Target: $0.900
Count (CUP)
Retained at positive at E&P; Price Target: $1.400
Cyclopharm (CYC)
Retained at buy at Bell Potter; Price Target: $2.70
Dalrymple Bay Infrastructure/Notes (DBI)
Retained at buy at Citi; Price Target: $4.15 from $3.40
Retained at add at Morgans; Price Target: $4.13 from $3.50
Domain Australia (DHG)
Downgraded to hold from buy at Ord Minnett; Price Target: $4.20 from $3.25
Domino's Pizza Enterprises (DMP)
Retained at neutral at Citi; Price Target: $31.82 from $37.34
Retained at buy at Goldman Sachs; Price Target: $37.30 from $38.30
Retained at buy at Jarden; Price Target: $42.00
Retained at overweight at Jefferies; Price Target: $39.00 from $41.00
Retained at neutral at Macquarie; Price Target: $30.50 from $35.10
Retained at hold at Morgans; Price Target: $29.40 from $32.70
Retained at neutral at UBS; Price Target: $31.00 from $36.00
Droneshield (DRO)
Retained at buy at Bell Potter; Price Target: $1.100
Retained at buy at Shaw and Partners; Price Target: $0.900
Enero Group (EGG)
Retained at positive at E&P; Price Target: $2.28
EML Payments (EML)
Retained at outperform at RBC Capital Markets; Price Target: $1.200
Electro Optic Systems (EOS)
Retained at buy at Bell Potter; Price Target: $2.15 from $2.20
Retained at buy at Ord Minnett; Price Target: $1.800 from $1.900
Fenix Resources (FEX)
Retained at buy at Bell Potter; Price Target: $0.410
Firefly Metals (FFM)
Initiated at outperform at Macquarie; Price Target: $1.500
Flight Centre Travel Group (FLT)
Retained at sector perform at RBC Capital Markets; Price Target: $19.00
Generation Development Group (GDG)
Retained at overweight at Morgan Stanley; Price Target: $4.90
G8 Education (GEM)
Retained at overweight at Macquarie; Price Target: $1.600 from $1.380
Retained at neutral at UBS; Price Target: $1.300 from $1.350
Goodman Group (GMG)
Retained at overweight at Morgan Stanley; Price Target: $40.82
GPT Group (GPT)
Retained at overweight at Morgan Stanley; Price Target: $5.67
GTN (GTN)
Downgraded to hold from buy at Canaccord Genuity; Price Target: $0.550 from $0.750
Helia Group (HLI)
Retained at neutral at Macquarie; Price Target: $4.20 from $3.80
Hansen Technologies (HSN)
Retained at overweight at Morgan Stanley; Price Target: $6.50
Integral Diagnostics (IDX)
Retained at outperform at RBC Capital Markets; Price Target: $3.50
IGO (IGO)
Retained at underweight at Morgan Stanley; Price Target: $3.85 from $4.50
Ingenia Communities Group (INA)
Retained at buy at Citi; Price Target: $6.50 from $6.30
Downgraded to overweight from buy at Jarden; Price Target: $6.40 from $5.70
Retained at buy at Ord Minnett; Price Target: $6.11 from $5.90
Retained at neutral at UBS; Price Target: $6.30 from $6.15
Iress (IRE)
Upgraded to buy from hold at Shaw and Partners; Price Target: $9.10 from $9.60
James Hardie Industries (JHX)
Retained at equal-weight at Morgan Stanley; Price Target: $55.00
Johns Lyng Group (JLG)
Retained at hold at Bell Potter; Price Target: $2.50 from $4.10
Retained at neutral at Citi; Price Target: $2.70 from $3.95
Downgraded to hold from outperform at CLSA; Price Target: $2.40 from $4.10
Downgraded to neutral from outperform at Macquarie; Price Target: $2.60 from $4.90
Retained at overweight at Morgan Stanley; Price Target: $4.60
Downgraded to hold from add at Morgans; Price Target: $2.70 from $5.10
Kogan.Com (KGN)
Downgraded to hold from accumulate at Ord Minnett; Price Target: $5.00 from $5.55
Kelsian Group (KLS)
Retained at sector perform at RBC Capital Markets; Price Target: $4.50
Lifestyle Communities (LIC)
Retained at hold at Bell Potter; Price Target: $8.55 from $8.90
Retained at neutral at Citi; Price Target: $9.70 from $10.00
Retained at accumulate at Ord Minnett; Price Target: $9.83 from $11.02
Retained at buy at UBS; Price Target: $10.20 from $11.31
Light & Wonder (LNW)
Retained at buy at Citi; Price Target: $200.00
Retained at buy at Jarden; Price Target: $196.00
Lovisa (LOV)
Retained at hold at Ord Minnett; Price Target: $29.00 from $29.20
Metals Acquisition (MAC)
Retained at buy at Canaccord Genuity; Price Target: $21.00
Mader Group (MAD)
Retained at hold at Bell Potter; Price Target: $6.50 from $6.80
Macquarie Group (MQG)
Retained at overweight at Morgan Stanley; Price Target: $253.00
National Australia Bank (NAB)
Retained at overweight at Morgan Stanley; Price Target: $37.40
Nine Entertainment (NEC)
Retained at neutral at E&P; Price Target: $1.750 from $1.300
Retained at overweight at JP Morgan; Price Target: $1.800 from $1.750
Retained at overweight at Morgan Stanley; Price Target: $2.00
Downgraded to accumulate from buy at Ord Minnett; Price Target: $1.800 from $1.600
Retained at neutral at UBS; Price Target: $1.650 from $1.580
NIB (NHF)
Downgraded to hold from add at Morgans; Price Target: $7.06 from $6.10
Noumi (NOU)
Retained at buy at Bell Potter; Price Target: $0.250 from $0.295
Ora Banda Mining (OBM)
Retained at buy at Canaccord Genuity; Price Target: $1.050
OOH!Media (OML)
Retained at neutral at UBS; Price Target: $1.650 from $1.250
Orica (ORI)
Retained at overweight at Morgan Stanley; Price Target: $22.50
Pacific Current Group (PAC)
Downgraded to hold from buy at Ord Minnett; Price Target: $13.00
Paladin Energy (PDN)
Retained at overweight at Morgan Stanley; Price Target: $10.35
Propel Funeral Partners (PFP)
Retained at overweight at Morgan Stanley; Price Target: $6.30
Premier Investments (PMV)
Retained at overweight at Morgan Stanley; Price Target: $32.00
Polynovo (PNV)
Retained at outperform at Macquarie; Price Target: $2.80 from $2.85
Praemium (PPS)
Retained at accumulate at Ord Minnett; Price Target: $0.900
Platinum Asset Management (PTM)
Retained at sell at UBS; Price Target: $0.570 from $0.620
Qualitas (QAL)
Retained at outperform at Macquarie; Price Target: $3.10 from $2.93
Qoria (QOR)
Retained at buy at Ord Minnett; Price Target: $0.580 from $0.560
Retained at buy at Shaw and Partners; Price Target: $0.520
Ramsay Health Care (RHC)
Retained at neutral at UBS; Price Target: $45.10
Ridley Corporation (RIC)
Upgraded to buy from hold at PAC Partners; Price Target: $3.20
Rio Tinto (RIO)
Retained at overweight at Morgan Stanley; Price Target: $130.50
Regal Partners (RPL)
Retained at positive at E&P; Price Target: $5.50
South32 (S32)
Retained at overweight at Morgan Stanley; Price Target: $3.85
Scentre Group (SCG)
Retained at buy at Citi; Price Target: $3.91
Retained at overweight at Morgan Stanley; Price Target: $4.44
Steadfast Group (SDF)
Retained at outperform at CLSA; Price Target: $6.60
Retained at buy at Goldman Sachs; Price Target: $6.50
Retained at overweight at JP Morgan; Price Target: $6.80 from $6.60
Retained at overweight at Morgan Stanley; Price Target: $6.98
Retained at buy at UBS; Price Target: $6.65 from $6.85
Siteminder (SDR)
Retained at positive at E&P; Price Target: $7.33
Retained at outperform at RBC Capital Markets; Price Target: $7.00
Sims (SGM)
Retained at neutral at Citi; Price Target: $15.50 from $13.50
Retained at neutral at Jarden; Price Target: $14.80 from $12.70
Retained at underperform at Jefferies; Price Target: $11.70 from $11.40
Retained at outperform at Macquarie; Price Target: $15.70 from $15.40
Retained at underweight at Morgan Stanley; Price Target: $11.50
Retained at neutral at UBS; Price Target: $14.50 from $13.60
Stockland (SGP)
Retained at overweight at Morgan Stanley; Price Target: $6.50
Shaver Shop Group (SSG)
Retained at hold at Ord Minnett; Price Target: $1.300
Strickland Metals (STK)
Retained at buy at Canaccord Genuity; Price Target: $0.180 from $0.170
Santos (STO)
Retained at overweight at Morgan Stanley; Price Target: $7.46
Suncorp Group (SUN)
Retained at overweight at Morgan Stanley; Price Target: $23.00
Solvar (SVR)
Retained at buy at Bell Potter; Price Target: $1.600 from $1.480
Retained at add at Morgans; Price Target: $1.550 from $1.450
Transurban Group (TCL)
Retained at equal-weight at Morgan Stanley; Price Target: $13.46
Tasmea (TEA)
Retained at add at Morgans; Price Target: $3.65 from $3.60
Retained at hold at Shaw and Partners; Price Target: $2.85 from $2.50
Tourism Rentals (THL)
Retained at hold at Shaw and Partners; Price Target: $2.85 from $2.50
Retained at add at Morgans; Price Target: $1.730 from $2.02
Retained at buy at Ord Minnett; Price Target: NZ$3.07 from NZ$2.90
The Lottery Corporation (TLC)
Retained at equal-weight at Morgan Stanley; Price Target: $5.05
Telstra Group (TLS)
Retained at overweight at Morgan Stanley; Price Target: $4.70
Viva Energy Group (VEA)
Downgraded to neutral from positive at E&P; Price Target: $2.30 from $3.20
Downgraded to hold from buy at Jefferies; Price Target: $1.900 from $3.30
Retained at overweight at JP Morgan; Price Target: $2.40 from $3.40
Retained at equal-weight at Morgan Stanley; Price Target: $2.28 from $3.06
Downgraded to sector perform from outperform at RBC Capital Markets; Price Target: $2.00 from $3.55
Retained at buy at UBS; Price Target: $3.10 from $3.20
Viridis Mining and Minerals (VMM)
Retained at buy at Bell Potter; Price Target: $1.450 from $1.700
Westpac Banking Corporation (WBC)
Retained at underweight at Morgan Stanley; Price Target: $29.20
Woodside Energy Group (WDS)
Upgraded to neutral from sell at Citi; Price Target: $24.00 from $22.00
Retained at neutral at Macquarie; Price Target: $26.00
Retained at equal-weight at Morgan Stanley; Price Target: $27.00
Retained at add at Morgans; Price Target: $30.25 from $30.00
Retained at hold at Ord Minnett; Price Target: $26.00 from $25.50
Wesfarmers (WES)
Retained at underweight at Morgan Stanley; Price Target: $60.80
Westgold Resources (WGX)
Retained at buy at Canaccord Genuity; Price Target: $4.15 from $4.20
Retained at outperform at Macquarie; Price Target: $3.10 from $3.20
Retained at buy at Ord Minnett; Price Target: $3.40
Woolworths Group (WOW)
Retained at neutral at Citi; Price Target: $33.00
Wisetech Global (WTC)
Retained at outperform at Macquarie; Price Target: $152.70
Retained at sector perform at RBC Capital Markets; Price Target: $110.00
Block (XYZ)
Upgraded to equal-weight from underweight at Morgan Stanley; Price Target: $65.00
Zip Co. (ZIP)
Retained at buy at Jefferies; Price Target: $3.70
Retained at buy at Ord Minnett; Price Target: $3.60 from $3.42
Retained at outperform at RBC Capital Markets; Price Target: $3.50 from $3.40
Retained at buy at Unified Capital Partners; Price Target: $4.57 from $4.00
Scans
Top Gainers
Code | Company | Last | % Chg |
|---|---|---|---|
| WYX | Western Yilgarn NL | $0.042 | +61.54% |
| HTM | High-Tech Metals Ltd | $0.265 | +55.88% |
| HYD | HYDRIX Ltd | $0.024 | +41.18% |
| OLY | Olympio Metals Ltd | $0.055 | +37.50% |
| PBH | Pointsbet Holdings Ltd | $1.10 | +32.53% |
Top Fallers
Code | Company | Last | % Chg |
|---|---|---|---|
| APX | Appen Ltd | $1.92 | -33.33% |
| ALA | Arovella Therapeutics Ltd | $0.135 | -30.77% |
| R8R | REGENER8 Resources NL | $0.095 | -24.00% |
| WZR | Wisr Ltd | $0.03 | -23.08% |
| BXN | Bioxyne Ltd | $0.027 | -22.86% |
52 Week Highs
Code | Company | Last | % Chg |
|---|---|---|---|
| HTM | High-Tech Metals Ltd | $0.265 | +55.88% |
| PBH | Pointsbet Holdings Ltd | $1.10 | +32.53% |
| ZMI | ZINC of Ireland NL | $0.014 | +27.27% |
| AAL | Alfabs Australia Ltd | $0.495 | +14.45% |
| KME | Kip Mcgrath Education Centres Ltd | $0.49 | +11.36% |
52 Week Lows
Code | Company | Last | % Chg |
|---|---|---|---|
| PTM | Platinum Asset Management Ltd | $0.60 | -20.00% |
| HLO | Helloworld Travel Ltd | $1.66 | -19.02% |
| MCP | Mcpherson's Ltd | $0.255 | -16.39% |
| KM1 | Kali Metals Ltd | $0.093 | -15.46% |
| KLS | Kelsian Group Ltd | $3.07 | -15.19% |
Near Highs
Code | Company | Last | % Chg |
|---|---|---|---|
| WVOL | Ishares MSCI World Ex Aust Minimum Volatility ETF | $44.01 | +0.76% |
| IAGPF | Insurance Australia Group Ltd | $104.20 | 0.00% |
| GCI | Gryphon Capital Income Trust | $2.04 | +0.49% |
| IHD | Ishares S&P/ASX DIV Opportunities Esg Screened ETF | $14.35 | -0.49% |
| BILL | Ishares Core Cash ETF | $100.66 | +0.01% |
Relative Strength Index (RSI) Oversold
Code | Company | Last | % Chg |
|---|---|---|---|
| XYZ | Block, Inc | $101.08 | -3.13% |
| NVX | Novonix Ltd | $0.48 | -7.69% |
| GMG | Goodman Group | $32.15 | -1.56% |
| IRE | Iress Ltd | $7.66 | -0.13% |
| ALD | Ampol Ltd | $26.09 | -0.15% |
