News | Market Wraps
Evening Wrap: ASX 200 closes at new record high as investors snap up gold and technology stocks, but how much higher can it go?
The S&P/ASX 200 closed 38.6 points higher, up 0.45%.

Mentioned
The S&P/ASX 200 closed 38.6 points higher, up 0.45%.
A new record high close for the ASX 200!
And so soon after December's sea of doubt (and accompanying sea of red ink!).
For the week, the ASX 200 finished up 123.4 points or 1.47% higher. For the month, the ASX 200 finished up 373.2 points or 4.57% higher.
Things have never been better for Aussie stocks and Aussie investors. But can the good times last? We'll investigate in tonight's Evening Wrap, so...
Click/scroll through for the usual reporting of the major sector and stock-specific moves, the broker responses to them, as well as all the key upcoming economic data in tonight's Evening Wrap.
Also, I have detailed technical analysis on Gold and Copper in today's ChartWatch.
Let's dive in!
Today in Review
Fri 31 Jan 25, 5:34pm (AEST)
Name | Value | % Chg |
|---|---|---|
Major Indices | ||
| ASX 200 | 8,532.3 | +0.45% |
| All Ords | 8,789.7 | +0.50% |
| Small Ords | 3,234.0 | +1.13% |
| All Tech | 3,983.9 | +1.05% |
| Emerging Companies | 2,328.6 | +1.16% |
Currency | ||
| AUD/USD | 0.6226 | +0.26% |
US Futures | ||
| S&P 500 | 6,116.75 | +0.29% |
| Dow Jones | 45,138.0 | +0.18% |
| Nasdaq | 21,752.75 | +0.59% |
Name | Value | % Chg |
|---|---|---|
Sector | ||
| Information Technology | 2,854.8 | +1.15% |
| Materials | 16,773.2 | +1.09% |
| Real Estate | 3,937.1 | +1.08% |
| Consumer Discretionary | 4,190.0 | +0.64% |
| Industrials | 7,905.0 | +0.41% |
| Energy | 8,881.1 | +0.30% |
| Financials | 9,141.5 | +0.29% |
| Health Care | 46,321.9 | +0.24% |
| Consumer Staples | 11,850.0 | +0.05% |
| Communication Services | 1,666.9 | -0.42% |
| Utilities | 8,816.2 | -4.15% |
Markets

ASX 200 Session Chart
The S&P/ASX 200 (XJO) finished 38.6 points higher at 8,532.3, nearly smack-bang at the mid-point of the session, 0.45% from its low and 0.41% from its high. Despite the indecision shown by that mid-point close on the benchmark, in the broader-based S&P/ASX 300 (XKO), advancers beat decliners by a resounding 203 to 79.
For the week, the XJO finished up 123.4 points or 1.47% higher, 1.74% from its intraweek low and just 0.41% from its intraweek high. For the month, the XJO finished up 373.2 points or 4.57% higher, 4.73% from its intramonth low and just 0.41% from its intramonth high.
On the topic of monthly performance, at least one major media outlet incorrectly stated that January was the best month for Aussie stocks since July. This is not the case because Aussie stocks pay dividends. Add those back, and January was the best month for Aussie stocks since November – so not that long at all!
But, we should not downplay how good a month January was – particularly considering how bad December was – and particularly considering that December's aren't supposed to be bad. My tip is that we dodged a major bullet this month, I had feared after December's rout that this month could have been much, much worse.
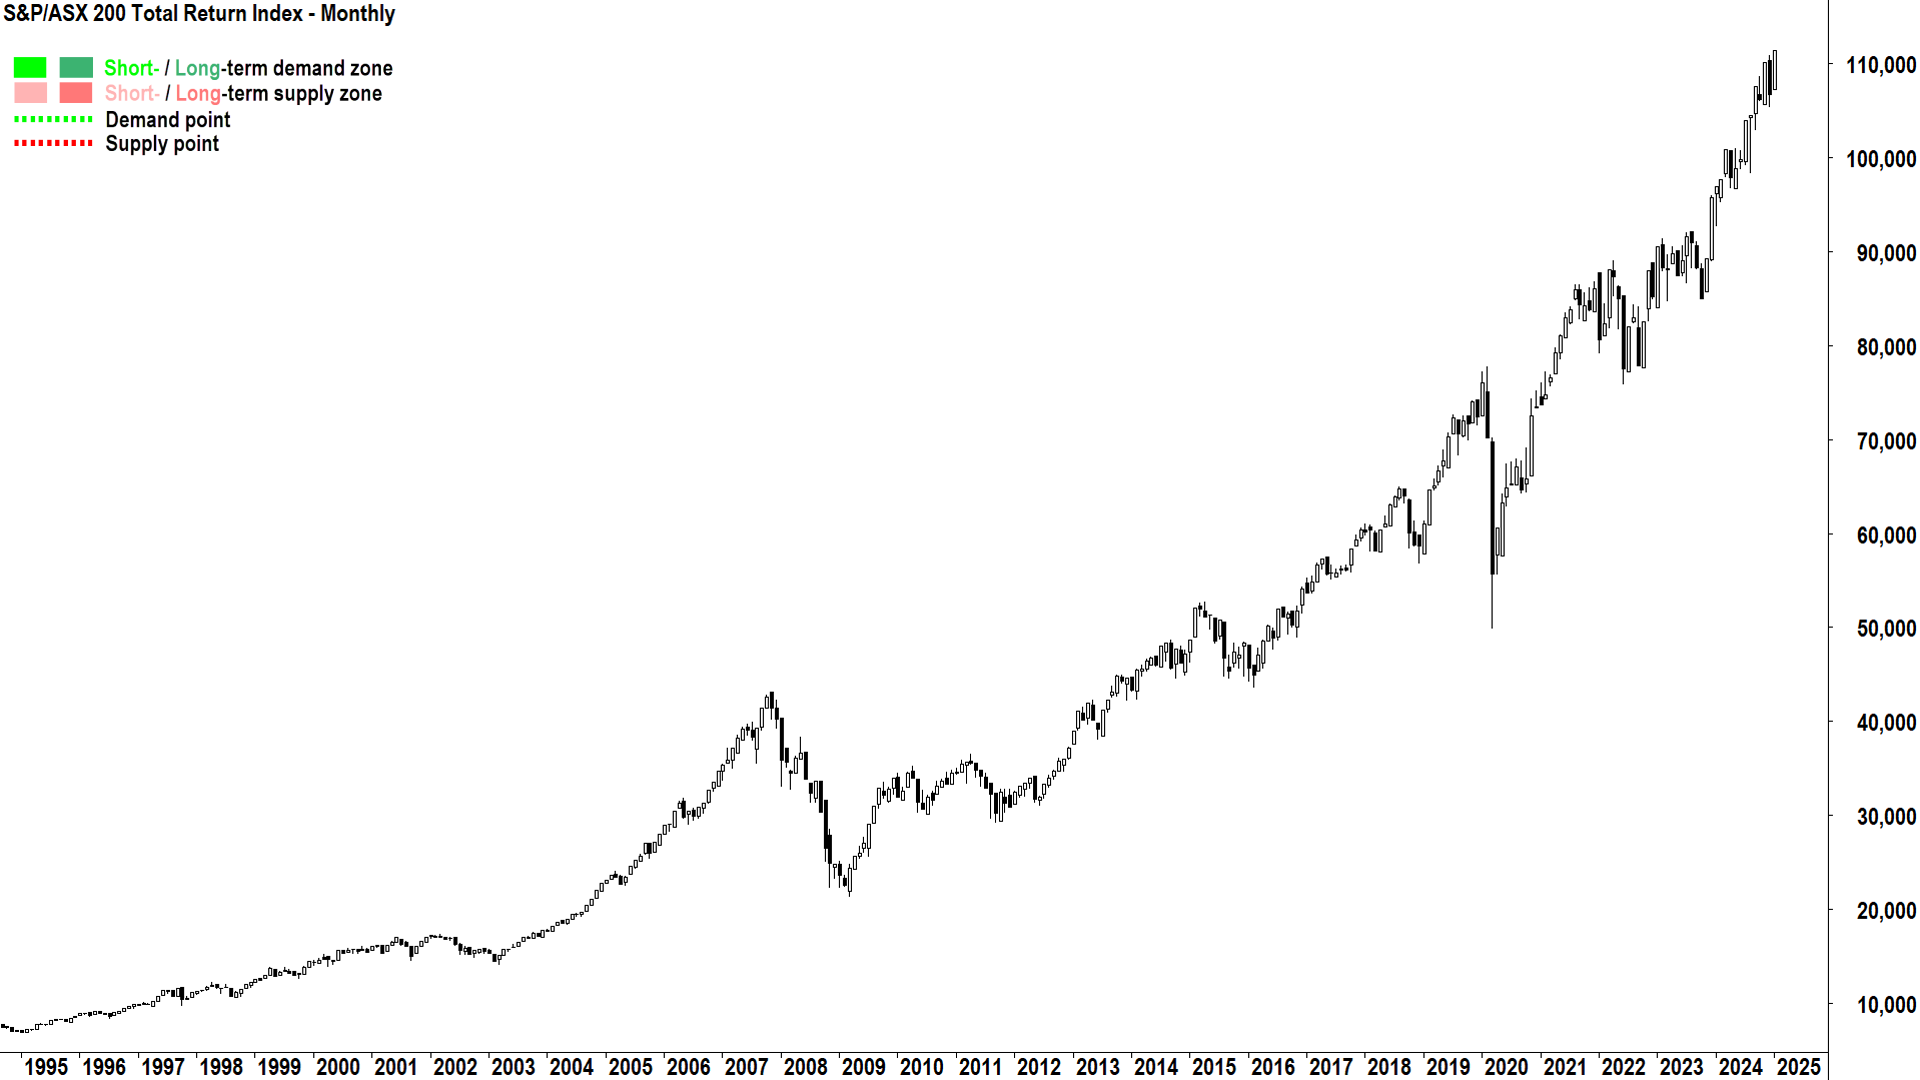
%20monthly%20chart%2031%20Jan%202024.png)
S&P/ASX 200 Total Return Index (XJOA) (click here for full size image)
I love looking at monthly charts like the one above for the S&P/ASX 200 Total Return Index (XJOA). The XJOA adds back dividends and is the index the aforementioned media outlook should have looked at before they wrote their evening wrap.
As a trend follower, I see nothing but a wall of demand in the above chart. This means I want nothing but to be fully invested. But that's just me.
I don't know what you see, because like any great work of art, the beauty in a chart lies in the eye of the beholder...
What do you see? 🤔
Because I know some will look at a chart like the one above and say: "That's gone up too much...it's too high...it has to crash...surely it can't go any higher!?".
Maybe.
Looking at why the Aussie market notched a new record close today (with or without dividends!), Gold (XGD) (+2.7%) was the best performing sector index – no surprises given the gold price also tipped a new record high overnight. I have full technical analysis for you in ChartWatch below.
The rest were a bit of a mixed bunch. A bounce in base metals prices helped the Materials (XMJ) (+1.1%) to a welcome gain, while interest rate sensitives like Information Technology (XIJ) (+1.2%), Real Estate Investment Trusts (XPJ) (+1.1%), and Consumer Discretionary (XDJ) (+0.64%) continued to revel in lower local risk-free yields flowing from the better than expected CPI data earlier in the week.
Company | Last Price | Change $ | Change % | 1mo % | 1yr % |
|---|---|---|---|---|---|
Appen (APX) | $2.75 | +$0.25 | +10.0% | +4.2% | +733.3% |
Pantoro (PNR) | $0.115 | +$0.01 | +9.5% | +27.8% | +180.5% |
Santana Minerals (SMI) | $0.520 | +$0.045 | +9.5% | +7.2% | +20.5% |
Healthco Healthcare and Wellness Reit (HCW) | $1.005 | +$0.08 | +8.6% | -1.5% | -24.4% |
Imdex (IMD) | $2.63 | +$0.19 | +7.8% | +13.4% | +55.6% |
Fenix Resources (FEX) | $0.305 | +$0.02 | +7.0% | +15.1% | +14.0% |
Jupiter Mines (JMS) | $0.155 | +$0.01 | +6.9% | +6.9% | -13.9% |
St Barbara (SBM) | $0.255 | +$0.015 | +6.3% | +13.3% | +45.7% |
Selfwealth (SWF) | $0.265 | +$0.015 | +6.0% | +10.4% | +71.0% |
Predictive Discovery (PDI) | $0.265 | +$0.015 | +6.0% | +15.2% | +32.5% |
Chalice Mining (CHN) | $1.135 | +$0.06 | +5.6% | +2.7% | +8.1% |
Cettire (CTT) | $1.450 | +$0.075 | +5.5% | -4.0% | -54.0% |
Deep Yellow (DYL) | $1.355 | +$0.07 | +5.4% | +20.4% | -2.9% |
Boss Energy (BOE) | $3.31 | +$0.17 | +5.4% | +36.2% | -39.5% |
Catalyst Metals (CYL) | $3.51 | +$0.17 | +5.1% | +36.0% | +440.0% |
Ora Banda Mining (OBM) | $0.830 | +$0.04 | +5.1% | +27.7% | +260.9% |
Nuix (NXL) | $4.49 | +$0.21 | +4.9% | -29.0% | +188.7% |
Iperionx (IPX) | $4.23 | +$0.19 | +4.7% | -23.1% | +151.8% |
Emerald Resources (EMR) | $4.33 | +$0.19 | +4.6% | +33.2% | +30.0% |
Premier Investments (PMV) | $23.88 | +$1.04 | +4.6% | -2.0% | +12.7% |
Perenti (PRN) | $1.400 | +$0.06 | +4.5% | +0.4% | +63.7% |
Paladin Energy (PDN) | $8.92 | +$0.38 | +4.5% | +18.0% | -27.5% |
WA1 Resources (WA1) | $13.57 | +$0.57 | +4.4% | +2.4% | +28.4% |
Sandfire Resources (SFR) | $10.01 | +$0.37 | +3.8% | +7.9% | +40.6% |
Newmont Corporation (NEM) | $69.20 | +$2.55 | +3.8% | +16.2% | +31.6% |
Today's best performing ASX stocks
Utilities (XUJ) (-4.2%) was the only major casualty today, and a significant outlier to the downside at that. It's a small sector in terms of numbers of constituents, and it's dominated by the two largest in AGL Energy (ASX: AGL) (-1.9%) and Origin Energy (ASX: ORG) (-6.7%).
Clearly, the damage was done in ORG, which released its December quarter production results today. Australia-Pacific LNG (APLNG) production was down on the prior quarter on lower field performance and maintenance, and sales also fell. The real sticking point for investors, however, was the downgrade of full year APLNG production guidance by 2-5% due to these and ongoing operational issues.
Company | Last Price | Change $ | Change % | 1mo % | 1yr % |
|---|---|---|---|---|---|
Peninsula Energy (PEN) | $1.085 | -$0.23 | -17.5% | -13.9% | -51.6% |
Pointsbet (PBH) | $0.855 | -$0.125 | -12.8% | -14.5% | +76.3% |
Magellan Financial Group (MFG) | $10.51 | -$0.87 | -7.6% | -5.5% | +17.8% |
Origin Energy (ORG) | $10.45 | -$0.75 | -6.7% | -4.1% | +25.9% |
Metals Acquisition (MAC) | $17.21 | -$0.6 | -3.4% | 0% | 0% |
Nanosonics (NAN) | $3.45 | -$0.11 | -3.1% | +14.6% | +17.3% |
Mineral Resources (MIN) | $34.98 | -$0.95 | -2.6% | +2.1% | -42.5% |
IGO (IGO) | $4.93 | -$0.13 | -2.6% | +3.4% | -36.2% |
Credit Corp Group (CCP) | $15.57 | -$0.38 | -2.4% | -2.6% | -11.8% |
Liontown Resources (LTR) | $0.675 | -$0.015 | -2.2% | +28.6% | -34.1% |
Weebit Nano (WBT) | $2.27 | -$0.05 | -2.2% | -36.9% | -41.2% |
Abacus Group (ABG) | $1.150 | -$0.025 | -2.1% | +4.5% | +7.0% |
Strike Energy (STX) | $0.235 | -$0.005 | -2.1% | +11.9% | -46.0% |
Qoria (QOR) | $0.480 | -$0.01 | -2.0% | -2.0% | +100.0% |
Nickel Industries (NIC) | $0.765 | -$0.015 | -1.9% | -7.3% | +5.5% |
Dalrymple Bay Infrastructure/Notes (DBI) | $3.62 | -$0.07 | -1.9% | +0.6% | +30.2% |
Polynovo (PNV) | $2.09 | -$0.04 | -1.9% | +2.5% | +9.7% |
AGL Energy (AGL) | $11.52 | -$0.22 | -1.9% | +2.0% | +32.1% |
Sigma Healthcare (SIG) | $2.87 | -$0.05 | -1.7% | +8.7% | +199.0% |
Clarity Pharmaceuticals (CU6) | $3.68 | -$0.06 | -1.6% | -11.8% | +64.8% |
Today's worst performing ASX stocks
ChartWatch
Gold Futures (Front month, back-adjusted) COMEX
%20COMEX%20chart%2031%20Jan%202024.png)
Have you ever heard the saying: The trend is your friend...? (click here for full size image)
The last time we covered gold was in ChartWatch in the Evening Wrap on 22 January.
In that update, we were tracking a “resilient” gold price, leading me to counsel: Follow the trend! 📈
The trend then, and now, is up. It’s up in the short term as evidenced by the light green short term ribbon, and it’s also up in the long term, as evidenced by the dark green long term trend ribbon.
That’s the trend direction.
Trend strength and reliability can be ascertained by looking at whether the ribbons are expanding or contracting (expanding equates to building momentum), and whether the price action is showing larger extensions on the rising trough-to-peak segments compared to the shallow pullbacks of the rising peak-to-trough segments.
Further, if that price action is punctuated by a predominance of demand-side candles (i.e., white bodies and or downward pointing shadows), then you really are witnessing a wall of demand-side control.
So what!? 🤷
Charts, trends, price action, candles.
They’re all history. They’re telling you who was in control yesterday and before that.
It’s a leap of faith to extrapolate out our analysis to future demand-side control, and therefore rising prices, and therefore a suitable course of action for an investor to take.
I don’t know the future. I don’t know what candle is going to print next. Really, I don’t – I promise!
I just know from personal experience, that it’s better to follow the trend than to ignore it or fight it.
So, I propose simply staying the course here. There’s absolutely nothing in the gold technicals that suggest the prevailing short and long term uptrends are going to end any time soon.
(But they might end immediately. I don’t concern myself with this possibility because I know I’ll see the supply-side coming in with their black bodied candles and or upward pointing shadows – not to mention their falling peaks and falling troughs).
Demand is 2755-2785. The short term trend will also likely act as dynamic demand around there. As long as gold continues to close above these zones of demand I suggest the short term trend is up.
Supply? In theory it’s the previous all time high of 2849.5. But, looking at Thursday’s candle – there doesn’t appear to be a great deal of supply actually there.
So, for all intents and purposes, there is none. Even better for following the trend! 📈✅
High Grade Copper Futures (Front month, back-adjusted) COMEX
%20COMEX%20chart%2031%20Jan%202024.png)
Layers of supply await (click here for full size image)
The last time we covered copper was in ChartWatch in the Evening Wrap on 17 January.
In that update, we were tracking a wall of white candles as markets were marking up US copper prices on anticipation of looming tariffs. Since, the price action has been mixed, on the back of the Trump inauguration speech (tariffs may be used to gain concessions from trading partners and may not be implemented), and the DeepSeek wobble (AI may be less energy intensive and this could slow demand for copper).
But those are all fundamentals. I could have simply said: Supply entered the market and overwhelmed demand, as evidenced by the black candles and upward pointing shadows.
Both narratives are equally valid.
The copper price is trying to steady at the dynamic demand of the short term uptrend ribbon, but candles here are so far unconvincing in terms of demonstrating a resumption of demand-side control.
As noted in the last update, regardless of what is happening in the short term here – there remains a total and abject lack of a decisive long term trend. So for me, the copper chart is a big pile of ho-hum.
4.205 is the key point of demand. A close below it will likely facilitate a probing of the 4.005 major point of demand – below that we’re in bear market territory.
Supply is 4.47, but even if the candles can remain demand-side there (i.e. white bodies and or downward pointing shadows), 4.5625-4.5685 is likely to cap, and beyond there lie even further layers of excess supply lurking in the system.
Economy
Today
AUS Producer Price Index (PPI) December quarter
+0.8% q/q vs +1.0% q/q forecast and +0.9% q/q in September quarter
Wholesale inflation data, suggests a +3.6% p.a. increase December quarter, a slight easing from the +3.7% p.a. clip in the September quarter
Shows inflation remains stubbornly high, but easing at a gradual pace
PPI is usually considered a leading indicator for consumer inflation as measured by the consumer price index (CPI)
Later this week
Saturday
00:30 USA Core PCE Price Index December (+0.2% m/m and +2.5% p.a. forecast vs +0.1% m/m and +2.4% p.a. in November)
Latest News
Interesting Movers
Trading higher
+10.9% Alpha HPA (A4N) - No news since yesterday's Presentation to Investors
+10.0% Appen (APX) - No news since yesterday's Q4 FY24 Quarterly Activity Report and Appendix 4C, rise is consistent with prevailing short and long term uptrends 🔎📈
+9.6% Opthea (OPT) - Quarterly Activities/Appendix 4C Cash Flow Report, rise is consistent with prevailing short and long term uptrends, a regular in ChartWatch ASX Scans Uptrends list 🔎📈
+9.5% Pantoro (PNR) - No news, generally higher gold sector today on new record for gold price, rise is consistent with prevailing short and long term uptrends 🔎📈
+8.6% Healthco Healthcare and Wellness Reit (HCW) - No news 🤔
+7.8% Imdex (IMD) - No news, rise is consistent with prevailing short and long term uptrends 🔎📈
+7.3% Playside Studios (PLY) - No news, bounce following massive plunge after 29-Jan Unaudited 1HFY25 Result & Trading Update
Trading lower
-17.5% Peninsula Energy (PEN) - Quarterly Activities Report, Quarterly Cashflow Report and Update on Central Processing Plant Commissioning, fall is consistent with prevailing short and long term downtrends 🔎📉
-12.8% Pointsbet (PBH) – Q2 FY25 Appendix 4C and Presentation
-7.6% Magellan Financial Group (MFG) - Continued negative response to yesterday's Update to Executive and Investment Teams
-6.7% Origin Energy (ORG) – December 2024 Quarterly Report
-2.6% Mineral Resources (MIN) - No news since yesterday's Quarterly Activity Report - Q2 FY25, several brokers responded today by cutting their price targets on the stock (see Broker Moves section below for more details), fall is consistent with prevailing short and long term downtrends, a regular in ChartWatch ASX Scans Downtrends list 🔎📉
-2.6% IGO (IGO) - No news since yesterday's December 2024 Quarterly Activities Report, several brokers responded today by cutting their price targets on the stock (see Broker Moves section below for more details), fall is consistent with prevailing short and long term downtrends, a regular in ChartWatch ASX Scans Downtrends list 🔎📉
-2.4% Credit Corp Group (CCP) - Continued negative response to yesterday's Credit Corp Group H1 of 2025 Results Presentation
Broker Moves
The A2 Milk Company (A2M)
Retained at buy at Citi; Price Target: $7.66
Aussie Broadband (ABB)
Retained at positive at E&P; Price Target: $4.20
Aristocrat Leisure (ALL)
Retained at outperform at Macquarie; Price Target: $75.00
Autosports Group (ASG)
Retained at neutral at Citi; Price Target: $1.75 from $2.10
Australian Vanadium (AVL)
Retained at buy at Shaw and Partners; Price Target: $0.08
Accent Group (AX1)
Retained at buy at Bell Potter; Price Target: $2.60 from $2.75
Bluebet (BBT)
Retained at add at Morgans; Price Target: $0.43 from $0.36
Bannerman Energy (BMN)
Retained at buy at Canaccord Genuity; Price Target: $4.33
Retained at buy at Shaw and Partners; Price Target: $7.40
Boss Energy (BOE)
Retained at buy at Bell Potter; Price Target: $4.90 from $4.70
Beach Energy (BPT)
Retained at neutral at Macquarie; Price Target: $1.45 from $1.35
Brightstar Resources (BTR)
Retained at buy at Canaccord Genuity; Price Target: $0.06
Brambles (BXB)
Retained at outperform at Macquarie; Price Target: $21.20 from $17.85
Credit Corp Group (CCP)
Retained at add at Morgans; Price Target: $20.50 from $20.65
Champion Iron (CIA)
Retained at buy at Bell Potter; Price Target: $7.10 from $7.15
Retained at buy at Citi; Price Target: $7.10 from $7.40
Retained at buy at Goldman Sachs; Price Target: $7.60 from $7.80
Retained at outperform at Macquarie; Price Target: $6.70 from $7.50
Capricorn Metals (CMM)
Retained at buy at Argonaut Securities; Price Target: $10.60 from $10.00
Downgraded to hold at Bell Potter; Price Target: $7.84 from $7.54
Retained at buy at Canaccord Genuity; Price Target: $8.85 from $8.95
Retained at neutral at Goldman Sachs; Price Target: $7.55
Retained at buy at Jarden; Price Target: $7.99 from $6.96
Downgraded to underperform from neutral at Macquarie; Price Target: $7.30 from $7.10
Coles Group (COL)
Retained at outperform at Macquarie; Price Target: $20.60 from $19.50
Credit Corp Group (CCP)
Downgraded to neutral from outperform at Macquarie; Price Target: $16.27 from $19.62
DigiCo REIT (DGT)
Initiated at add at Morgans; Price Target: $5.60
Domino's Pizza Enterprises (DMP)
Retained at underperform at Macquarie; Price Target: $28.20 from $29.50
Deterra Royalties (DRR)
Retained at buy at Canaccord Genuity; Price Target: $4.90 from $4.70
Duratec (DUR)
Retained at buy at Bell Potter; Price Target: $1.73
Develop Global (DVP)
Retained at buy at Canaccord Genuity; Price Target: $4.80 from $4.70
Endeavour Group (EDV)
Retained at neutral at Macquarie; Price Target: $4.20 from $4.50
Gold Road Resources (GOR)
Downgraded to hold from buy at Moelis Australia; Price Target: $2.55 from $2.60
HMC Capital (HMC)
Upgraded to buy from neutral at UBS; Price Target: $10.85 from $7.95
Harvey Norman (HVN)
Retained at outperform at Macquarie; Price Target: $5.20 from $5.00
IGO (IGO)
Retained at sell at Canaccord Genuity; Price Target: $4.40 from $4.30
Retained at neutral at Citi; Price Target: $5.30 from $5.40
Retained at buy at Goldman Sachs; Price Target: $5.60 from $6.05
Retained at outperform at Macquarie; Price Target: $5.80 from $5.90
Retained at underweight at Morgan Stanley; Price Target: $4.50
Retained at neutral at UBS; Price Target: $5.45
Inghams Group (ING)
Retained at outperform at Macquarie; Price Target: $3.50
JB HI-FI (JBH)
Retained at outperform at Macquarie; Price Target: $108.00 from $77.00
Judo Capital (JDO)
Retained at neutral at Macquarie; Price Target: $1.75 from $1.60
James Hardie Industries (JHX)
Upgraded to buy from hold at Jefferies; Price Target: $63.00 from $56.00
Karoon Energy (KAR)
Retained at buy at Citi; Price Target: $2.00
Retained at buy at Goldman Sachs; Price Target: $2.08 from $2.04
Retained at buy at Jarden; Price Target: $1.95 from $1.90
Retained at outperform at Macquarie; Price Target: $1.90 from $2.00
Retained at equal-weight at Morgan Stanley; Price Target: $1.76
Retained at outperform at RBC Capital Markets; Price Target: $1.80 from $1.90
Kingsgate Consolidated (KCN)
Retained at buy at Canaccord Genuity; Price Target: $3.35 from $3.55
Light & Wonder (LNW)
Retained at outperform at Macquarie; Price Target: $180.00
Medadvisor (MDR)
Downgraded to hold from buy at Bell Potter; Price Target: $0.21 from $0.40
Magellan Financial Group (MFG)
Downgraded to underweight from neutral at Jarden; Price Target: $9.35 from $10.25
Downgraded to sell from neutral at UBS; Price Target: $10.30 from $10.90
Michael Hill International (MHJ)
Retained at neutral at Citi; Price Target: $0.50 from $0.57
Retained at outperform at Macquarie; Price Target: $0.70 from $0.73
Mineral Resources (MIN)
Retained at neutral at Citi; Price Target: $35.00
Retained at hold at CLSA; Price Target: $34.00 from $36.50
Retained at hold at Jefferies; Price Target: $36.00 from $38.00
Retained at neutral at Macquarie; Price Target: $36.00 from $37.00
Retained at overweight at Morgan Stanley; Price Target: $50.00
Retained at hold at Morgans; Price Target: $35.00 from $39.00
Retained at sell at UBS; Price Target: $33.00 from $34.00
Nickel Industries (NIC)
Retained at buy at Citi; Price Target: $1.00 from $1.05
Retained at hold at Jefferies; Price Target: $0.80
Retained at neutral at Macquarie; Price Target: $0.88 from $0.95
Retained at overweight at Morgan Stanley; Price Target: $1.05
Retained at buy at UBS; Price Target: $1.05 from $1.10
Nextdc (NXT)
Retained at buy at Citi; Price Target: $20.00
Perpetual (PPT)
Retained at buy at Bell Potter; Price Target: $25.40
Retained at buy at Citi; Price Target: $24.20 from $22.50
Retained at buy at UBS; Price Target: $24.00 from $24.40
Perenti (PRN)
Retained at buy at Citi; Price Target: $1.60
RMA Global (RMY)
Retained at buy at Bell Potter; Price Target: $0.10 from $0.12
Resolute Mining (RSG)
Retained at buy at Canaccord Genuity; Price Target: $0.70 from $0.85
Sandfire Resources (SFR)
Retained at neutral at Citi; Price Target: $10.50
Retained at hold at Jefferies; Price Target: $10.00
Retained at neutral at Macquarie; Price Target: $9.80
Retained at underweight at Morgan Stanley; Price Target: $9.00
Retained at accumulate at Ord Minnett; Price Target: $11.35 from $11.70
Upgraded to neutral from sell at UBS; Price Target: $10.45 from $9.85
Retained at market-weight at Wilsons; Price Target: $10.80
Spark New Zealand (SPK)
Retained at positive at E&P; Price Target: $3.40
Service Stream (SSM)
Retained at buy at Citi; Price Target: $1.70
Telstra Group (TLS)
Retained at positive at E&P; Price Target: $4.50
TPG Telecom (TPG)
Retained at neutral at E&P; Price Target: $5.30
Treasury Wine Estates (TWE)
Retained at outperform at Macquarie; Price Target: $12.60 from $13.90
Wesfarmers (WES)
Retained at neutral at Macquarie; Price Target: $74.35 from $75.30
Woolworths Group (WOW)
Retained at neutral at Macquarie; Price Target: $31.30 from $32.50
Zip Co. (ZIP)
Upgraded to buy from neutral at Citi; Price Target: $3.00 from $3.30
Retained at buy at UBS; Price Target: $3.35 from $3.65
Scans
Top Gainers
Code | Company | Last | % Chg |
|---|---|---|---|
| MVP | Medical Developments International Ltd | $0.665 | +51.14% |
| PHL | Propell Holdings Ltd | $0.021 | +40.00% |
| SIO | Simonds Group Ltd | $0.20 | +33.33% |
| WWG | Wiseway Group Ltd | $0.13 | +30.00% |
| KAI | Kairos Minerals Ltd | $0.016 | +23.08% |
Top Fallers
Code | Company | Last | % Chg |
|---|---|---|---|
| ATH | Alterity Therapeutics Ltd | $0.012 | -33.33% |
| BDT | Birddog Technology Ltd | $0.038 | -32.14% |
| UCM | Uscom Ltd | $0.021 | -30.00% |
| DAF | Discovery Alaska Ltd | $0.015 | -25.00% |
| ADR | Adherium Ltd | $0.012 | -20.00% |
52 Week Highs
Code | Company | Last | % Chg |
|---|---|---|---|
| SIO | Simonds Group Ltd | $0.20 | +33.33% |
| BXN | Bioxyne Ltd | $0.044 | +22.22% |
| GDM | Great Divide Mining Ltd | $0.375 | +15.39% |
| ESR | Estrella Resources Ltd | $0.031 | +10.71% |
| OPT | Opthea Ltd | $1.14 | +9.62% |
52 Week Lows
Code | Company | Last | % Chg |
|---|---|---|---|
| BDT | Birddog Technology Ltd | $0.038 | -32.14% |
| EYE | Nova EYE Medical Ltd | $0.14 | -15.15% |
| ERW | Errawarra Resources Ltd | $0.029 | -14.71% |
| GRE | Greentech Metals Ltd | $0.056 | -12.50% |
| RGT | Argent Biopharma Ltd | $0.14 | -12.50% |
Near Highs
Code | Company | Last | % Chg |
|---|---|---|---|
| SMLL | Betashares Australian Small Companies Select ETF | $3.74 | +0.54% |
| OZBD | Betashares Australian Composite Bond ETF | $44.35 | -0.18% |
| PCI | Perpetual Credit Income Trust | $1.185 | +0.85% |
| WVOL | Ishares MSCI World Ex Aust Minimum Volatility ETF | $43.77 | +0.78% |
| AII | Almonty Industries Inc | $1.35 | 0.00% |
Relative Strength Index (RSI) Oversold
Code | Company | Last | % Chg |
|---|---|---|---|
| NXL | NUIX Ltd | $4.49 | +4.91% |
| PLY | Playside Studios Ltd | $0.22 | +7.32% |
| RFF | Rural Funds Group | $1.62 | -0.31% |
| CXL | CALIX Ltd | $0.595 | -3.25% |
| AIS | Aeris Resources Ltd | $0.145 | -3.33% |
