News | Market Wraps
Evening Wrap: ASX 200 closes at 3-month high on surging gold stocks, as Nufarm, James Hardie dumped on results
The S&P/ASX 200 closed 43.5 points higher, up 0.52%.

Mentioned
The S&P/ASX 200 closed 43.5 points higher, up 0.52%.
The S&P/ASX 200 logged its best close in 3-months today as gold stocks rocketed 5% on a rally in the gold price overnight. Within that 5% sector gain,were even better moves from the likes of Adriatic Metals (ADT) (+25.3%), Predictive Discovery (PDI) (+10.4%), and Perseus Mining (PRU) (+9.7%) - but there were plenty more.
All but two of the major sectors where higher today, with just Consumer Discretionary (XDJ) (-0.16%) and Industrials (XNJ) (-0.52%) modestly lower. There were a couple of terrible losses at a stock-specific level, though, as Nufarm (NUF) (-30.1%) and James Hardie Industries (JHX) (-6.2%) each reported results that disappointed the market.
To make sense of all the above, I have detailed technical analysis on the Nasdaq Composite, S&P/ASX 200, and Gold and Bitcoin in today's ChartWatch.
Be sure to click/scroll through for the usual reporting of the major sector and stock-specific moves, the broker responses to them, as well as all the key upcoming economic data in tonight's Evening Wrap.
Let's dive in!
Today in Review
Wed 21 May 25, 5:13pm (AEST)
Name | Value | % Chg |
|---|---|---|
Major Indices | ||
| ASX 200 | 8,386.8 | +0.52% |
| All Ords | 8,611.7 | +0.45% |
| Small Ords | 3,169.1 | +0.34% |
| All Tech | 3,933.3 | +0.66% |
| Emerging Companies | 2,251.4 | -0.75% |
Currency | ||
| AUD/USD | 0.642 | 0.00% |
US Futures | ||
| S&P 500 | 5,925.5 | -0.57% |
| Dow Jones | 42,563.0 | -0.49% |
| Nasdaq | 21,296.75 | -0.70% |
Name | Value | % Chg |
|---|---|---|
Sector | ||
| Energy | 7,783.9 | +1.02% |
| Health Care | 41,891.7 | +0.95% |
| Communication Services | 1,813.5 | +0.88% |
| Utilities | 9,418.0 | +0.82% |
| Financials | 9,033.7 | +0.74% |
| Information Technology | 2,787.9 | +0.63% |
| Materials | 16,411.3 | +0.56% |
| Real Estate | 3,854.4 | +0.30% |
| Consumer Staples | 12,468.8 | +0.23% |
| Consumer Discretionary | 4,099.0 | -0.16% |
| Industrials | 8,265.6 | -0.52% |
Markets
%20intraday%20chart%2021%20May%202025.png)
ASX 200 Session Chart
The S&P/ASX 200 (XJO) finished 43.5 points higher at 8,386.8, % from its session high/low and just % from its high/low. Disturbingly, despite the seemingly strong performance in the benchmark, in the broader-based S&P/ASX 300 (XKO) advancers lagged decliners by 132 to 148.
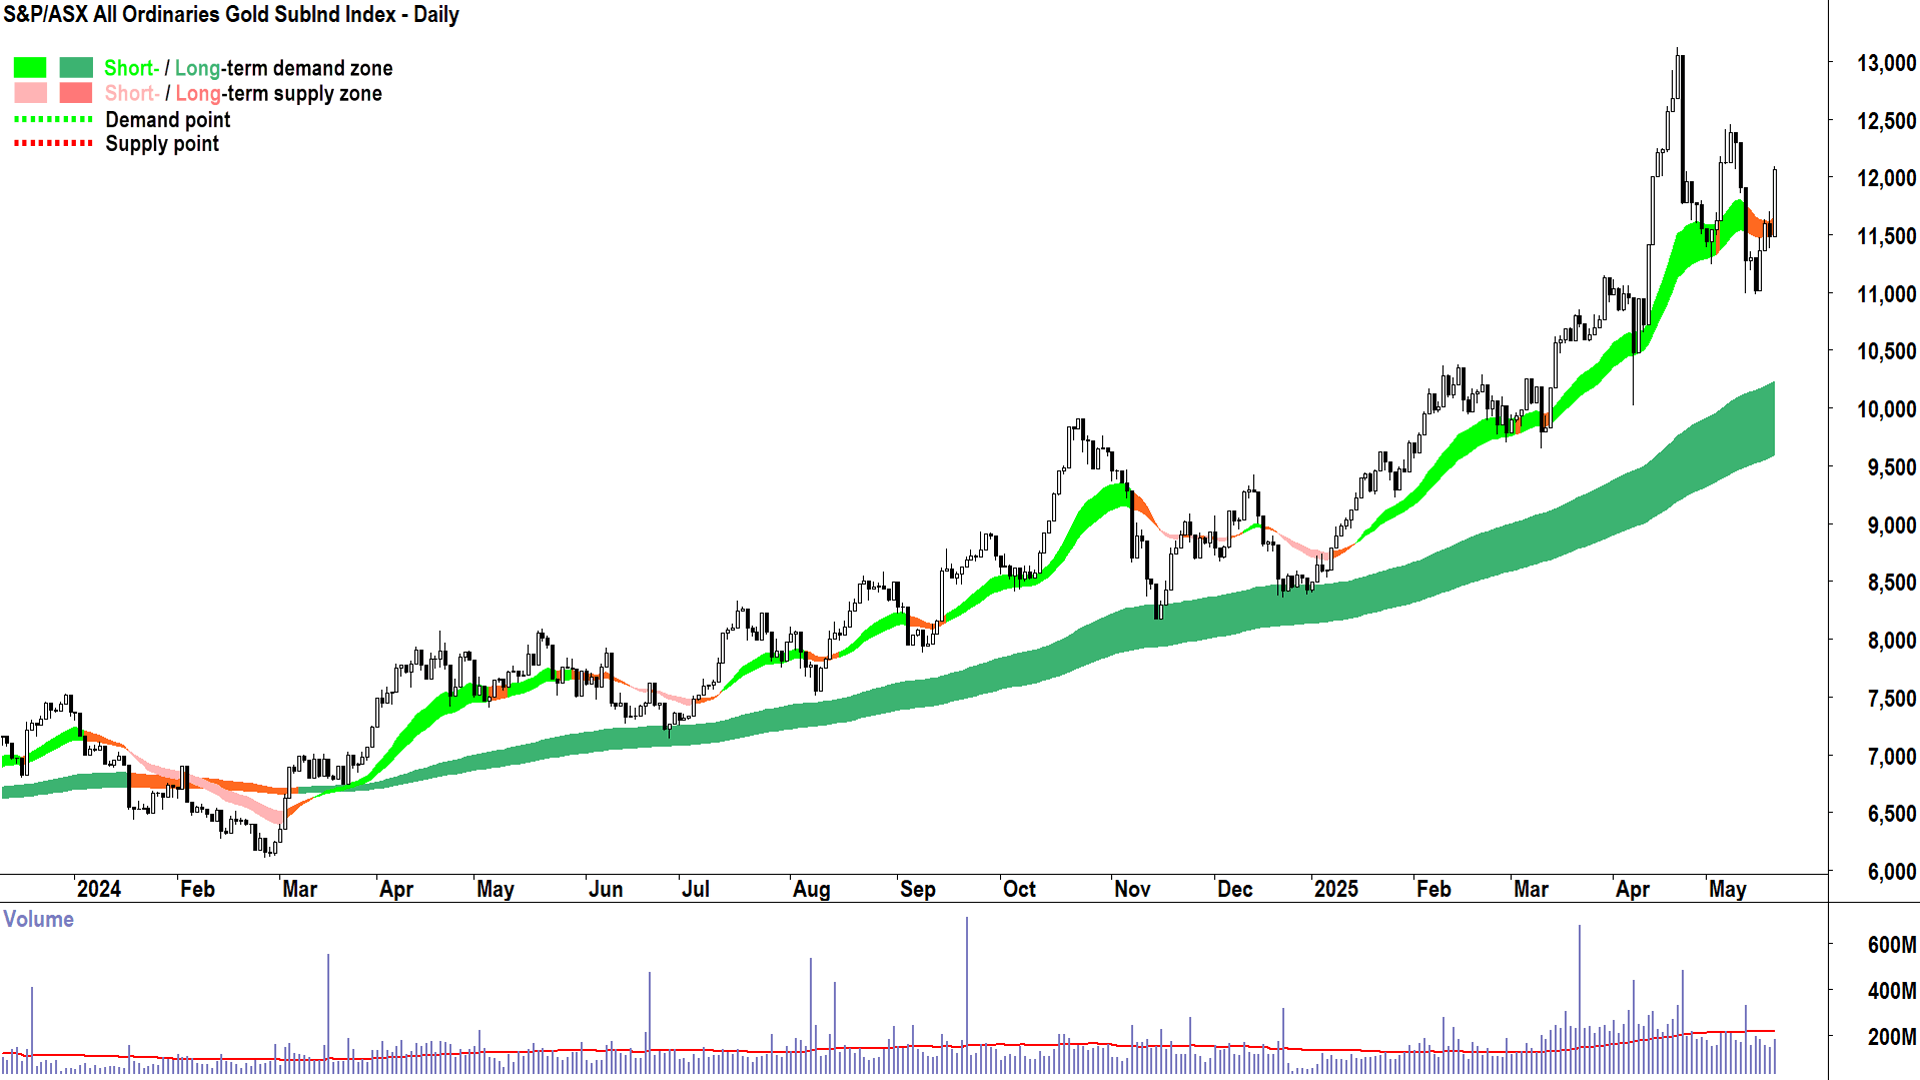
The highlight of today’s trade, to the point where everything else looked substantially ho-hum, is that 5.0% jump in the Gold (XGD) Sub-Index. That’s a massive one-day pop, particularly when one considers it has been on the wrong end of several similar-sized beatings over the last few weeks. Looking at the XGD chart below, the recent rollercoaster ride since the 22 April peak is clear.
%20%20chart%2021%20May%202025.png)
S&P/ASX All Ordinaries Gold SubInd Index (XGD) (click here for full size image)
“High beta” means bigger upswings and downswings in price compared to that of a benchmark. Aussie gold stocks are a plaything of mum and dad investors and international hedge funds alike. For the latter, it’s largely because of the outsized exposure gold equities gives one to the gold price (a small move in the gold price can have a large move in marginal profits).
The question we’re all probably scratching our heads trying to answer after today’s stonking day on the XGD is this: Is the great gold stocks bull market of 2024-25 still alive? 🤔
As you know from suffering through my ChartWatch analysis in these Wraps, I’ve been a bit down on gold since the gold price threw in a few candles as well as some price action that’s far from consistent with demand-side control. As for gold stocks, it’s been a little bitter-sweet, with arguably just as many ChartWatch ASX Scans Uptrends List stalwarts kicking on as those tracking the gold price into at least short term supply-side control.
Each chart tells its own story, and each chart needs to be dealt with individually with respect to maintaining, raising, or cutting risk.
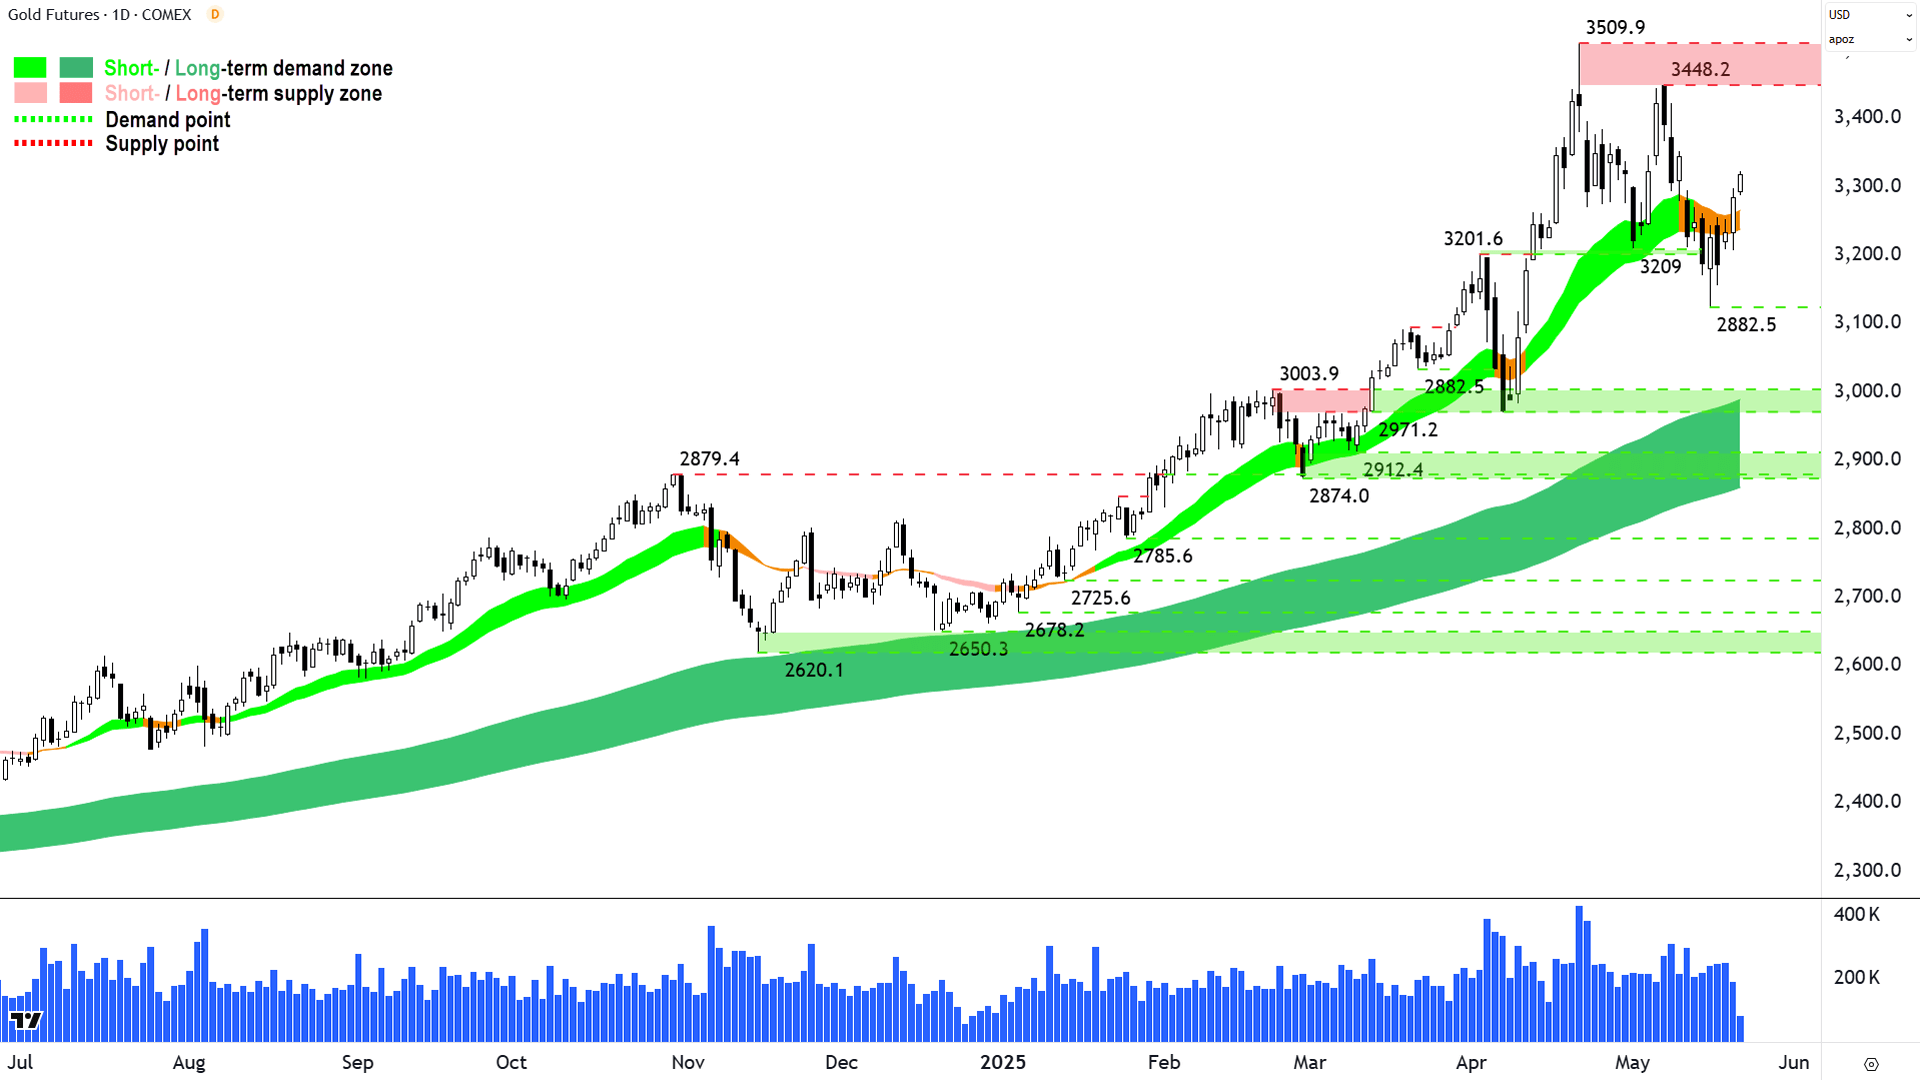
Looking at the gold price below, which we discussed only on Monday in ChartWatch here, I’m still not convinced that the demand-side is completely in control of short term pricing – even after Tuesday's rally and today’s follow-through in Asia (the last candle is live).
%20COMEX%20%20chart%2021%20May%202025.png)
Gold Futures (Front month, back-adjusted) COMEX (click here for full size image)
That caution will likely remain until gold can print some higher troughs, and preferably also have a good look at the supply between 3448-3510. This means at least a few solid demand-side candles around there (i.e., white-bodied and or those with downward pointing shadows).
Phases like this, where the market is trying to decide whether a major and market-imagination-capturing bull market deserves to continue are common. I suggest the key is to ape the market…i.e., strong uptrend = all aboard, versus strong downtrend = all alight (or all aboard for shorts).
In the middle – that’s where we are now – as suggested above, it’s a case by case basis with an open mind ⚖️!
ChartWatch
NASDAQ Composite Index

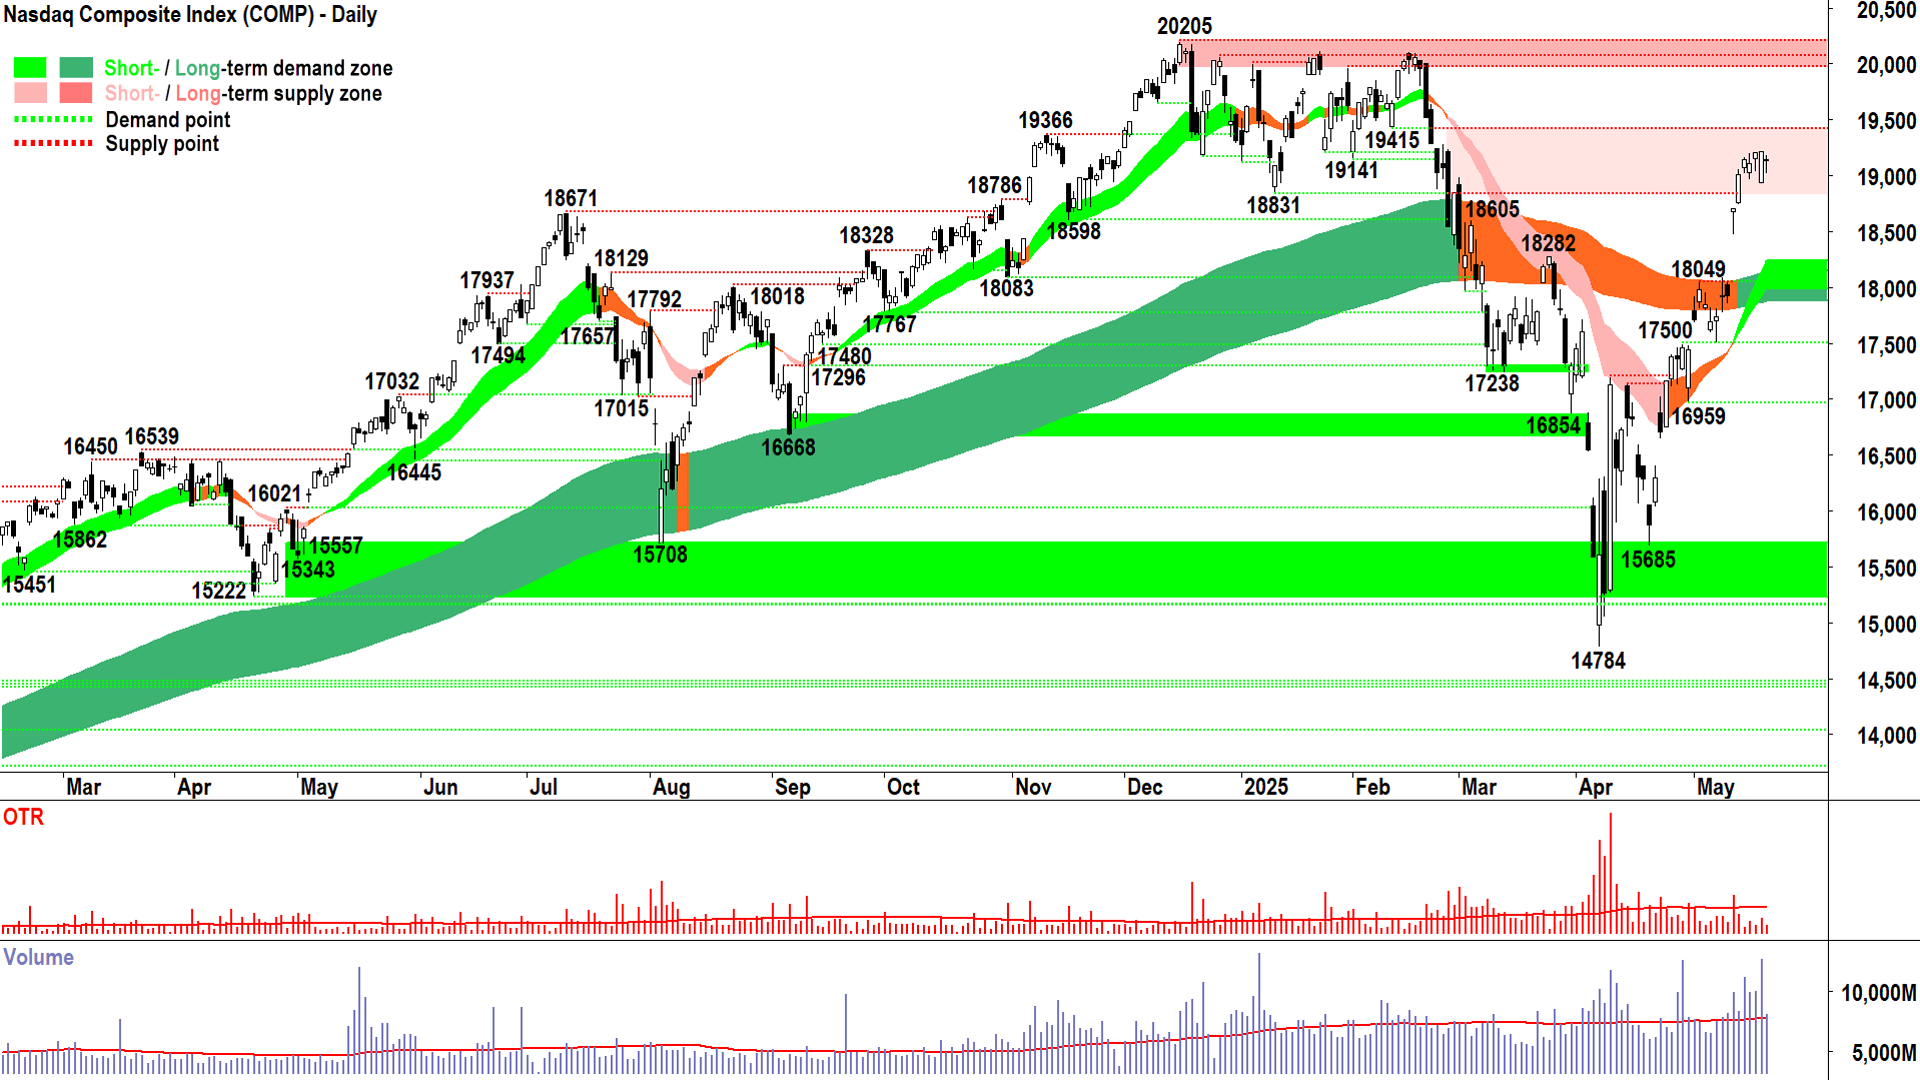
Demand taking a breather, probing supply (click here for full size image)
Small decline, off lows. Reasonably true to form. No need to alter our view.
That’s my take from last night’s candle on the Comp. Let’s break it down, starting with that downward pointing shadow.
Downward pointing shadows are one of the two “fingerprints of demand” we discuss regularly here – the other being white-bodied candles.
The only way you can get a downward pointing shadow is if:
There was excess supply at some stage during the candle that pushed the price down to the bottom of the shadow.
That supply was consumed, and an ensuing state of excess demand pushed the price back up to close higher than the low.
The longer the downward pointing shadow, logically, the greater was the excess demand that pushed prices back up. Downward pointing shadows are consistent with buy the dip activity, which itself is consistent with demand-side control.
It wasn’t a “clean” demand-side candle on Tuesday, however. There was a small upward pointing shadow, and we did lose a little ground on Monday’s strong demand-side showing (long white-bodied candle).
This is disappointing, because Monday’s candle was such a strong showing, ideally, we should have seen more of a follow through last night.
I think Monday’s candle is so important, I would go so far as to say that its low is a key short term pressure point, more specifically, a key short term point of demand.
If we can stay above it, then the probability the current rally pushes into 20205 grows substantially. However, if we close below it, then it’s a good sign that we have indeed found sufficient supply in the market to precipitate at least a modest pullback – most likely towards the demand zone I have previously identified between 18472 and the short-and-long term uptrend ribbons.
S&P/ASX 200 (XJO)
%20chart%2021%20May%202025.png)
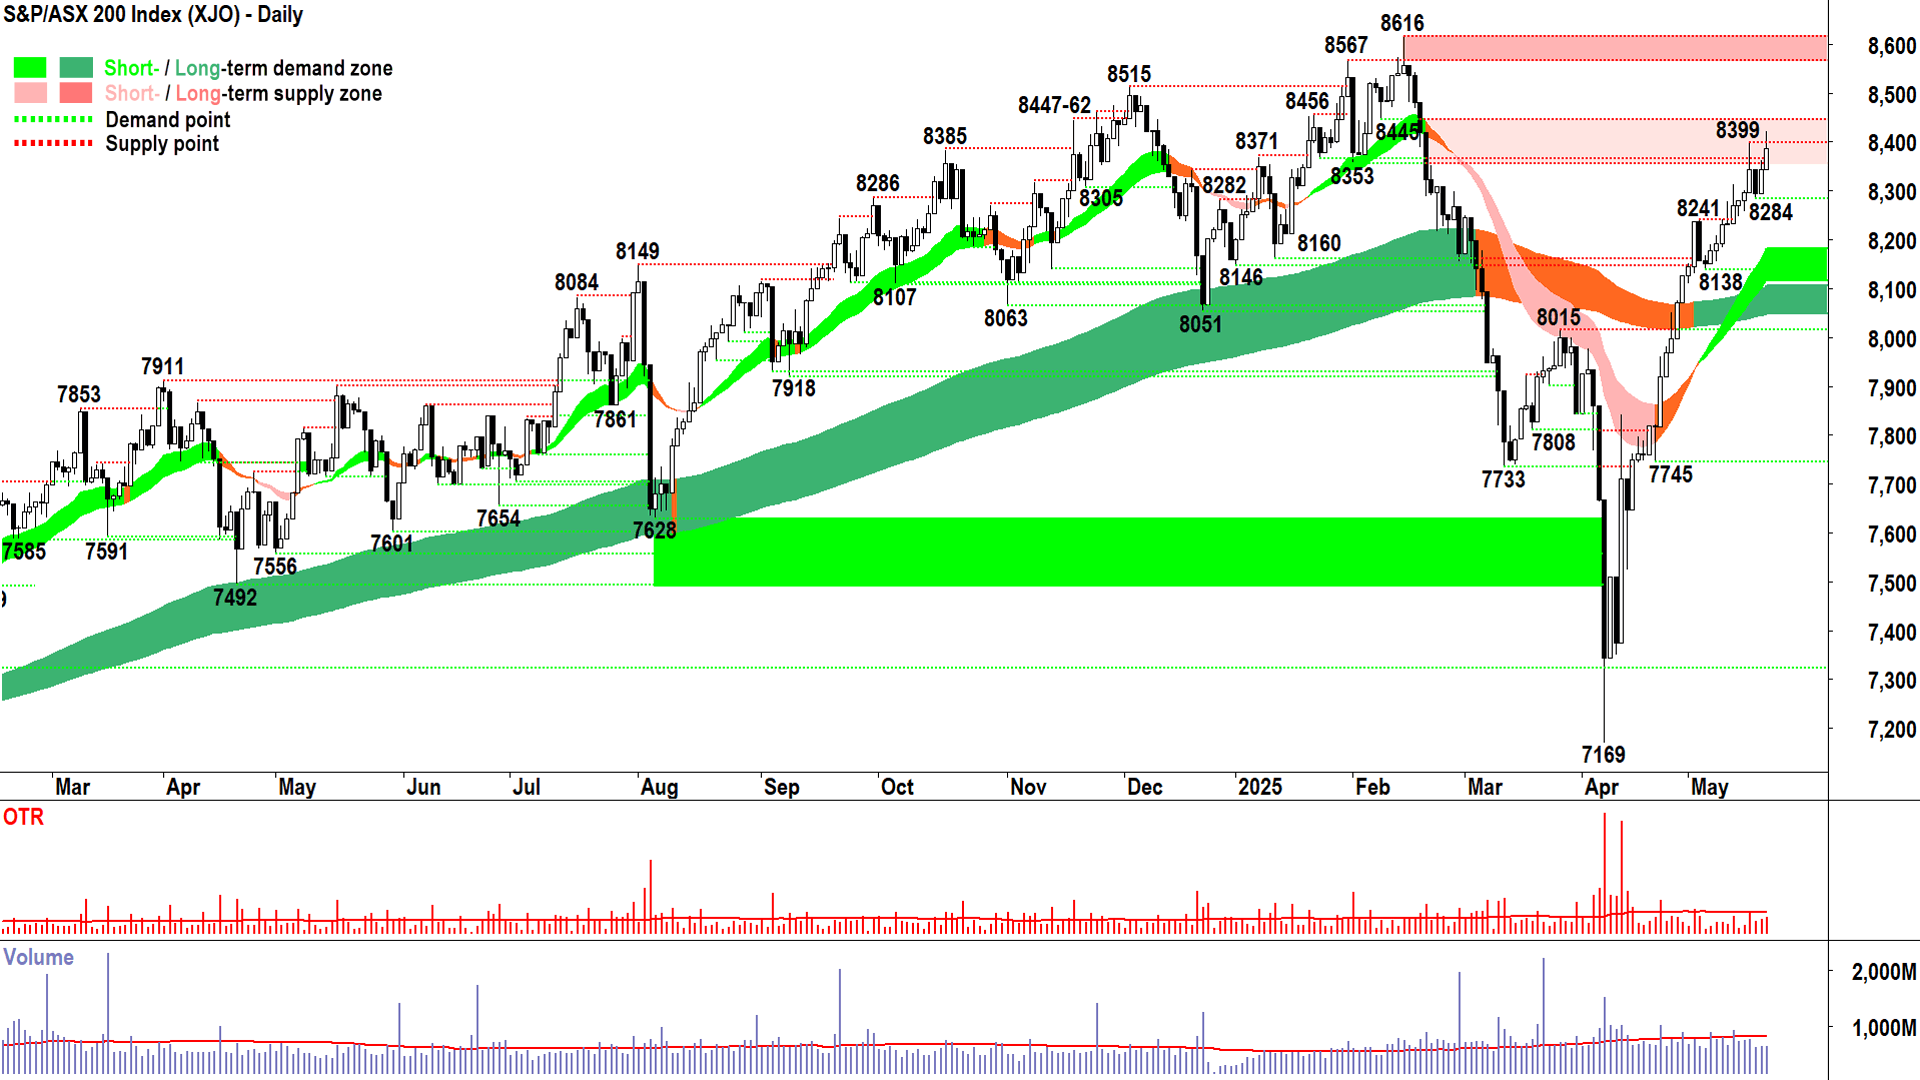
It’s a major pain in the…🫏! (click here for full size image)
Another day, and another disappointing close for the XJO 😭.
There are a group of fund managers that are belligerently selling into strong opens. It’s modest, yes, we’re still edging higher – even despite those regular upward pointing shadows.
But if you want my opinion…it’s a major pain in the…🫏!
They’re selling because they don’t think they’ll get much more / they’re getting a good price compared to what they’ll get down the track.
Maybe they’re right, maybe they’re wrong, that’s not a question a trend follower really cares about. Simply that this lack of faith is creating the supply which is keeping the demand-side in check for now.
Hey, that’s what makes a market. One party is going to be right, and one is going to be wrong. It’s all fair in love and war and in demand and supply! ⚖️
The key takeaway message for us, is that we must see this pesky supply is consumed if the XJO is to have any chance of giving 8616 a good shake. We will know when it is via our candles, of course, as high closes and long white bodies will speak volumes from here.
As will, um, volumes.
Not volume on your favourite 80’s boom box kind, rather, the measure of shares traded between the demand-and-supply-sides kind. The only way to get rid of that pesky supply is to trade with them. That means we’d like to see some elevated volume accompanying our strong demand-side candles from here.
In the meantime, 8343-8445 is supply, no change there. Demand is short term uptrend ribbon to 8284. I see no reason not to stay the course here as long as the price continues to close above that demand zone.
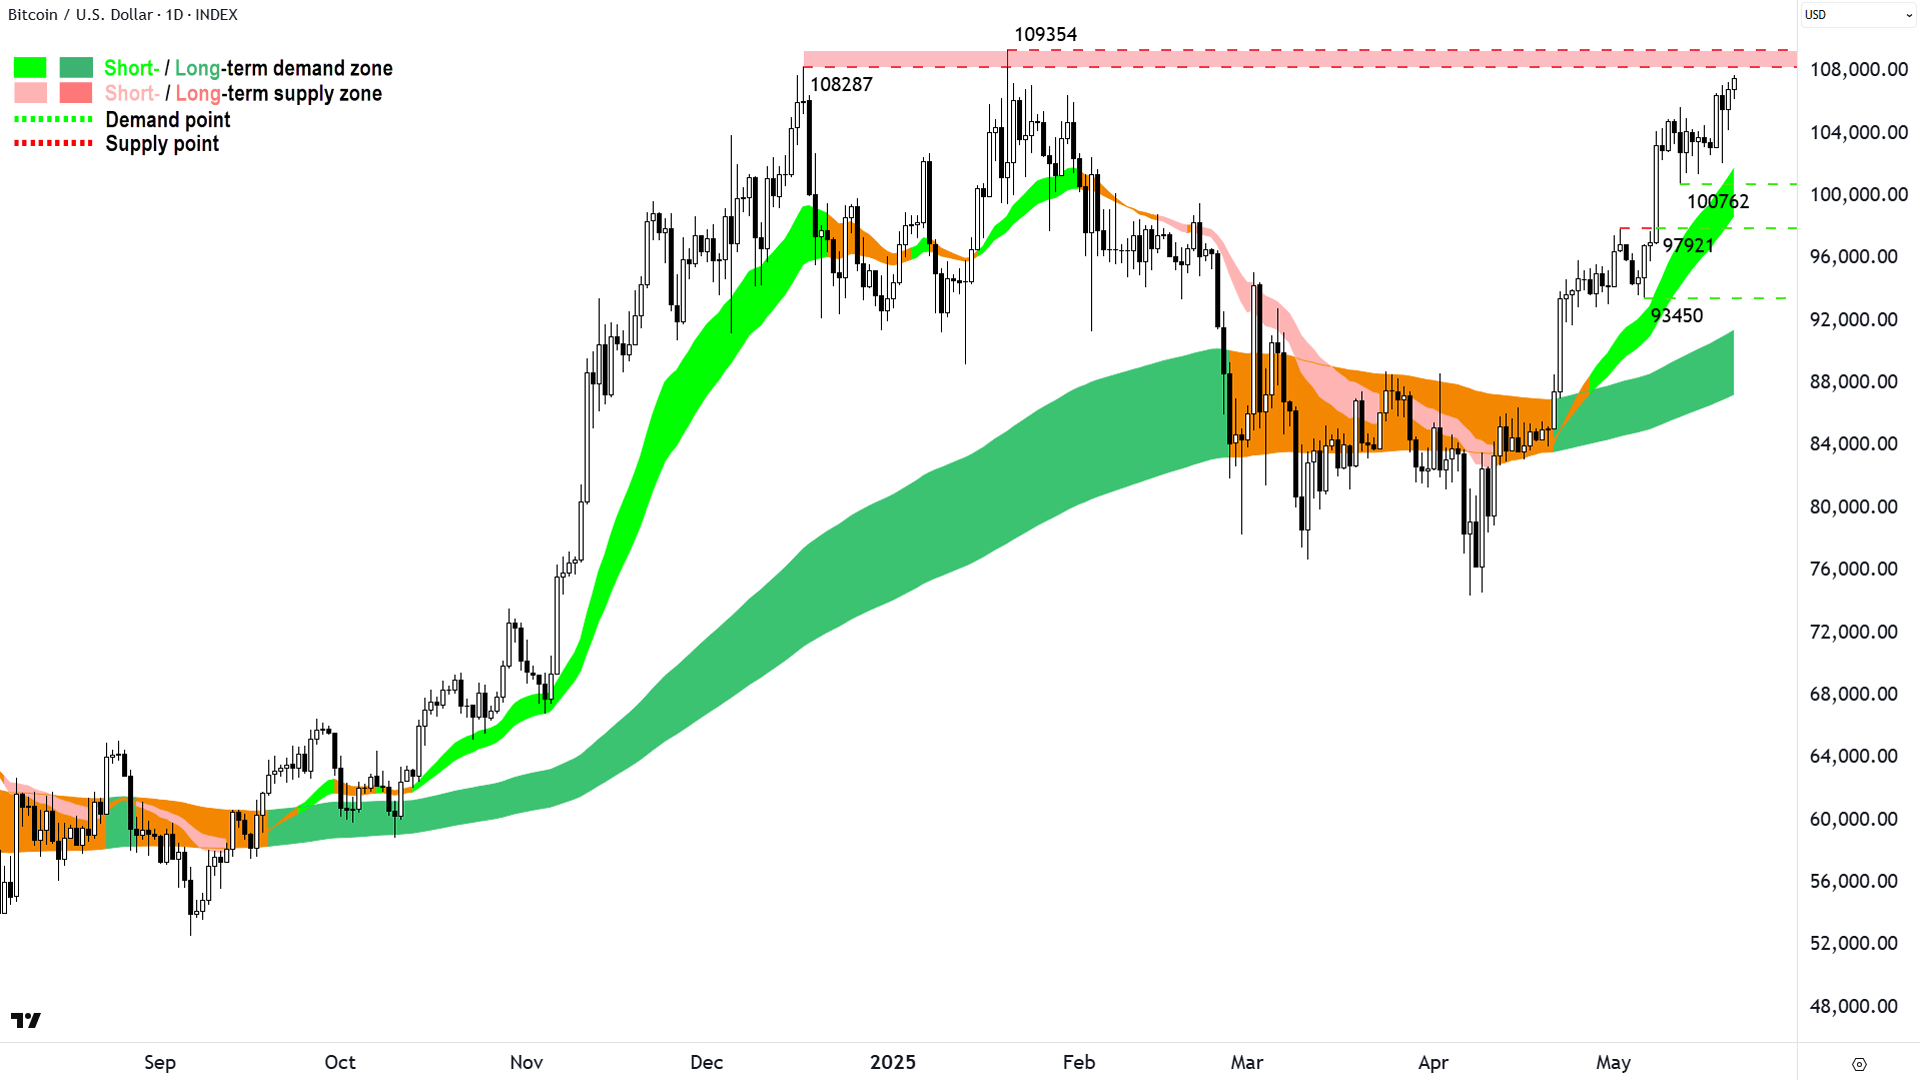
Bitcoin vs US Dollar (BTCUSD)

Answer: Nothing! (click here for full size image)
I posted this chart today on X with the question: What’s wrong with this chart? 🤔
My followers tend to be converted to my way of thinking, so the answers were along the lines of: Not very much.
Most acknowledged the strong short-and-long term uptrends, many the solid price action of risking peaks and rising troughs. A few also noted that Bitcoin is approaching a major point of supply.
These are all very valid observations. If you’ve been following me for a while on X, you’ll know I’ve repeated this post several times since December 2023 (when Bitcoin was around 30k). Each time, it was when I felt the answer to the question was, well: “Nothing” 🤷.
Logically, if there’s nothing wrong with a chart, then what should you be thinking about doing with it?
Exactly.
I do agree that 108287-109354 is a significant potential supply zone. I’d argue however, that we’re hitting it with enough decent candles, and with decent enough price action, to suggest there’s every chance we’ll clear it on this attempt.
Anyways, the future is unknown, DYOR, etc. I just think there’s nothing wrong with the chart! 📈
Economy
Today
There weren't any major data releases in our time zone today
Later this week
Thursday
09:00 AUS Flash Manufacturing Purchasing Managers Index (PMI) May:
Manufacturing: 51.7 in April
Services: 51.0 in April
18:00 EUR Flash Manufacturing PMI:
Manufacturing: 49.3 forecast and 49.0 in April
Services: 50.6 forecast and 50.1 in April
23:45 USA Flash Manufacturing PMI:
Manufacturing: 49.9 forecast and 50.2 in April
Services: 50.7 forecast and 50.8 in April
Friday
00:00 Existing Home Sales April (4.15 million forecast vs 4.02 million in March)
Saturday
00:00 New Home Sales April (696,000 forecast vs 724,000 in March)
Latest News
Interesting Movers
Trading higher
+25.3% Adriatic Metals (ADT) – Statement regarding press speculation, general strength across the broader Precious Metals sector today.
+13.7% Catapult Group International (CAT) – FY25 Results, rise is consistent with prevailing short and long term uptrends, a regular in ChartWatch ASX Scans Uptrends list 🔎📈
+10.4% Echoiq (EIQ) – Update on Category III CPT Code Application and Response to ASX Price Query.
+10.4% Predictive Discovery (PDI) – No news, general strength across the broader Gold sector today, rise is consistent with prevailing short and long term uptrends, a regular in ChartWatch ASX Scans Uptrends list 🔎📈
+9.7% Perseus Mining (PRU) – No news, general strength across the broader Gold sector today, rise is consistent with prevailing short and long term uptrends, a regular in ChartWatch ASX Scans Uptrends list 🔎📈
+9.5% Antipa Minerals (AZY) – Minyari Project Resource Grows by 100 Koz to 2.5 Moz of Gold, general strength across the broader Gold sector today, rise is consistent with prevailing short and long term uptrends, a regular in ChartWatch ASX Scans Uptrends list 🔎📈
+9.3% MTM Critical Metals (MTM) – No news, rise is consistent with prevailing short and long term uptrends, a regular in ChartWatch ASX Scans Uptrends list 🔎📈
+8.7% Kingston Resources (KSN) – Investor Presentation-Misima Divestment & Corporate Outlook andMisima Gold Project Sold to Ok Tedi for $95 Million, general strength across the broader Gold sector today, rise is consistent with prevailing short and long term uptrends 🔎📈
+8.6% Pantoro (PNR) – No news, general strength across the broader Gold sector today, rise is consistent with prevailing short and long term uptrends, a regular in ChartWatch ASX Scans Uptrends list 🔎📈
+8.6% Emerald Resources (EMR) – No news, general strength across the broader Gold sector today, rise is consistent with prevailing short and long term uptrends, a regular in ChartWatch ASX Scans Uptrends list 🔎📈
+7.6% Ora Banda Mining (OBM) – No news, general strength across the broader Gold sector today, rise is consistent with prevailing long term uptrend 🔎📈
+7.0% Seek (SEK) – Investor Day Presentation.
+6.9% Evolution Mining (EVN) – No news, general strength across the broader Gold sector today, rise is consistent with prevailing short and long term uptrends, a regular in ChartWatch ASX Scans Uptrends list 🔎📈
+6.9% West African Resources (WAF) – No news, general strength across the broader Gold sector today, rise is consistent with prevailing short and long term uptrends 🔎📈
+6.8% Regis Resources (RRL) – No news, general strength across the broader Gold sector today, rise is consistent with prevailing short and long term uptrends, a regular in ChartWatch ASX Scans Uptrends list 🔎📈
+6.7% Genesis Minerals (GMD) – No news, general strength across the broader Gold sector today, rise is consistent with prevailing short and long term uptrends, a regular in ChartWatch ASX Scans Uptrends list 🔎📈
+6.3% Ramelius Resources (RMS) – No news, general strength across the broader Gold sector today, rise is consistent with prevailing short and long term uptrends 🔎📈
+6.3% Iperionx (IPX) – No news, general strength across the broader Resources sector today.
+6.3% Westgold Resources (WGX) – No news, general strength across the broader Gold sector today.
+5.9% Technology One (TNE) – No news since 20-May Half Year FY25 Results, rise is consistent with prevailing short and long term uptrends, a regular in ChartWatch ASX Scans Uptrends list 🔎📈
+5.9% Spartan Resources (SPR) – No news, general strength across the broader Gold sector today, rise is consistent with prevailing short and long term uptrends 🔎📈
Trading lower
-30.1% Nufarm (NUF) – Nufarm HY25 results, fall is consistent with prevailing long term downtrend 🔎📉
-29.8% Mayne Pharma Group (MYX) – Update on Scheme with Cosette, today's move is consistent with recent volatility.
-15.4% Dateline Resources (DTR) – No news, pulled back in the wake of recent sharp rally.
-14.9% Novonix (NVX) – No news, repelled perfectly from long term downtrend ribbon! 🔎📉
-12.8% OFX Group (OFX) – No news since 20-May FY25 Results, fall is consistent with prevailing short and long term downtrends, a regular in ChartWatch ASX Scans Downtrends list 🔎📉
-10.0% Appen (APX) – No news, repelled perfectly from long term downtrend ribbon! 🔎📉
-7.7% Liontown Resources (LTR) – No news, fall is consistent with prevailing long term downtrend 🔎📉
-7.2% HMC Capital (HMC) – No news, fall is consistent with prevailing short and long term downtrends, a regular in ChartWatch ASX Scans Downtrends list 🔎📉
-6.8% IDP Education (IEL) – No news, fall is consistent with prevailing short and long term downtrends, one of the most Featured (highest conviction) stocks in ChartWatch ASX Scans Downtrends list 🔎📉
-6.2% James Hardie Industries (JHX) – Q4 FY25 Results, fall is consistent with prevailing long term downtrend 🔎📉
Broker Moves
Aml3d (AL3)
Initiated at buy at Bell Potter; Price Target: $0.300
Alkane Resources (ALK)
Retained at buy at Bell Potter; Price Target: $1.400
ANZ Group (ANZ)
Retained at equal-weight at Morgan Stanley; Price Target: $26.50
ARB Corporation (ARB)
Retained at sell at UBS; Price Target: $31.00 from $34.00
Beacon Lighting Group (BLX)
Retained at buy at Citi; Price Target: $3.96
Brazilian Rare Earths (BRE)
Retained at speculative buy at Ord Minnett; Price Target: $7.00
Breville Group (BRG)
Retained at neutral at Citi; Price Target: $38.20
Catapult Group International (CAT)
Retained at buy at UBS; Price Target: $5.00
Challenger (CGF)
Retained at buy at UBS; Price Target: $9.15 from $7.70
Charter Hall Long Wale Reit (CLW)
Upgraded to buy from neutral at Citi; Price Target: $4.40 from $4.00
Cleanaway Waste Management (CWY)
Retained at add at Morgans; Price Target: $2.98 from $2.95
Dexus (DXS)
Downgraded to hold from accumulate at Ord Minnett; Price Target: $7.40 from $7.70
EVT (EVT)
Retained at buy at Citi; Price Target: $16.12
Firefly Metals (FFM)
Retained at buy at Ord Minnett; Price Target: $1.600
HMC Capital (HMC)
Downgraded to underperform from hold at CLSA; Price Target: $4.60 from $11.61
James Hardie Industries (JHX)
Retained at sector perform at RBC Capital Markets; Price Target: $44.00
Retained at buy at UBS; Price Target: $50.00
Kogan.Com (KGN)
Retained at hold at Ord Minnett; Price Target: $5.00
Retained at neutral at UBS; Price Target: $4.90 from $5.20
LGI (LGI)
Retained at buy at Shaw and Partners; Price Target: $3.60
Lendlease Group (LLC)
Retained at hold at Ord Minnett; Price Target: $6.20 from $6.15
Monash IVF Group (MVF)
Retained at buy at Bell Potter; Price Target: $1.150 from $1.250
Retained at outperform at Macquarie; Price Target: $1.300 from $1.600
Upgraded to speculative buy from hold at Morgans; Price Target: $1.000 from $1.090
Retained at buy at Ord Minnett; Price Target: $1.050 from $1.100
Retained at sector perform at RBC Capital Markets; Price Target: $1.000 from $1.250
Nick Scali (NCK)
Retained at buy at Citi; Price Target: $20.64
New Hope Corporation (NHC)
Retained at add at Morgans; Price Target: $4.45 from $4.50
Nufarm (NUF)
Retained at sector perform at RBC Capital Markets; Price Target: $5.00
OFX Group (OFX)
Downgraded to hold from buy at Canaccord Genuity; Price Target: $1.000 from $2.00
Downgraded to market-weight from overweight at Wilsons; Price Target: $0.940 from $1.960
Rio Tinto (RIO)
Retained at buy at Goldman Sachs; Price Target: $140.80
Retained at equal-weight at Morgan Stanley; Price Target: $119.50
Resmed Inc (RMD)
Retained at buy at Goldman Sachs; Price Target: $49.30
Retained at overweight at Morgan Stanley; Price Target: US$286
Ramelius Resources (RMS)
Retained at buy at Ord Minnett; Price Target: $3.10 from $3.05
Regis Resources (RRL)
Retained at neutral at Macquarie; Price Target: $4.60 from $4.30
Seek (SEK)
Retained at positive at E&P; Price Target: $27.80
Serko (SKO)
Retained at buy at Citi; Price Target: $4.25
Retained at neutral at Macquarie; Price Target: NZ$3.17 from NZ$4.38
Retained at buy at Ord Minnett; Price Target: $5.98 from $5.91
Retained at buy at UBS; Price Target: NZ$4.55 from NZ$4.85
Telstra Group (TLS)
Retained at buy at Goldman Sachs; Price Target: $4.90 from $4.50
Retained at overweight at Jarden; Price Target: $4.60 from $4.45
Retained at neutral at Macquarie; Price Target: $3.93
Technology One (TNE)
Retained at hold at Bell Potter; Price Target: $35.50 from $31.00
Upgraded to positive from neutral at E&P; Price Target: $45.00 from $31.52
Retained at neutral at Goldman Sachs; Price Target: $38.10 from $26.90
Retained at buy at Jefferies; Price Target: $44.00 from $35.00
Retained at neutral at JP Morgan; Price Target: $33.50 from $27.00
Retained at neutral at Macquarie; Price Target: $34.40 from $31.00
Retained at hold at Morgans; Price Target: $36.85 from $29.90
Retained at hold at Ord Minnett; Price Target: $33.04 from $28.44
Retained at hold at Shaw and Partners; Price Target: $36.60 from $29.30
Retained at buy at UBS; Price Target: $42.20 from $33.80
Temple & Webster Group (TPW)
Retained at buy at Citi; Price Target: $21.10
Webjet (WJL)
Retained at outperform at RBC Capital Markets; Price Target: $1.300
Worley (WOR)
Retained at buy at Citi; Price Target: $18.00
Retained at buy at Goldman Sachs; Price Target: $17.25 from $18.00
Retained at buy at Jefferies; Price Target: $16.18 from $18.10
Retained at outperform at Macquarie; Price Target: $15.85 from $15.65
Retained at buy at UBS; Price Target: $22.00
Scans
Top Gainers
Code | Company | Last | % Chg |
|---|---|---|---|
| OCN | Oceana Lithium Ltd | $0.054 | +63.64% |
| RLT | Renergen Ltd | $0.82 | +35.54% |
| BOC | Bougainville Copper Ltd | $0.50 | +31.58% |
| RPG | Raptis Group Ltd | $0.018 | +28.57% |
| ADT | Adriatic Metals Plc | $4.71 | +25.27% |
Top Fallers
Code | Company | Last | % Chg |
|---|---|---|---|
| NUF | Nufarm Ltd | $2.81 | -30.10% |
| MYX | Mayne Pharma Group Ltd | $4.55 | -29.78% |
| YRL | Yandal Resources Ltd | $0.13 | -23.53% |
| ZNO | ZOONO Group Ltd | $0.05 | -23.08% |
| E79 | E79 Gold Mines Ltd | $0.02 | -20.00% |
52 Week Highs
Code | Company | Last | % Chg |
|---|---|---|---|
| OCN | Oceana Lithium Ltd | $0.054 | +63.64% |
| RPG | Raptis Group Ltd | $0.018 | +28.57% |
| WWI | West Wits Mining Ltd | $0.028 | +16.67% |
| CAT | Catapult Group International Ltd | $4.89 | +13.72% |
| MPK | Many Peaks Minerals Ltd | $0.675 | +12.50% |
52 Week Lows
Code | Company | Last | % Chg |
|---|---|---|---|
| NUF | Nufarm Ltd | $2.81 | -30.10% |
| DUB | Dubber Corporation Ltd | $0.017 | -19.05% |
| IR1 | Iris Metals Ltd | $0.12 | -17.24% |
| BCA | Black Canyon Ltd | $0.05 | -15.25% |
| CMG | Critical Minerals Group Ltd | $0.09 | -14.29% |
Near Highs
Code | Company | Last | % Chg |
|---|---|---|---|
| PCI | Perpetual Credit Income Trust | $1.19 | 0.00% |
| WVOL | Ishares MSCI World Ex Aust Minimum Volatility ETF | $44.26 | +0.87% |
| IAGPF | Insurance Australia Group Ltd | $104.27 | +0.07% |
| GCI | Gryphon Capital Income Trust | $2.05 | 0.00% |
| IHD | Ishares S&P/ASX DIV Opportunities Esg Screened ETF | $14.74 | -0.87% |
Relative Strength Index (RSI) Oversold
Code | Company | Last | % Chg |
|---|---|---|---|
| AVH | Avita Medical Inc | $2.05 | +1.99% |
| NWSLV | News Corporation | $41.40 | 0.00% |
| AOF | Australian Unity Office Fund | $0.485 | 0.00% |
| SKC | Skycity Entertainment Group Ltd | $0.905 | -2.16% |
| LTP | LTR Pharma Ltd | $0.28 | -8.20% |
