News | Market Wraps
Evening Wrap: ASX 200 snaps winning streak as markets swing risk-off in wake of Moody's US credit rating downgrade
The S&P/ASX 200 closed 48.6 points lower, down 0.58%.

Mentioned
The S&P/ASX 200 closed 48.6 points lower, down 0.58%.
Nothing lasts forever, and the record shows that the ASX 200's recent winning streak has stopped at 8. Today's about-face is the result of a negative market response to major ratings agency Moody's downgrade of the US's credit rating.
Sectors most reliant on global economic growth were hit the hardest as investors sold off key US bonds, sending long term market yields higher. Energy (XEJ) (-1.8%) and Resources (XJR) (-1.7%) were hardest hit. Real Estate (XPJ) (-0.7%) is also perceived to be a major loser in a rising interest rate environment.
Really, only the Gold Sub-Index (XGD) (+2.1%) got a boost today, possibly as investors sought safety in this risk-off sector, along with other defensives such as Utilities (XUJ) (+0.31%).
To make sense of all the above, I have detailed technical analysis on the Nasdaq Composite, S&P/ASX 200, and Gold in today's ChartWatch.
Be sure to click/scroll through for the usual reporting of the major sector and stock-specific moves, the broker responses to them, as well as all the key upcoming economic data in tonight's Evening Wrap.
Let's dive in!
Today in Review
Mon 19 May 25, 5:03pm (AEST)
Name | Value | % Chg |
|---|---|---|
Major Indices | ||
| ASX 200 | 8,295.1 | -0.58% |
| All Ords | 8,524.8 | -0.64% |
| Small Ords | 3,150.0 | -0.89% |
| All Tech | 3,857.4 | -0.43% |
| Emerging Companies | 2,278.1 | -1.41% |
Currency | ||
| AUD/USD | 0.6401 | 0.00% |
US Futures | ||
| S&P 500 | 5,909.25 | -1.11% |
| Dow Jones | 42,367.0 | -0.86% |
| Nasdaq | 21,207.5 | -1.39% |
Name | Value | % Chg |
|---|---|---|
Sector | ||
| Utilities | 9,393.3 | +0.31% |
| Communication Services | 1,776.1 | +0.22% |
| Consumer Discretionary | 4,077.5 | -0.13% |
| Consumer Staples | 12,419.0 | -0.13% |
| Industrials | 8,265.5 | -0.20% |
| Health Care | 41,360.4 | -0.28% |
| Financials | 8,897.7 | -0.38% |
| Information Technology | 2,708.1 | -0.41% |
| Real Estate | 3,789.5 | -0.66% |
| Materials | 16,339.5 | -1.55% |
| Energy | 7,717.3 | -1.82% |
Markets
%20intraday%20chart%2019%20May%202025.png)
ASX 200 Session Chart
The S&P/ASX 200 (XJO) finished 48.6 points lower at 8,295.1, 0.60% from its session high and just 0.13% from its low. In the broader-based S&P/ASX 300 (XKO) advancers lagged decliners by a dismal 87 to 199.
No doubt you’ve heard about the Moody’s downgrade of the US’s credit rating to Aa1 from Aaa (i.e. from the very top to the second top on a 21-notch rating scale).
Moody’s said that the downgrade “reflects the increase over more than a decade in government debt and interest payment ratios to levels that are significantly higher than similarly rated sovereigns.” The ratings agency also moved its outlook to “stable”, meaning that it likely won’t be making any further changes any time soon.
The impact on the markets is lower stock price futures and lower bond prices / higher bond yields, particularly for long dated US risk-frees. Not a massive move so far, because this is not a massive risk item – the news is the rating change – not the reasons for it which are well flagged and already discounted by the markets.
As always, market response to a news item rather than the news item itself is what matters the most to me – after all who cares what our tiny little brained interpretation is compared to the market’s all-knowing actual response!
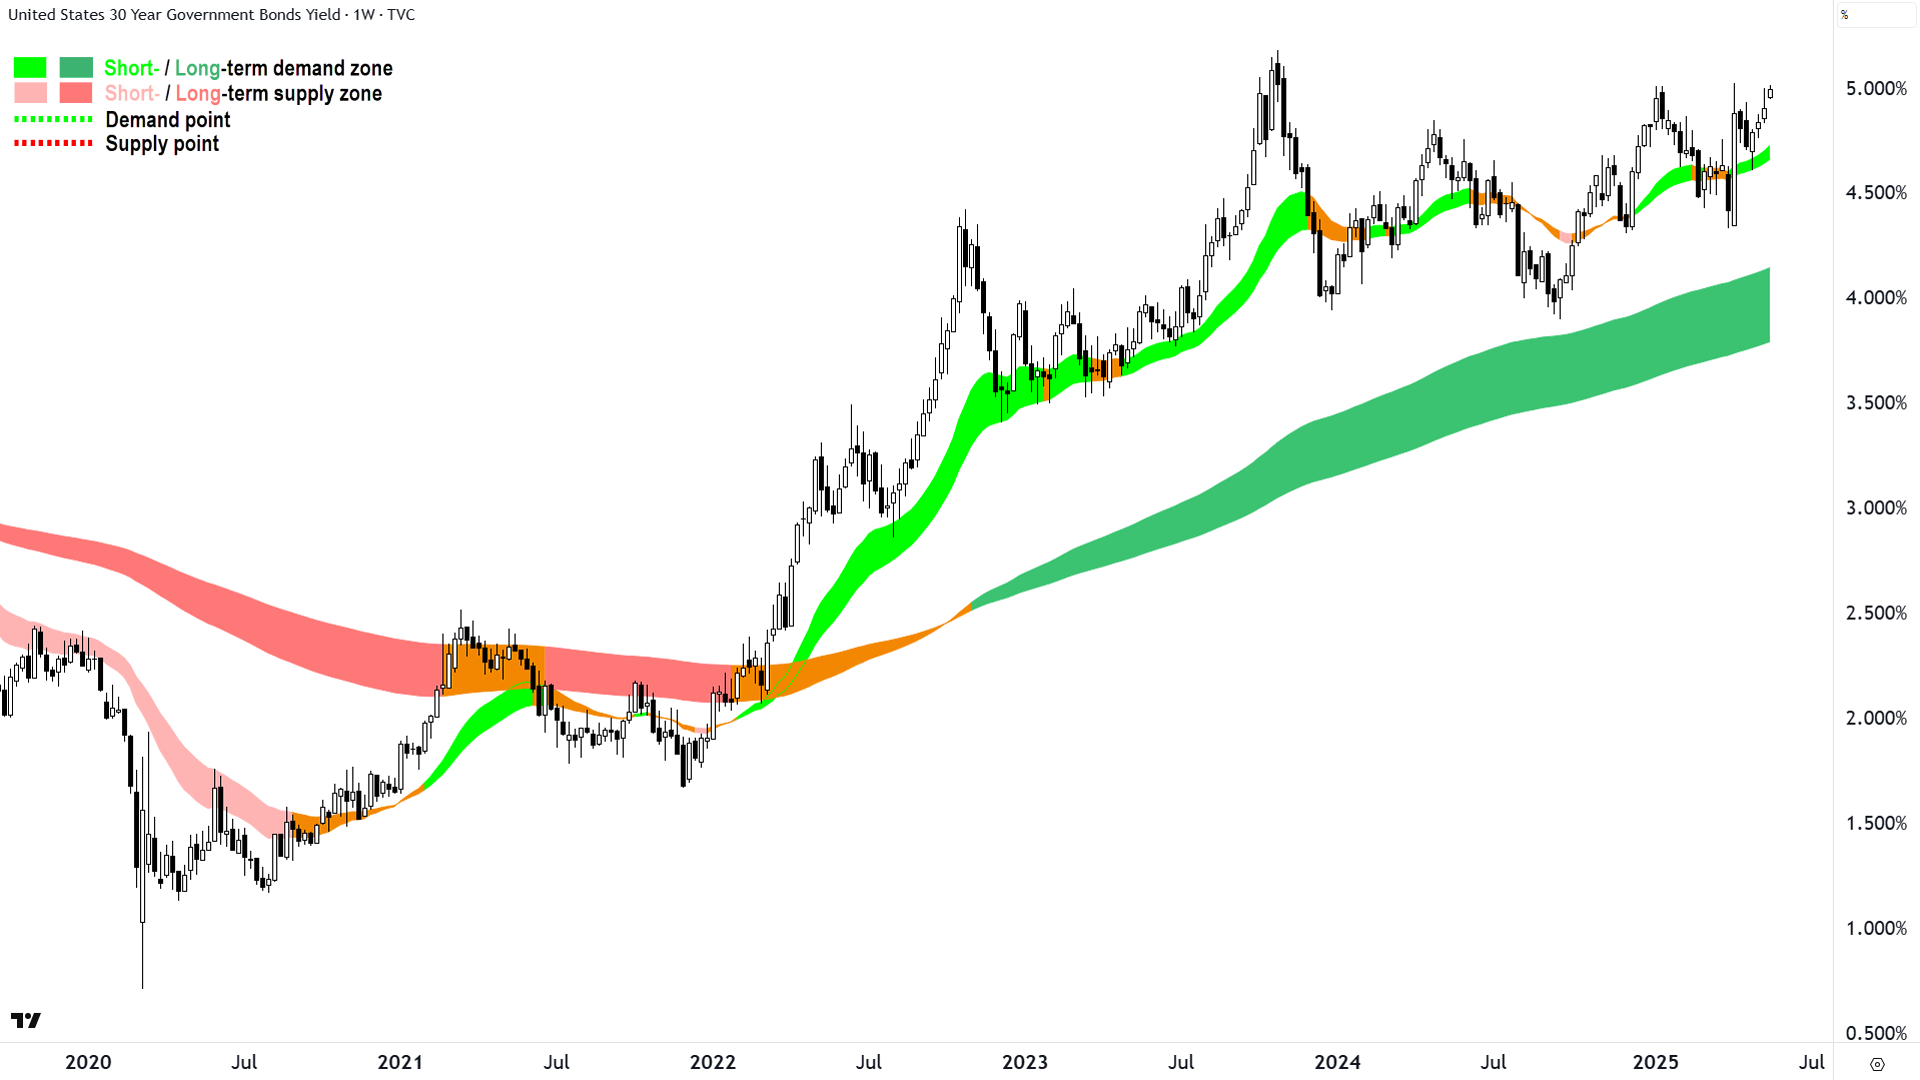
In this regard, check the Comp analysis below for stocks’ reaction. Here I present to you the US risk-free that has so far moved the most, the US 30 Year T-Bond.


US 30 Year T-Bond Yield chart daily chart top and weekly chart bottom (click here for full size image)
The 10’s are up a similar amount in today’s live candle but aren’t nudging pre-GFC highs like the 30’s are. Keep in mind that Americans’ mortgage rates are typically tied to the level of the 30’s. So, that’s not a great thing for US consumer budgets, and therefore for US economic growth (draw a line from growth to stock earnings).
Part of this move is no doubt sprinkled with the more general and pervasive move out of US risk-free assets in favour of European, Japanese, and even local alternatives – although I note that the yields of each of these are also rising today.
The bottom line? Would you buy or sell the above charts? Yep, that's the problem. Rising long term risk-free yields aren’t good for consumers, economies, and rarely – stocks.
The latter, stocks, have enjoyed substantial relief rally gains over the last 6-weeks. We’d love that to continue…but perhaps we’re seeing the first real test in about 6-weeks to that feeling of relief.
ChartWatch
NASDAQ Composite Index

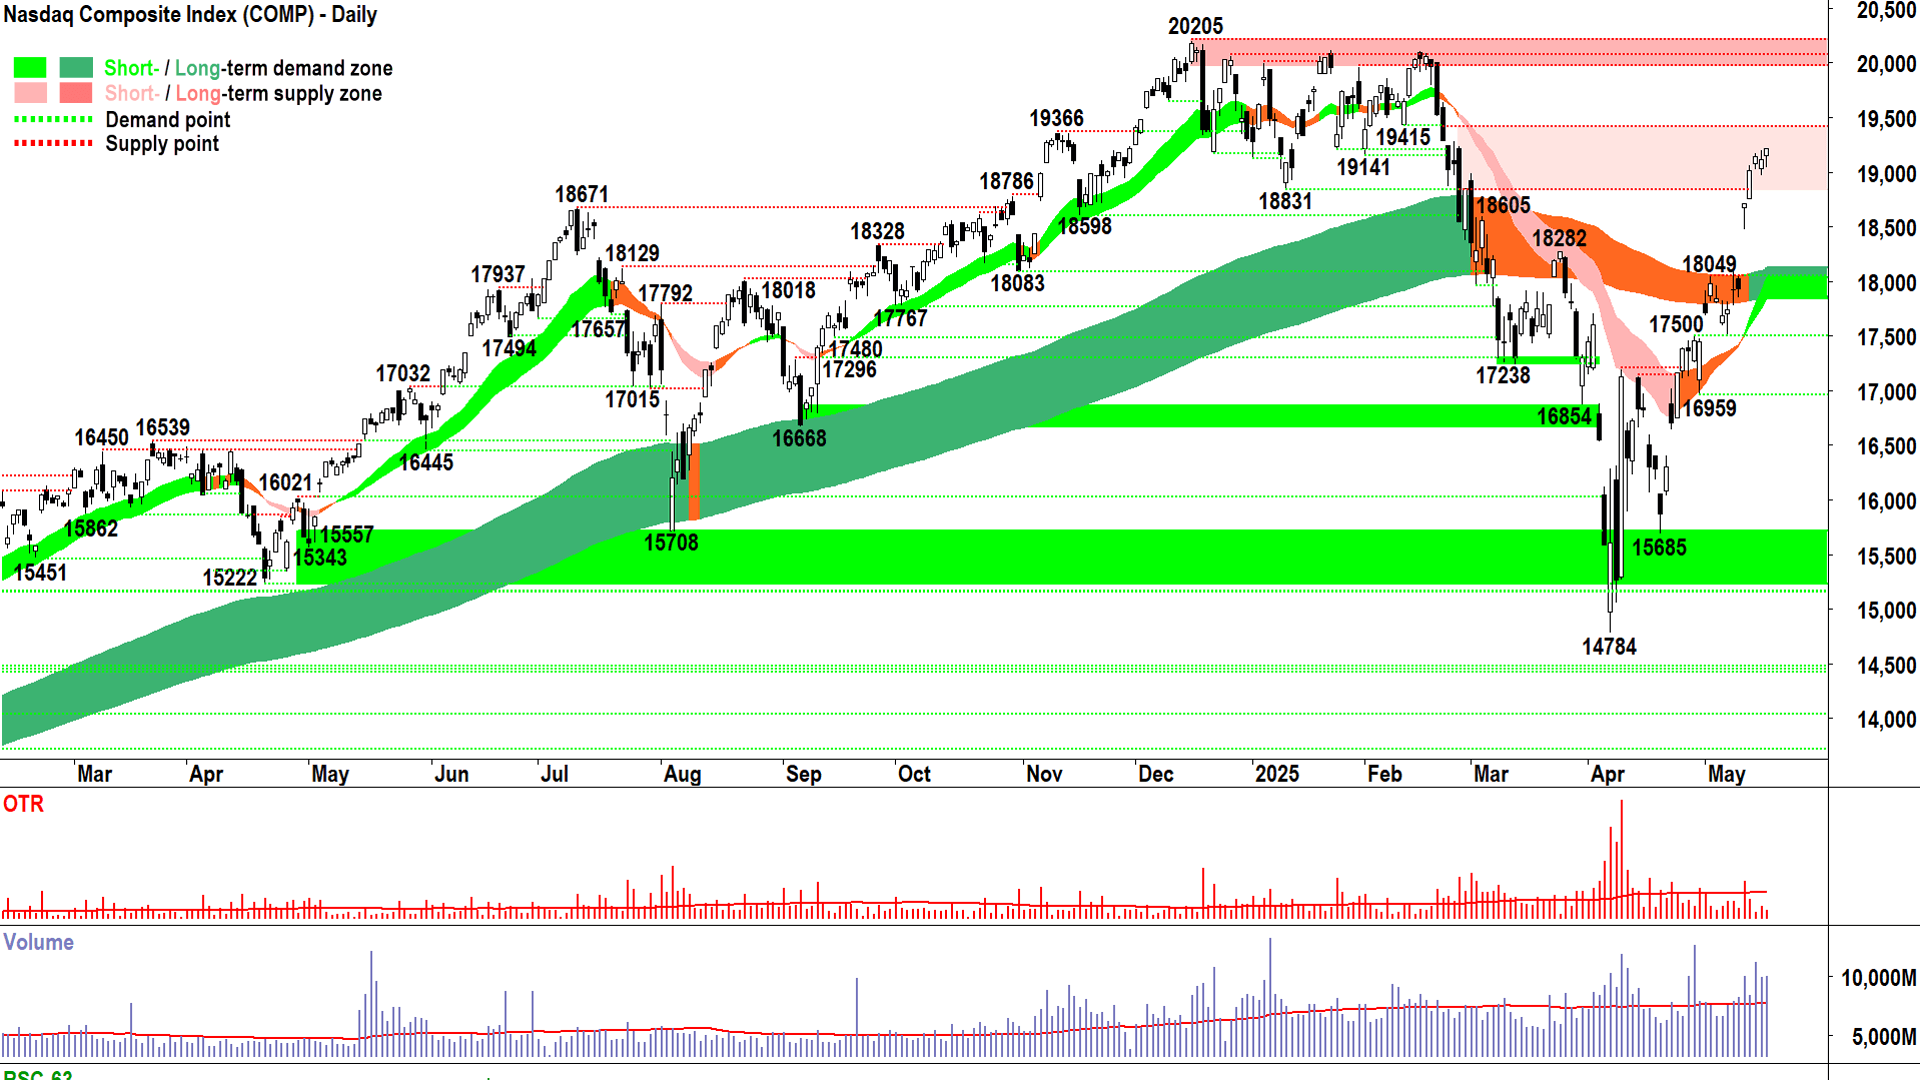
Only demand-side control can be seen 👀 (click here for full size image)
As good as the chart above is, and as indicative it is of total demand-side dominance in the short term – and increasingly in the long term – the Comp is surely destined for its first black candle in over a week by Monday’s close.
As is always the case in technical analysis, we can’t / don’t know what news is about to break to change the demand-supply environment. So, as perfect a showing Friday’s close was of demand-side control, news out after market close that credit ratings agency Moody’s has downgraded America one notch to Aa1 has sent futures lower – down around 1% at the time of writing.
Having said this, Moody’s first downgrade to the US’s trustworthy status as a debtor since 2011 remains yet to be seen. As we have discussed here repeatedly, a little bit of supply in a strong demand-side market is nothing to be feared – it is to be welcomed.
It will give us an opportunity to see just how strong that demand-side is. Do they stand firm and absorb the inevitable supply due at Monday’s opening bell? Even if they do – does the supply side have just too much ammunition to consume this demand and push prices lower anyway – perhaps even to close prices at the low of the session?
White candle and or downward pointing shadow vs black candle and or upward pointing shadow. It’s that simple. And we’ll get the answer tonight.
Volume will also speak to us about engagement – just how much demand and or supply is washing through the system. A big demand-side candle hold on high volume will tell you the supply-side is likely done. New highs here we come!
The opposite, well, then we likely will chip away at the substantial demand I expect is in the system between here and the short-and-long term trend ribbons.
In the meantime, I can only make a call on what I can see – and what I can see is demand-side control. So, as it stands, I have no reason but to suggest staying the course on the Comp.
S&P/ASX 200 (XJO)
%20chart%2019%20May%202025.png)
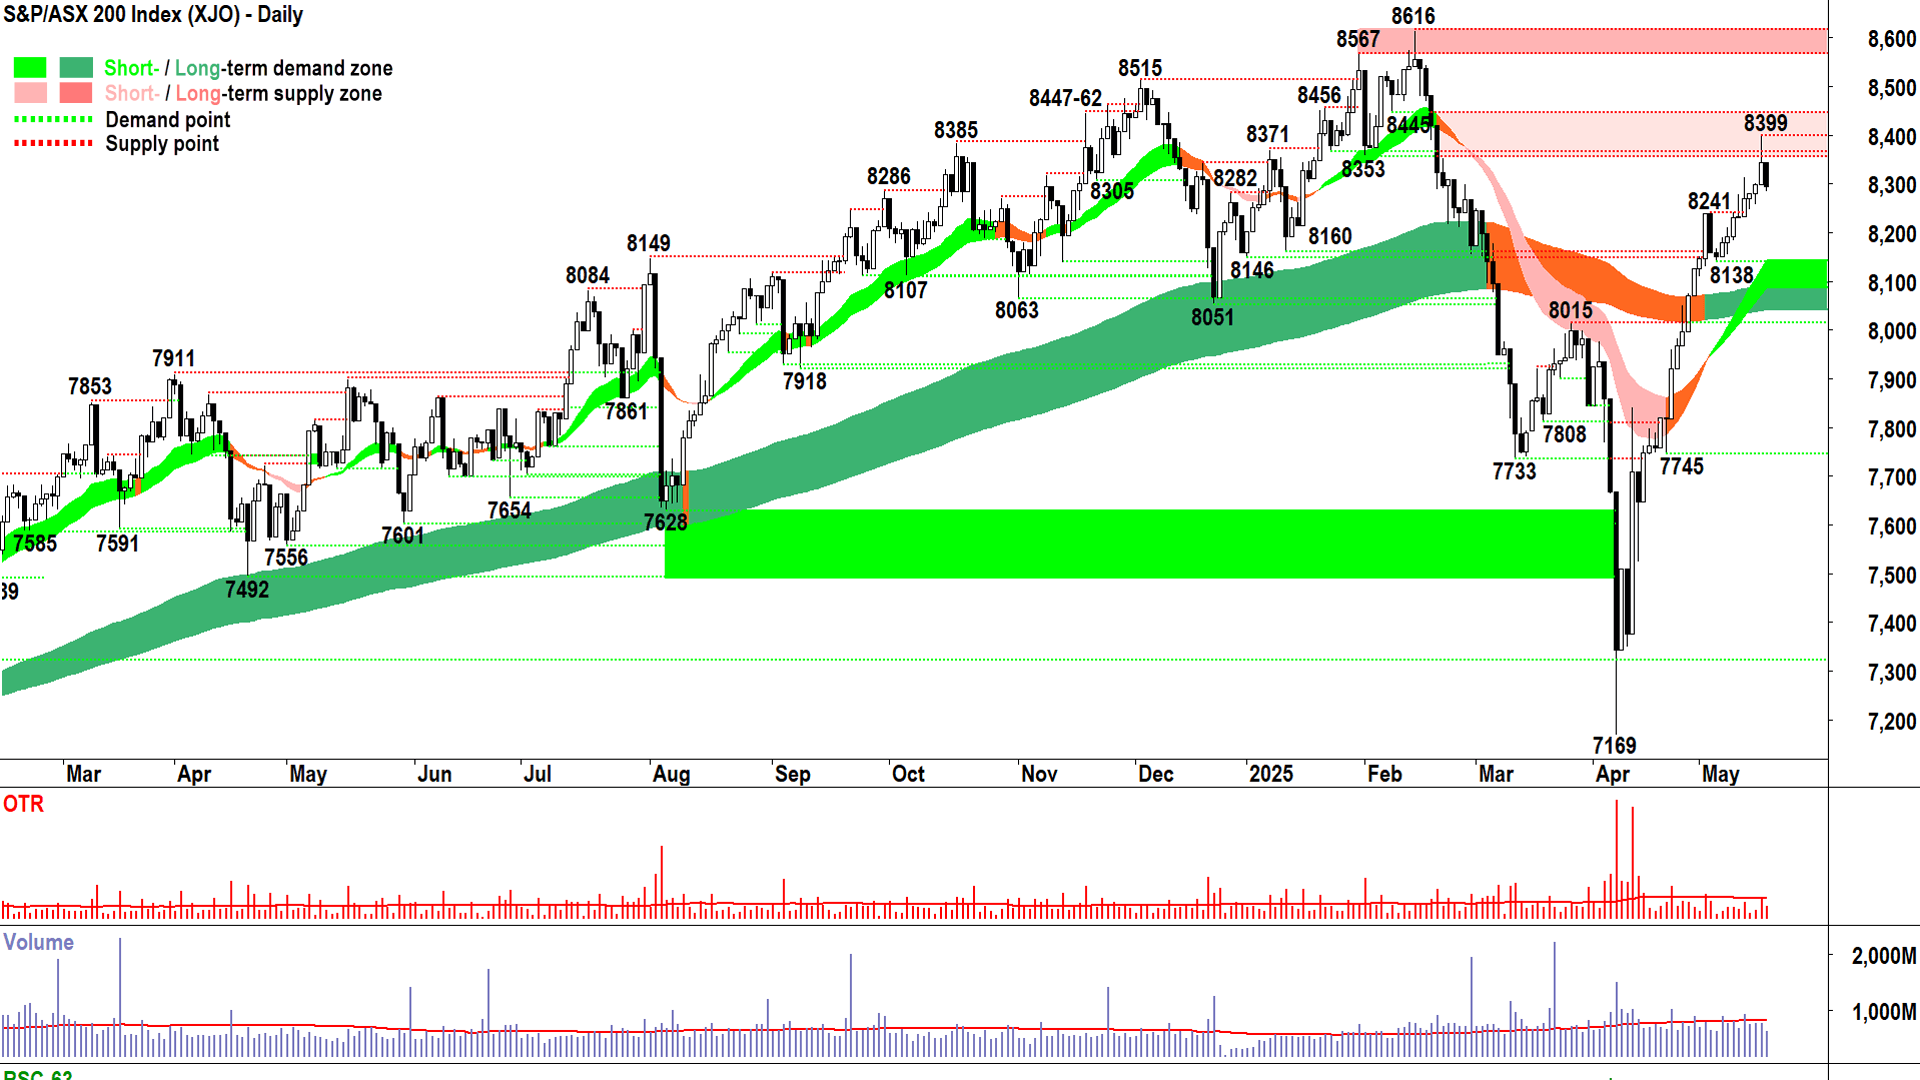
You can feel a little ripped off! 😡 (click here for full size image)
You kind of have to read the Comp analysis to understand why we got today’s candle here on the XJO.
We’re anticipating the response in the US tonight.
Yes, you can feel a little ripped off. We didn’t enjoy that last part of the US’s stunning ascent, yet we appear certain to suffer their pullback. And they haven’t even done it yet!
Putting US anticipated stock moves aside, we were pushing into an expected zone of supply in 8353-8445, anyway. So, Friday’s-and-today’s candle combination of upward pointing shadow and black-bodied follow-through aren’t a major surprise.
They are a credible showing of supply-side strength, however, and they are consistent with how major reversals start – they all must start somewhere – and they often start with exactly those two candles!
But don’t panic! Remember again, that a bit of supply isn’t a total disaster in a double-green uptrend. All important now is how we respond to Friday-Monday’s supply-side duo.
In this regard, I note likely demand around 8241 and into the short-and-long term trend combo. A resumption of demand-side candles quicky in or above that range will steady the ship and likely embolden the demand-side and further subdue the supply-side.
What we don’t want to see, is any really big, species ending event type candles (i.e., long black bodies). They will change everything, and would signal the market is back in a panic phase.
I don’t think this is a very high probability given the current technicals, but after Friday-today’s supply-side showing, I grow more attentive to further signs the supply-side is creeping in to wrestle back control of the XJO’s price.
Gold Futures (Front month, back-adjusted) COMEX
%20COMEX%20chart%2019%20May%202025.png)
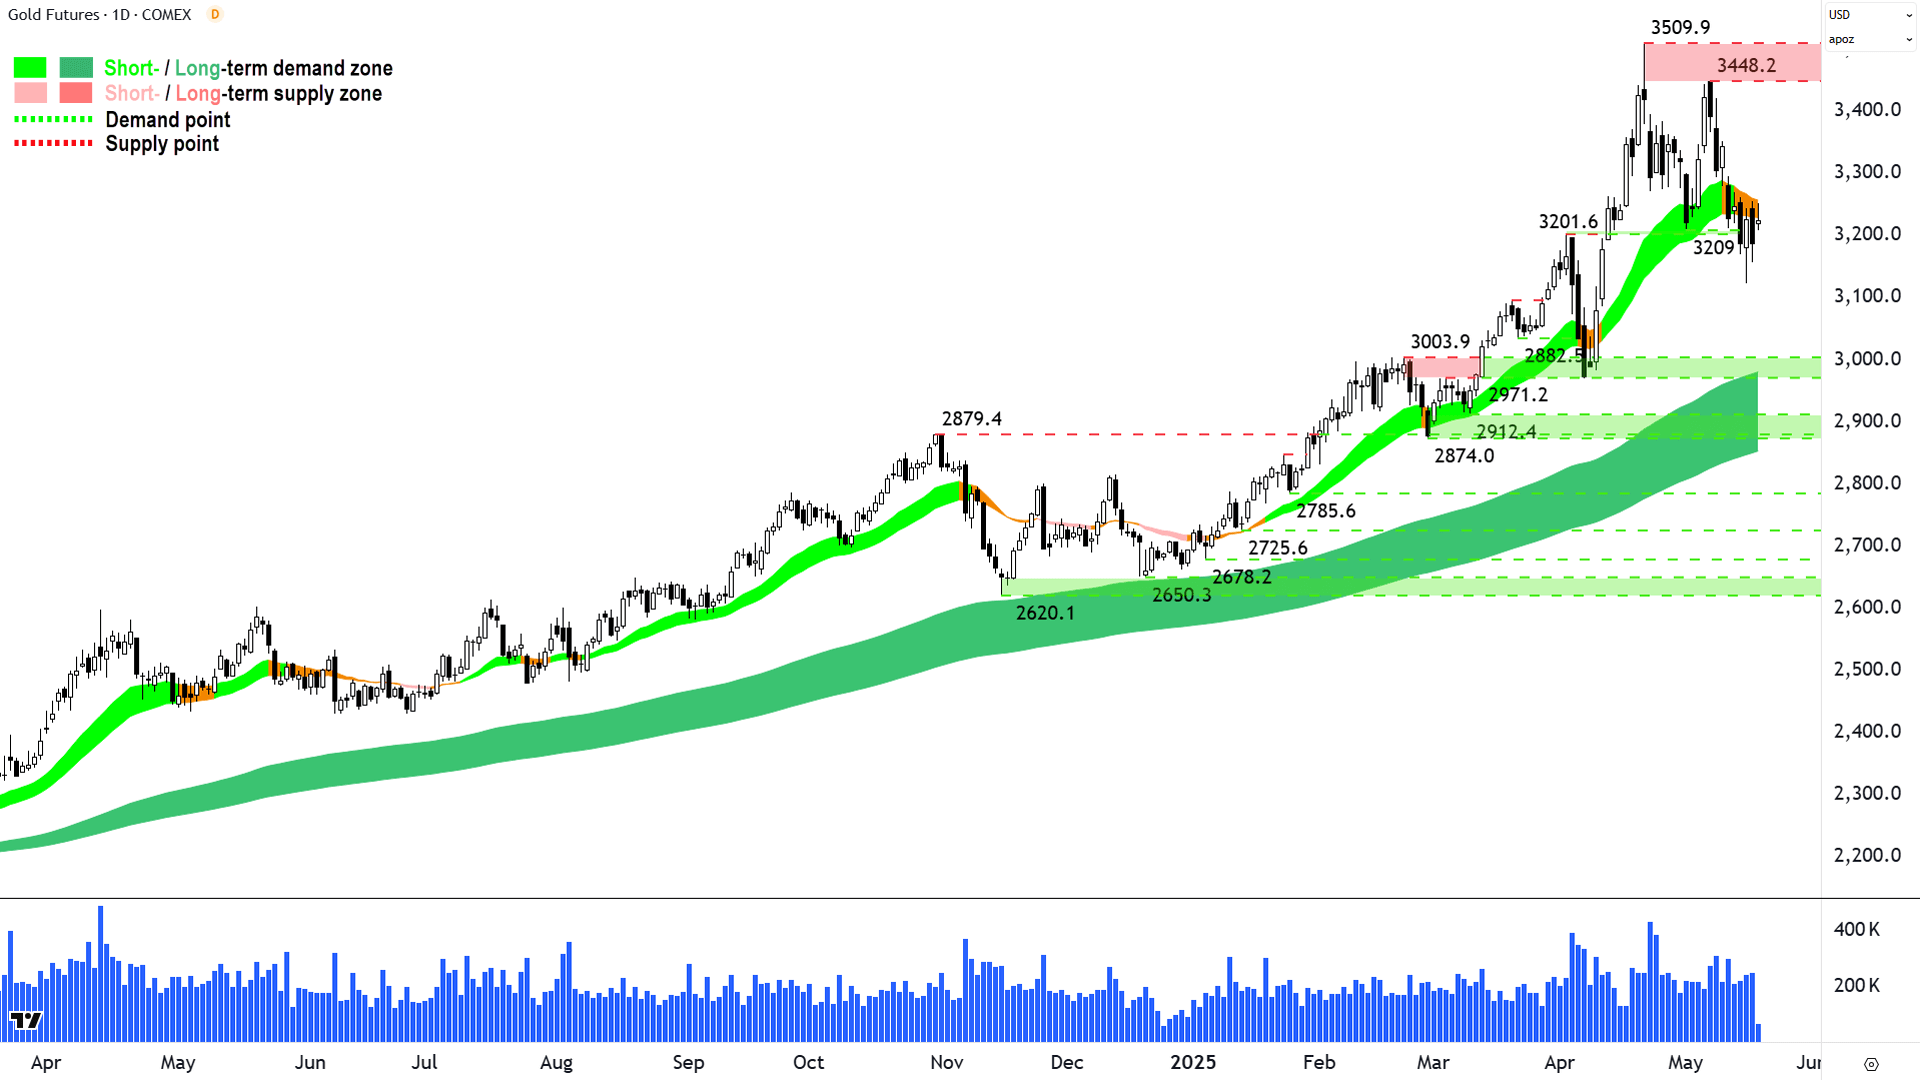
A date with the long term trend ribbon awaits! 💌 (click here for full size image)
Gold seems to be hanging onto the short term trend ribbon by a thread…and perhaps this is a generous conclusion given it has closed below the short term trend ribbon three times in the last three sessions (the last candle is live, so discount it).
I put to you that the short term trend ribbon is behaving more like a zone of dynamic supply than one of dynamic demand – a trait that was so characteristic of the preceding short term uptrend.
Really, only the low of Thursday’s downward pointing shadow (3123.3) stands in the way of total supply-side control. If we close below there, we will set the all-important trough below the short term trend ribbon that confirms the transition to a short term downtrend.
But, as I am prone to do from time to time when circumstances warrant, I jumped the gun and called that transition in our last gold update in ChartWatch in the Evening Wrap on 15 May.
Gold might surprise me and claw its way back above the short term trend ribbon. In that case I will happily concede my error – and it will show gold’s demand-side has some substantial fight left in it yet.
I just don’t see it happening. Nope, I suspect we have a date with the dynamic demand of the long term uptrend ribbon ahead of us here. That trend remains credible, and I have no reason to think that we won’t see a strong demand-side showing there.
Economy
Today
CHN April Data Dump:
New Home Prices m/m: -0.12% m/m vs -0.12% m/m forecast and -0.08% m/m in March
Industrial Production y/y: +6.1% p.a. vs +5.7% p.a. forecast and 7.7% p.a. in March
Retail Sales y/y: +5.1% p.a. vs +6.0% p.a. forecast and 5.9% p.a. in March
Fixed Asset Investment ytd/y: +4.0% ytd/y vs +4.4% ytd/y forecast and +4.2% ytd/y in March
Unemployment Rate: 5.1% vs 5.2% forecast and 5.2% in March
Comment: A bit of a thud back to earth after March's numbers – which to be fair was juiced by front running of Trump's tariffs. Suggest the next few prints from here will tell the real story of the degree of negative impact the trade war is having on the Chinese economy.
Later this week
Tuesday
11:00 CHN 1-year & 5-year Loan Prime Rate (LPR):
1-year LPR: +3.0% p.a. forecast vs +3.10% current
5-year LPR: +3.5% p.a. forecast vs +3.60% current
14:30 AUS Reserve Bank of Australian Official Cash Rate (OCR), Monetary Policy Statement, Press Conference
OCR: 3.85% p.a. forecast vs 4.10% current
Wednesday
10:30 AUS MI Leading Index m/m
Thursday
09:00 AUS Flash Manufacturing Purchasing Managers Index (PMI) May:
Manufacturing: 51.7 in April
Services: 51.0 in April
18:00 EUR Flash Manufacturing PMI:
Manufacturing: 49.3 forecast and 49.0 in April
Services: 50.6 forecast and 50.1 in April
23:45 USA Flash Manufacturing PMI:
Manufacturing: 49.9 forecast and 50.2 in April
Services: 50.7 forecast and 50.8 in April
Friday
00:00 Existing Home Sales April (4.15 million forecast vs 4.02 million in March)
Saturday
00:00 New Home Sales April (696,000 forecast vs 724,000 in March)
Latest News
Interesting Movers
Trading higher
+54.9% Xanadu Mines (XAM) – Recommended A$0.08 Per Share Cash Offer.
+14.7% Electro Optic Systems (EOS) – New Slinger Counter Drone Order for Euro31m (A$53m).
+10.0% Antipa Minerals (AZY) – No news, general strength across the broader Gold sector today, rise is consistent with prevailing long term uptrend 🔎📈
+9.1% Warriedar Resources (WA8) – No news, general strength across the broader Gold sector today, rise is consistent with prevailing short and long term uptrends, a regular in ChartWatch ASX Scans Uptrends list 🔎📈
+6.1% Gorilla Gold Mines (GG8) – Parallel Structure Discovered at Lakeview, general strength across the broader Gold sector today, rise is consistent with prevailing short and long term uptrends, a regular in ChartWatch ASX Scans Uptrends list 🔎📈
+5.2% St Barbara (SBM) – No news, general strength across the broader Gold sector today, rise is consistent with prevailing short and long term uptrends, a recent regular in ChartWatch ASX Scans Uptrends list 🔎📈
+4.7% Peak Rare Earths (PEK) – Continued positive response to 15-May Scheme and Entitlement Offer Presentation.
+3.4% Capricorn Metals (CMM) – No news, general strength across the broader Gold sector today, rise is consistent with prevailing long term uptrend 🔎📈
+3.4% Regis Resources (RRL) – No news, general strength across the broader Gold sector today, rise is consistent with prevailing long term uptrend 🔎📈
+3.4% Pexa Group (PXA) – No news 🤔
+3.2% Evolution Mining (EVN) – No news, general strength across the broader Gold sector today, rise is consistent with prevailing long term uptrend 🔎📈
+3.2% Australian Finance Group (AFG) – No news, rise is consistent with prevailing short and long term uptrends, a regular in ChartWatch ASX Scans Uptrends list 🔎📈
+3.1% Ora Banda Mining (OBM) – No news, general strength across the broader Gold sector today, rise is consistent with prevailing long term uptrend 🔎📈
+2.6% Genesis Minerals (GMD) – No news, general strength across the broader Gold sector today, rise is consistent with prevailing long term uptrend 🔎📈
+2.6% AUB Group (AUB) – No news, rise is consistent with prevailing short and long term uptrends, a recent regular in ChartWatch ASX Scans Uptrends list 🔎📈
+2.6% Spartan Resources (SPR) – No news, general strength across the broader Gold sector today, rise is consistent with prevailing long term uptrend 🔎📈
+2.5% Newmont Corporation (NEM) – No news, general strength across the broader Gold sector today, rise is consistent with prevailing long term uptrend 🔎📈
Trading lower
-25.0% Echoiq (EIQ) – Trading Halt (no indication, just "pending announcement").
-16.6% Liontown Resources (LTR) – No news, general weakness across the broader Lithium sector today, likely unwind of recent speculation/hype around potential corporate action, also possibly due to recent big losses in lithium minerals prices.
-15.8% Appen (APX) – No news, repelled perfectly from long term downtrend ribbon! 🔎📉
-12.8% Clarity Pharmaceuticals (CU6) – No news, fall is consistent with prevailing short and long term downtrends, a regular in ChartWatch ASX Scans Downtrends list 🔎📉
-9.9% Pilbara Minerals (PLS) – No news, general weakness across the broader Lithium sector today, ditto LTR's reaction to recent sharp falls in lithium minerals prices.
-9.5% Koonenberry Gold (KNB) – No news 🤔
-9.0% Novonix (NVX) – No news, general weakness across the broader Battery Materials sector today, repelled perfectly from long term downtrend ribbon! 🔎📉
-8.8% Mineral Resources (MIN) – Appointment of Malcolm Bundey as Director and Chair-elect, general weakness across the broader Lithium sector today, fall is consistent with prevailing long term downtrend 🔎📉
-8.3% Lotus Resources (LOT) – No news, general weakness across the broader Uranium sector today, fall is consistent with prevailing long term downtrend 🔎📉
-8.2% Cettire (CTT) – No news, fall is consistent with prevailing short and long term downtrends, one of the most Featured (highest conviction) stocks in ChartWatch ASX Scans Downtrends list 🔎📉
-8.1% Coronado Global Resources (CRN) – No news, general weakness across the broader Energy sector today, fall is consistent with prevailing short and long term downtrends, one of the most Featured (highest conviction) stocks in ChartWatch ASX Scans Downtrends list 🔎📉
-7.9% WA1 Resources (WA1) – No news, general weakness across the broader Resources sector today.
-7.9% Weebit Nano (WBT) – No news, fall is consistent with prevailing short and long term downtrends, a regular in ChartWatch ASX Scans Downtrends list 🔎📉
-7.7% Champion Iron (CIA) – No news, general weakness across the broader Real Estate sector today, fall is consistent with prevailing short and long term downtrends, a regular in ChartWatch ASX Scans Downtrends list 🔎📉
-7.1% New Hope Corporation (NHC) – No news, general weakness across the broader Energy sector today, fall is consistent with prevailing short and long term downtrends, one of the most Featured (highest conviction) stocks in ChartWatch ASX Scans Downtrends list 🔎📉
Broker Moves
Alcoa Corporation (AAI)
Downgraded to neutral from buy at UBS; Price Target: $50.00
Aristocrat Leisure (ALL)
Retained at add at Morgans; Price Target: $71.00 from $73.00
ANZ Group (ANZ)
Retained at neutral at Citi; Price Target: $27.50
Aspen Group (APZ)
Retained at buy at Bell Potter; Price Target: $3.05
Alliance Aviation Services (AQZ)
Retained at buy at Ord Minnett; Price Target: $3.70
Aurizon (AZJ)
Retained at buy at Goldman Sachs; Price Target: $3.60 from $3.70
Brightstar Resources (BTR)
Retained at speculative buy at Canaccord Genuity; Price Target: $1.500 from $2.00
Commonwealth Bank of Australia (CBA)
Retained at sell at Citi; Price Target: $100.00
Charter Hall Retail Reit (CQR)
Retained at buy at Citi; Price Target: $4.00
Cedar Woods Properties (CWP)
Retained at buy at Bell Potter; Price Target: $7.30
Dexus (DXS)
Retained at underweight at Morgan Stanley; Price Target: $7.75
Fletcher Building (FBU)
Retained at neutral at E&P; Price Target: $2.83
Retained at underperform at Macquarie; Price Target: NZ$1.85 from NZ$1.95
Retained at neutral at UBS; Price Target: NZ$3.40
Goodman Group (GMG)
Retained at buy at Citi; Price Target: $40.00
GPT Group (GPT)
Retained at buy at Citi; Price Target: $5.00
Retained at overweight at Morgan Stanley; Price Target: $5.67
HMC Capital (HMC)
Retained at buy at Bell Potter; Price Target: $8.15
Initiated at buy at Jefferies; Price Target: $7.62
Insurance Australia Group (IAG)
Retained at outperform at Macquarie; Price Target: $8.50
James Hardie Industries (JHX)
Retained at neutral at Macquarie; Price Target: $40.20
Monadelphous Group (MND)
Retained at add at Morgans; Price Target: $19.50 from $17.50
National Australia Bank (NAB)
Retained at sell at Citi; Price Target: $30.50
Navigator Global Investments (NGI)
Retained at buy at Ord Minnett; Price Target: $2.65 from $2.50
Nufarm (NUF)
Retained at sell at Citi; Price Target: $3.75
Orora (ORA)
Retained at hold at Morgans; Price Target: $2.03 from $2.32
Retained at neutral at UBS; Price Target: $2.10 from $2.40
Propel Funeral Partners (PFP)
Retained at outperform at Macquarie; Price Target: $6.65
Praemium (PPS)
Initiated at buy at Bell Potter; Price Target: $1.000
REA Group (REA)
Retained at neutral at Macquarie; Price Target: $265.00
Resolute Mining (RSG)
Retained at outperform at Macquarie; Price Target: $0.650 from $0.550
Scentre Group (SCG)
Retained at buy at Citi; Price Target: $3.90
Sandfire Resources (SFR)
Retained at neutral at Citi; Price Target: $11.00 from $10.50
SGH (SGH)
Retained at outperform at Macquarie; Price Target: $56.10
Suncorp Group (SUN)
Retained at neutral at Macquarie; Price Target: $19.20
Temple & Webster Group (TPW)
Retained at hold at Bell Potter; Price Target: $21.00 from $15.60
Vicinity Centres (VCX)
Retained at neutral at Citi; Price Target: $2.40
Westpac Banking Corporation (WBC)
Retained at sell at Citi; Price Target: $27.75
WEB Travel Group (WEB)
Retained at buy at Ord Minnett; Price Target: $8.30 from $6.79
Xero (XRO)
Retained at buy at Citi; Price Target: $210.00 from $200.00
Scans
Top Gainers
Code | Company | Last | % Chg |
|---|---|---|---|
| CHRCA | Charger Metals NL | $0.015 | +66.67% |
| XAM | Xanadu Mines Ltd | $0.079 | +54.90% |
| NSX | NSX Ltd | $0.033 | +50.00% |
| LDR | Lode Resources Ltd | $0.16 | +23.08% |
| MGA | Metalsgrove Mining Ltd | $0.061 | +22.00% |
Top Fallers
Code | Company | Last | % Chg |
|---|---|---|---|
| HMD | Heramed Ltd | $0.012 | -36.84% |
| EIQ | Echoiq Ltd | $0.24 | -25.00% |
| HPR | High Peak Royalties Ltd | $0.047 | -21.67% |
| ATX | Amplia Therapeutics Ltd | $0.051 | -21.54% |
| C1X | Cosmos Exploration Ltd | $0.055 | -21.43% |
52 Week Highs
Code | Company | Last | % Chg |
|---|---|---|---|
| LDR | Lode Resources Ltd | $0.16 | +23.08% |
| FRS | Forrestania Resources Ltd | $0.075 | +20.97% |
| WWI | West Wits Mining Ltd | $0.024 | +14.29% |
| RMI | Resource Mining Corporation Ltd | $0.026 | +13.04% |
| ESK | Etherstack Plc | $0.36 | +12.50% |
52 Week Lows
Code | Company | Last | % Chg |
|---|---|---|---|
| HMD | Heramed Ltd | $0.012 | -36.84% |
| HPR | High Peak Royalties Ltd | $0.047 | -21.67% |
| T92 | Terra Uranium Ltd | $0.025 | -16.67% |
| IVX | Invion Ltd | $0.081 | -14.74% |
| SPD | Southern Palladium Ltd | $0.195 | -13.33% |
Near Highs
Code | Company | Last | % Chg |
|---|---|---|---|
| PCI | Perpetual Credit Income Trust | $1.19 | 0.00% |
| WVOL | Ishares MSCI World Ex Aust Minimum Volatility ETF | $44.26 | +0.87% |
| IAGPF | Insurance Australia Group Ltd | $104.27 | +0.07% |
| GCI | Gryphon Capital Income Trust | $2.05 | 0.00% |
| IHD | Ishares S&P/ASX DIV Opportunities Esg Screened ETF | $14.74 | -0.87% |
Relative Strength Index (RSI) Oversold
Code | Company | Last | % Chg |
|---|---|---|---|
| AVH | Avita Medical Inc | $2.05 | +1.99% |
| NWSLV | News Corporation | $41.40 | 0.00% |
| AOF | Australian Unity Office Fund | $0.485 | 0.00% |
| SKC | Skycity Entertainment Group Ltd | $0.905 | -2.16% |
| LTP | LTR Pharma Ltd | $0.28 | -8.20% |
