News | Market Wraps
Evening Wrap: ASX 200's fourth-straight loss as banks dip, iron ore and lithium stocks' woes continue
The S&P/ASX 200 closed 18.2 points lower, down 0.21%.

Mentioned
The S&P/ASX 200 closed 18.2 points lower, down 0.21%.
It was another tough day for iron ore and lithium stocks today as investors weighed the prospects for lower commodity prices for both sectors. Elsewhere in resources, the alternating fortunes of gold and uranium stocks continued, with the "golds" rebounding and the "uraniums" pulling back.
But as interesting as the gyrations were in the Resources sector, and in spite of generally strong performances across the rest of the Aussie stock market today – it was a pullback in heavily index-weighted banking shares that set in stone today's fourth loss in a row.
To make sense of all the above, I have detailed technical analysis on the Nasdaq Composite, S&P/ASX 200, and Iron Ore and Lithium in today's ChartWatch.
Be sure to click/scroll through for the usual reporting of the major sector and stock-specific moves, the broker responses to them, as well as all the key economic data in tonight's Evening Wrap.
Let's dive in!
Today in Review
Fri 20 Jun 25, 5:12pm (AEST)
Name | Value | % Chg |
|---|---|---|
Major Indices | ||
| ASX 200 | 8,505.5 | -0.21% |
| All Ords | 8,723.5 | -0.20% |
| Small Ords | 3,223.0 | +0.19% |
| All Tech | 3,997.5 | -0.07% |
| Emerging Companies | 2,253.2 | +0.23% |
Currency | ||
| AUD/USD | 0.648 | -0.03% |
US Futures | ||
| S&P 500 | 5,968.0 | -0.23% |
| Dow Jones | 42,036.0 | -0.36% |
| Nasdaq | 21,700.0 | -0.09% |
Name | Value | % Chg |
|---|---|---|
Sector | ||
| Utilities | 9,436.0 | +0.74% |
| Industrials | 8,458.6 | +0.62% |
| Health Care | 41,596.3 | +0.58% |
| Information Technology | 2,939.9 | +0.50% |
| Energy | 9,083.6 | +0.05% |
| Real Estate | 3,985.6 | -0.05% |
| Materials | 15,702.6 | -0.17% |
| Communication Services | 1,846.5 | -0.43% |
| Financials | 9,314.2 | -0.60% |
| Consumer Discretionary | 4,102.1 | -0.63% |
| Consumer Staples | 12,393.0 | -0.87% |
Markets
%20intraday%20chart%2020%20Jun%202025.png)
ASX 200 Session Chart
The S&P/ASX 200 (XJO) finished 18.2 points lower at 8,505.5, 0.51% from its session low and just 0.25% from its high. In terms of market breadth, the broader-based S&P/ASX 300 (XKO) indicated slightly better than the benchmark’s loss, with advancers beat decliners by 139 to 133. For the week, the XJO finished down 41.9 points or 0.49% lower, 0.87% from its intraweek high and 0.51% from its intraweek low.
Sure, the benchmark ASX 200 was down today, but only four of the 12 major sector indices were down. The main issue is that one of those was the Financials (XFJ) (-0.61%) – and it’s the one with the greatest clout with respect to index points! Take out ANZ Group's (ANZ) (-2.5%) loss for example, and we'd be a long way back to at least breakeven on the day.
Of the 8 sectors that did prosper, Utilities (XUJ) (+0.74%) was the best, but Industrials (XNJ) (+0.62%), Gold (XGD) (+0.62%), Healthcare (XHJ) (+0.58%), and Information Technology (XIJ) (0.50%) all enjoyed very similar gains.
Before you get all down on the big banks and insurers, today is an exception to the recent norm. If anything, it’s been the Financials that have saved our ass-ets over the last few days of Middle East worry. So, today’s changing of the guard is not such a bad thing, because if the gains start to be shared among the other sectors, this is typically a good sign of broad-based confidence in Aussie stocks 🤞.
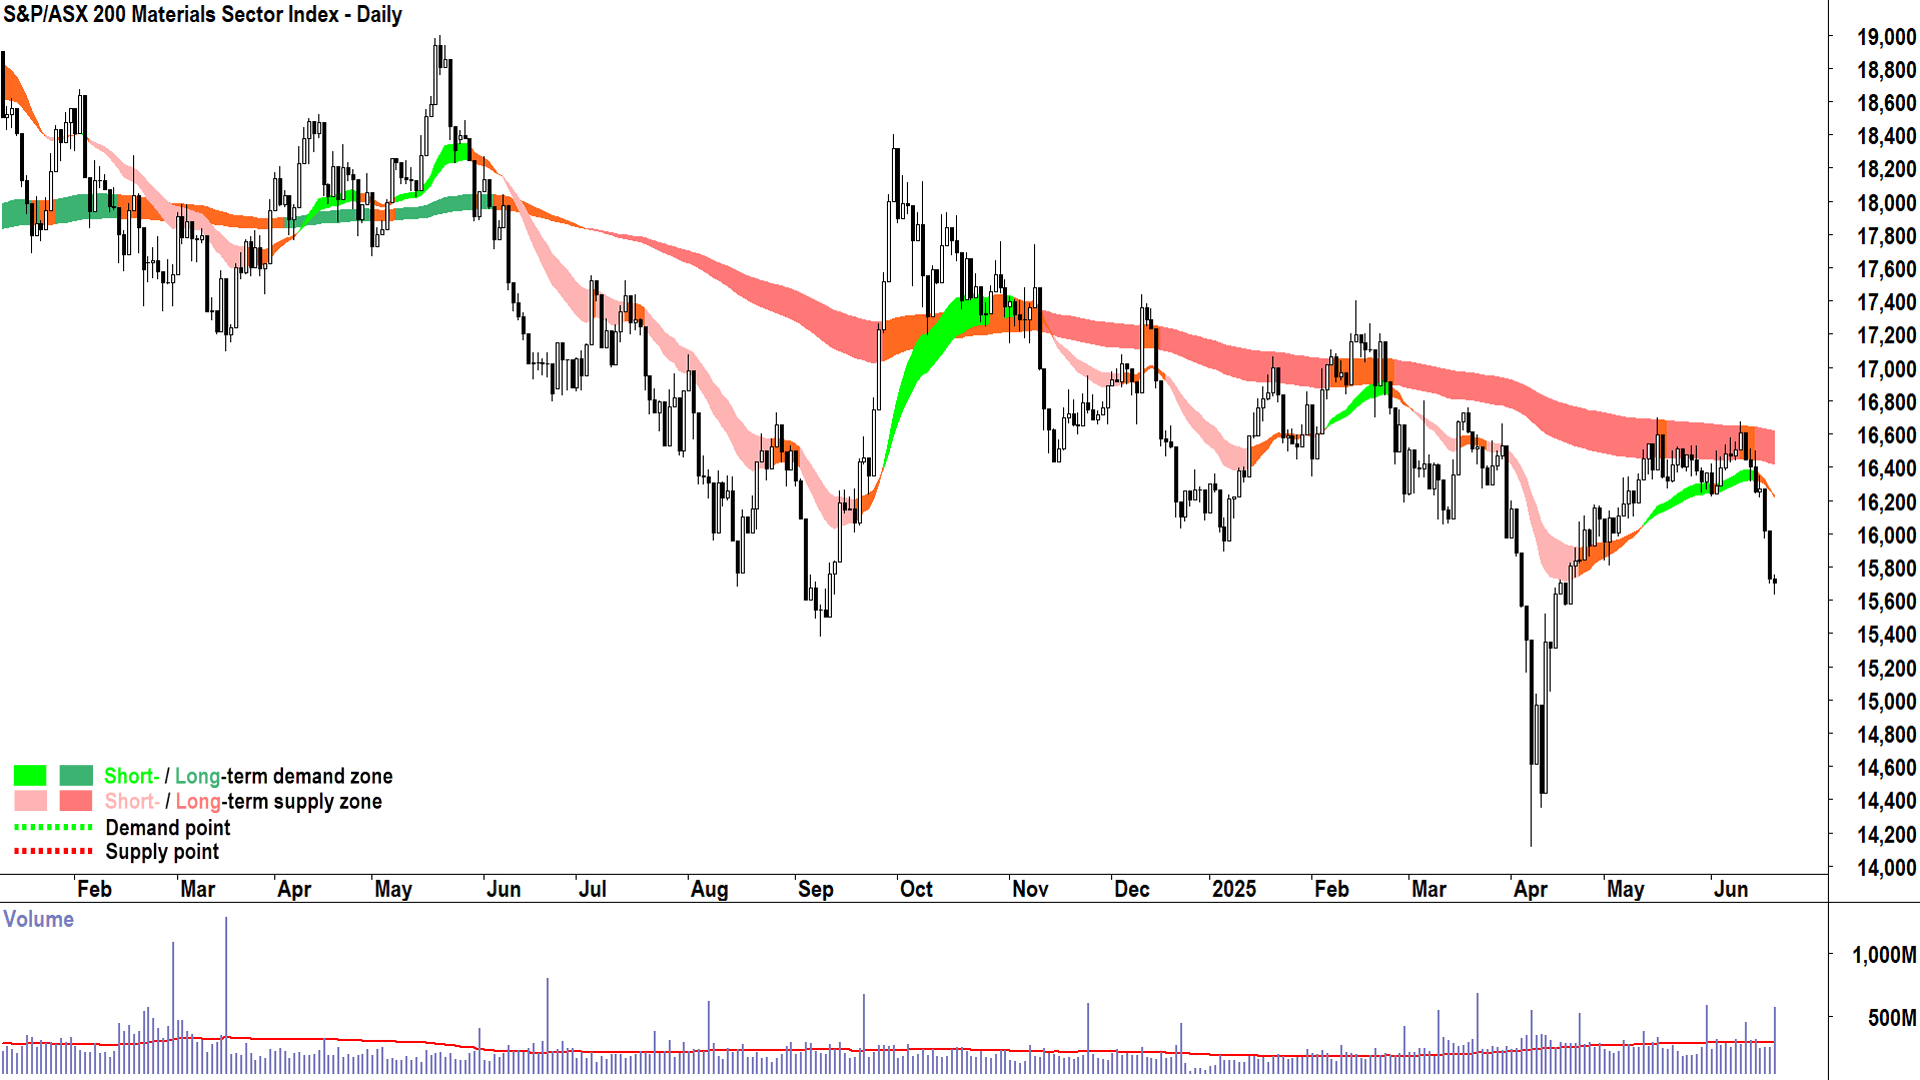
If there is one festering sore that continues to undermine the ASX 200's chances of climbing the Middle East wall of worry, it's the Materials (XMJ) (-0.17%) sector. BHP Group's (BHP) (+0.22%) gain and a bounce in the gold majors (Northern Star Resources (NST) (+0.69%), Newmont (NEM) (+0.3%), Evolution Mining (EVN) (+0.51%)) likely limited the damage in the XMJ today, but since Energy stocks have bolted higher, its chart stands out now as the worst of the majors.

ASX200 Resources Sector Index (XJR) (click here for full size image)
I have more on iron ore (which apart from BHP, stocks in the sector were hit again today), and lithium (also hit today) in tonight's ChartWatch below. It would be great if all of the sectors went up at the same time, but in my experience this is the exception, not the norm. The big funds love to play their favourites, and right now, mining and materials stocks are not high on their shopping list.
Today's Blue-chip winners:
Company | Last Price | Change $ | Change % | 1mo % | 1yr % |
|---|---|---|---|---|---|
Brambles (BXB) | $24.56 | +$0.86 | +3.6% | +12.0% | +69.1% |
Cochlear (COH) | $295.64 | +$7.21 | +2.5% | +8.6% | -11.0% |
Steadfast Group (SDF) | $6.01 | +$0.14 | +2.4% | +2.4% | +7.9% |
APA Group (APA) | $8.73 | +$0.19 | +2.2% | +5.8% | +3.8% |
Reliance Worldwide (RWC) | $4.23 | +$0.07 | +1.7% | -5.8% | -10.9% |
Hub24 (HUB) | $82.05 | +$1.26 | +1.6% | +1.5% | +83.3% |
The Lottery Corporation (TLC) | $5.31 | +$0.08 | +1.5% | +0.2% | +2.6% |
Cleanaway Waste Management (CWY) | $2.77 | +$0.04 | +1.5% | +3.0% | +1.1% |
Resmed Inc (RMD) | $39.16 | +$0.54 | +1.4% | +1.3% | +22.9% |
Fisher & Paykel Healthcare (FPH) | $34.22 | +$0.42 | +1.2% | +1.1% | +18.4% |
Qantas Airways (QAN) | $10.27 | +$0.12 | +1.2% | +0.6% | +70.4% |
The A2 Milk Company (A2M) | $8.27 | +$0.09 | +1.1% | +2.1% | +22.5% |
Pro Medicus (PME) | $276.81 | +$2.73 | +1.0% | -2.1% | +107.3% |
Endeavour Group (EDV) | $4.06 | +$0.04 | +1.0% | -0.5% | -20.5% |
Xero (XRO) | $193.77 | +$1.89 | +1.0% | +6.6% | +48.6% |
Flight Centre Travel (FLT) | $12.38 | +$0.12 | +1.0% | -7.0% | -37.9% |
Seek (SEK) | $23.99 | +$0.22 | +0.9% | +1.3% | +4.7% |
Insurance Australia Group (IAG) | $9.03 | +$0.08 | +0.9% | +6.0% | +34.8% |
Treasury Wine Estates (TWE) | $8.21 | +$0.07 | +0.9% | -3.9% | -32.0% |
Woodside Energy (WDS) | $25.85 | +$0.22 | +0.9% | +18.9% | -4.0% |
Today's Blue-chip losers:
Company | Last Price | Change $ | Change % | 1mo % | 1yr % |
|---|---|---|---|---|---|
Mineral Resources (MIN) | $20.69 | -$1.36 | -6.2% | -12.0% | -66.3% |
Pilbara Minerals (PLS) | $1.230 | -$0.065 | -5.0% | -9.9% | -62.3% |
IGO (IGO) | $3.90 | -$0.15 | -3.7% | -4.2% | -35.5% |
Computershare (CPU) | $39.26 | -$1.42 | -3.5% | -3.5% | +44.7% |
ANZ Group (ANZ) | $28.39 | -$0.74 | -2.5% | -1.6% | -2.9% |
IDP Education (IEL) | $3.67 | -$0.09 | -2.4% | -56.3% | -76.3% |
Coles Group (COL) | $21.49 | -$0.49 | -2.2% | -1.3% | +24.6% |
Sigma Healthcare (SIG) | $3.14 | -$0.07 | -2.2% | +2.3% | +159.5% |
Bluescope Steel (BSL) | $22.46 | -$0.44 | -1.9% | -5.1% | +10.4% |
Macquarie Group (MQG) | $208.88 | -$4.02 | -1.9% | -0.7% | +6.8% |
Life360 (360) | $31.94 | -$0.57 | -1.8% | +1.2% | +102.2% |
Wesfarmers (WES) | $83.24 | -$1.32 | -1.6% | -1.0% | +23.0% |
Viva Energy Group (VEA) | $2.07 | -$0.03 | -1.4% | +7.0% | -35.9% |
Bank of Queensland (BOQ) | $7.79 | -$0.11 | -1.4% | +0.9% | +32.5% |
Paladin Energy (PDN) | $7.36 | -$0.1 | -1.3% | +29.4% | -45.3% |
Rio Tinto (RIO) | $102.17 | -$1.38 | -1.3% | -14.5% | -14.3% |
JB HI-FI (JBH) | $108.70 | -$1.27 | -1.2% | +0.9% | +70.3% |
Westpac Banking Corp. (WBC) | $33.21 | -$0.38 | -1.1% | +5.2% | +22.0% |
Scentre Group (SCG) | $3.60 | -$0.04 | -1.1% | -2.4% | +15.8% |
AGL Energy (AGL) | $10.08 | -$0.11 | -1.1% | -2.2% | -3.3% |
ChartWatch
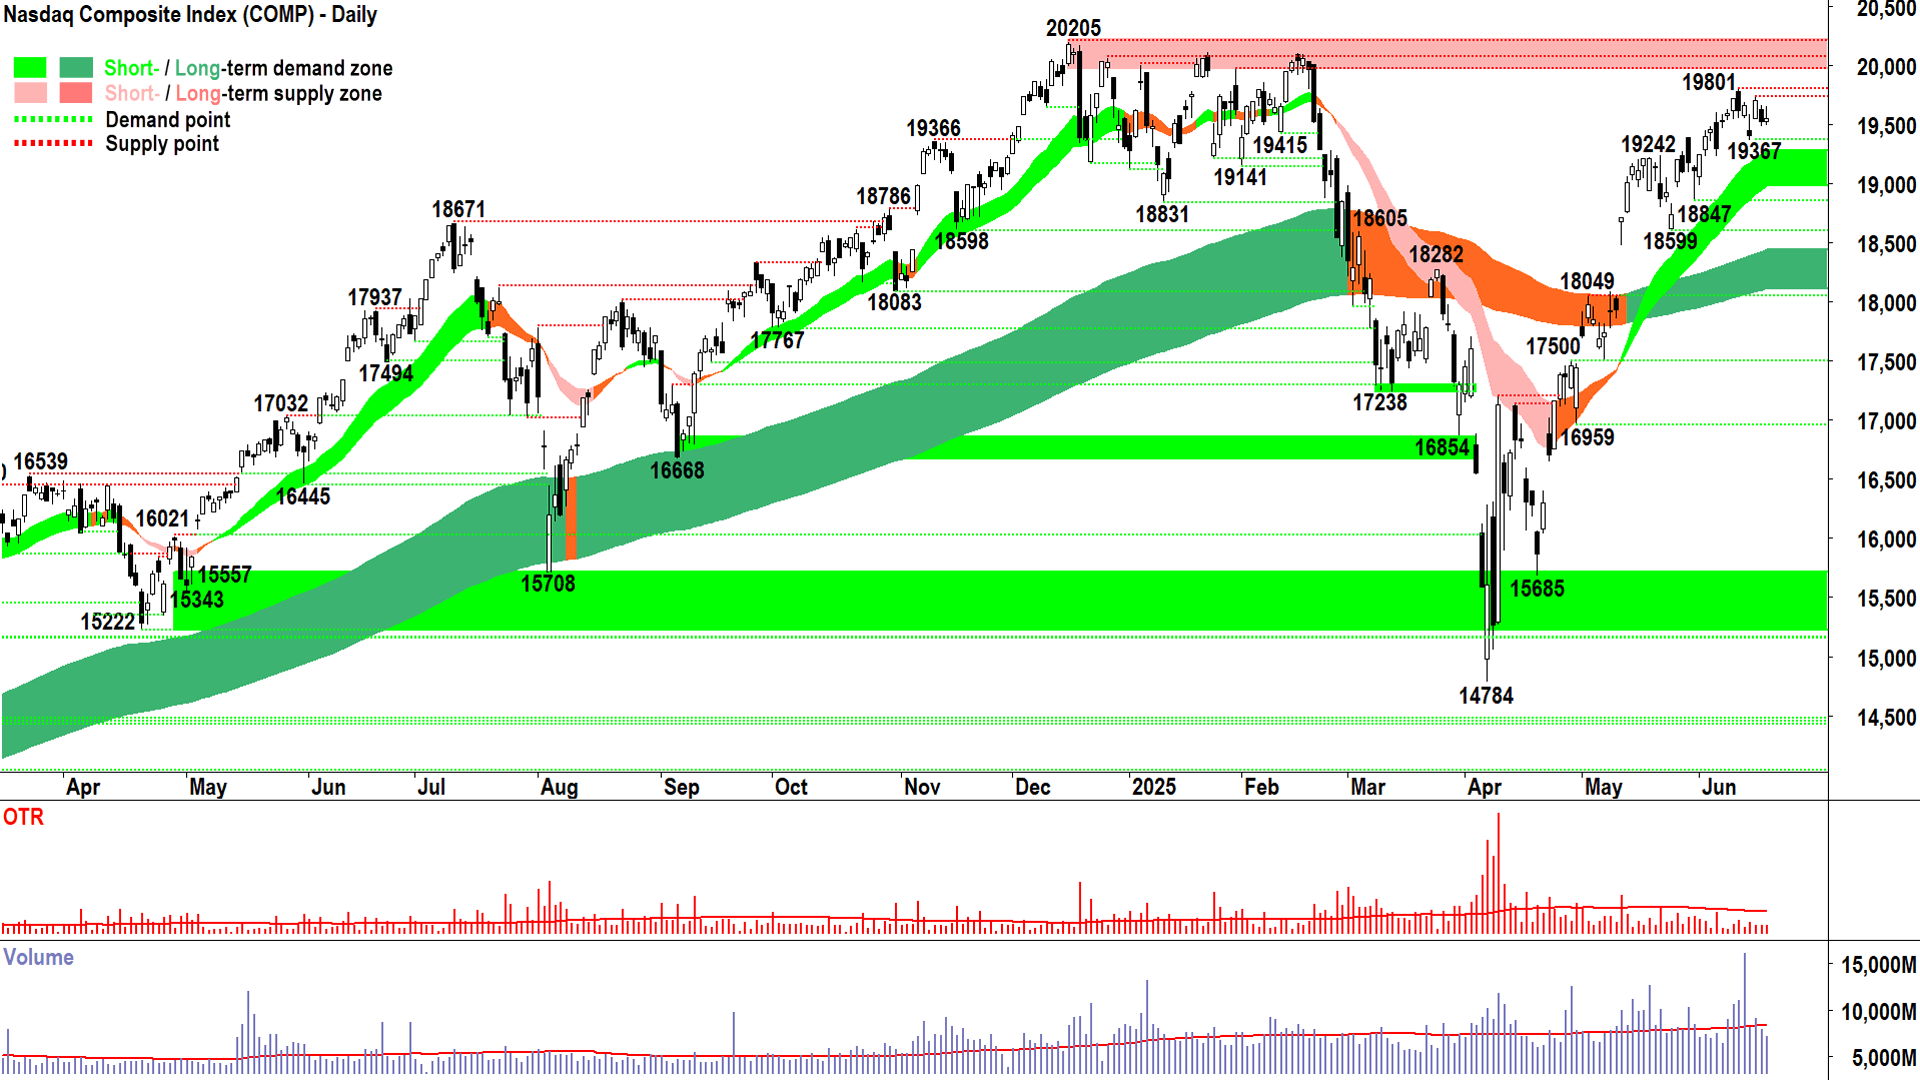
NASDAQ Composite Index

On pause, resumes tonight! ⏯️. As always! (click here for full size image)
US stock markets were closed Thursday, so refer to yesterday's analysis. Comp futures are down around 0.2% at the time of writing, but were down over 1% at times overnight.
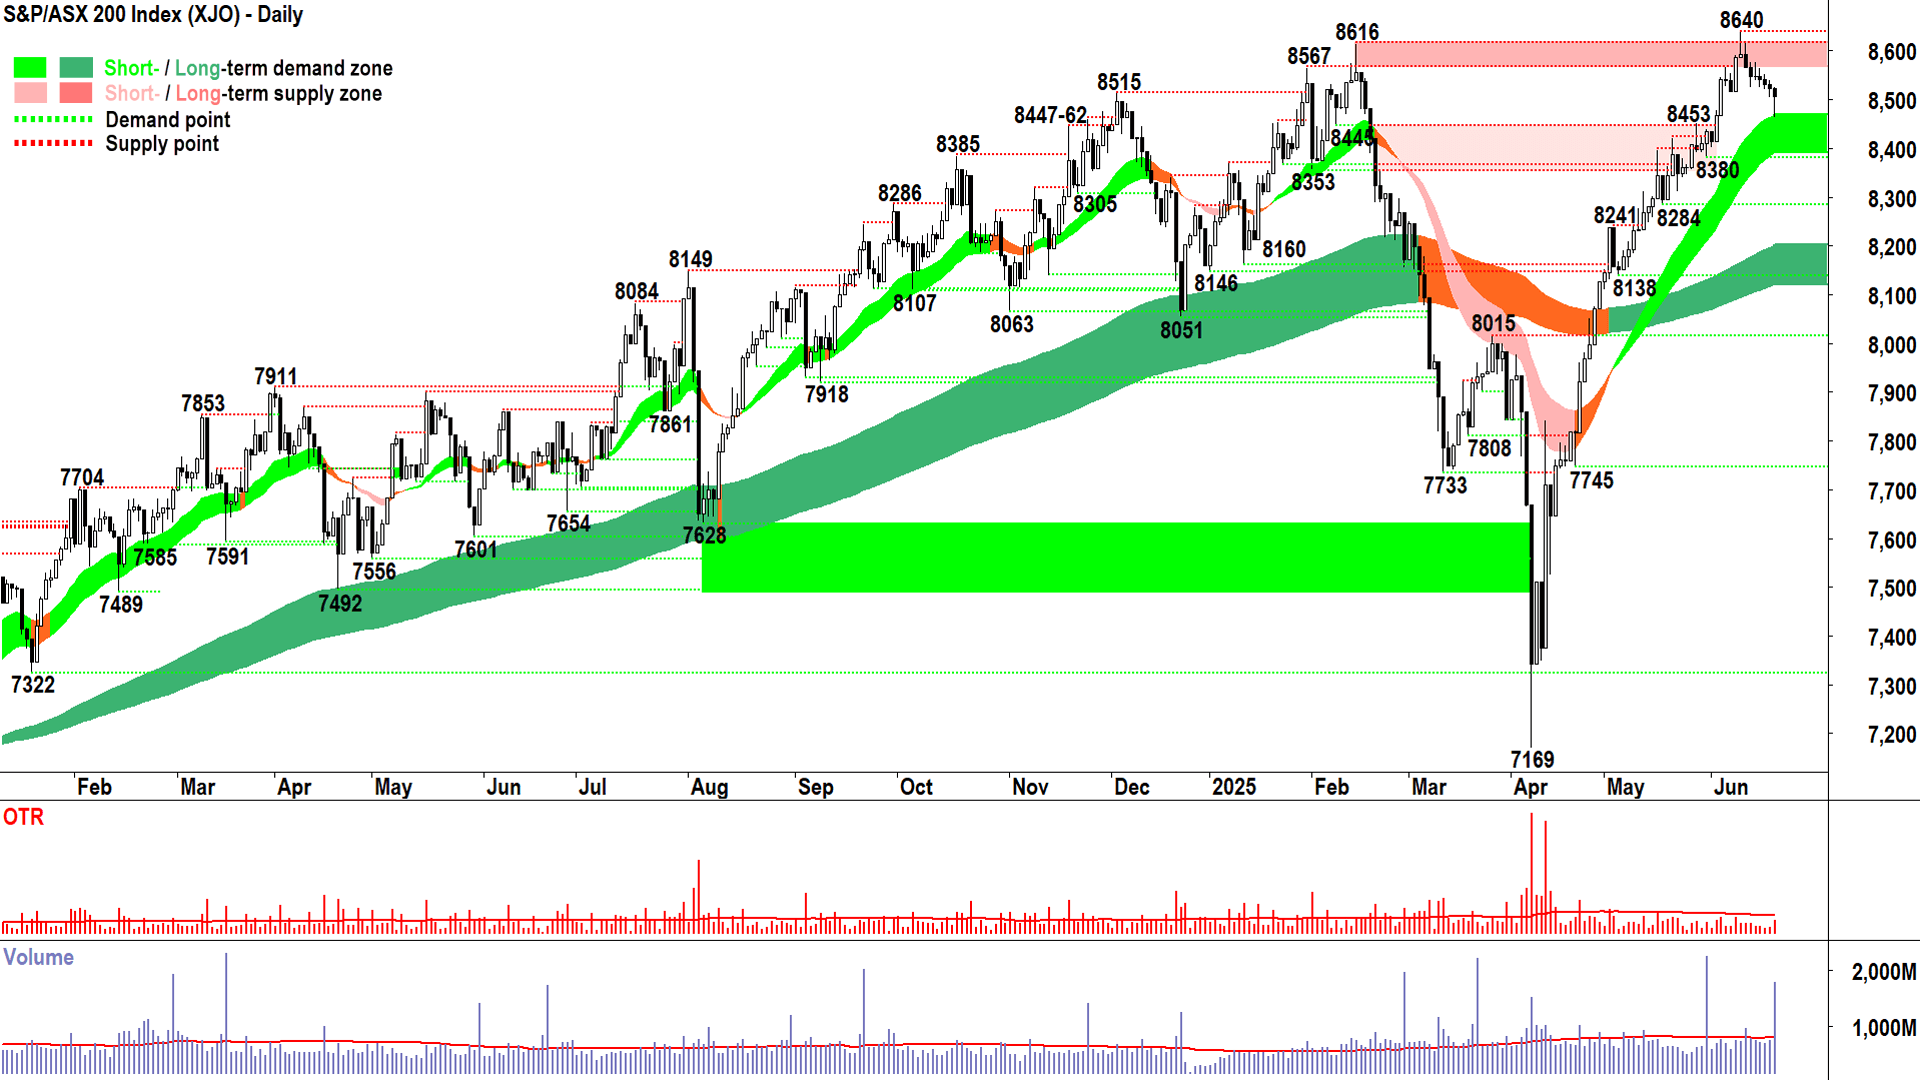
S&P/ASX 200 (XJO)
%20chart%2020%20Jun%202025.png)
An interesting chart (click here for full size image)
If I was a pirate, I'd speak in terms of "X marks the spot". I'm not a pirate, though, I'm a technical analyst. So, I might say "The short term uptrend ribbon marks the spot".
More specifically, the spot where dynamic excess demand is likely to kick in, as it seems to have done today.
Consider that at today's low, today's candle was full black and a bit scary. But the demand that came in at the short term uptrend ribbon soaked up the nervous nellies selling early in the session, and was motivated enough to push prices back up the session's range by the close.
They weren't motivated enough / there was sufficient supply to hold them back to get all the way back up to the open and beyond – so the body of the candle remained black by the close.
Today could have been better, sure...but I suggest today's price action remains consistent with buy the dip activity and our working thesis of short and long term demand-side control.
The other thing I'll note, and it reinforces the "there's latent demand down there" notion, is the 8453 previous point of supply is now acting as a point of demand. So, we're seeing a confluence of static and dynamic demand factors.
This is important because:
In theory, it makes the short term uptrend ribbon / 8453 point / zone of demand more likely to influence price action
It will be far more meaningful (and deal breaking) should the XJO close below it ⚠️
As it stands, there's a war in the Middle East, and there's a corresponding wall of worry and uncertainty with fewer signs of resolution than there are signs of escalation.
= 7 pretty benign supply candles in a row.
I reckon that's pretty good. Hey, if I told you this is how it would play out on 11 June when we made our all time high, you'd probably take it. Particularly given that candle's long upward pointing shadow that we seem obliged to print on days when we make an all time high 🤦!
Staying the course on the XJO. No change to overall portfolio risk levels (explained in the first 15 minutes here).
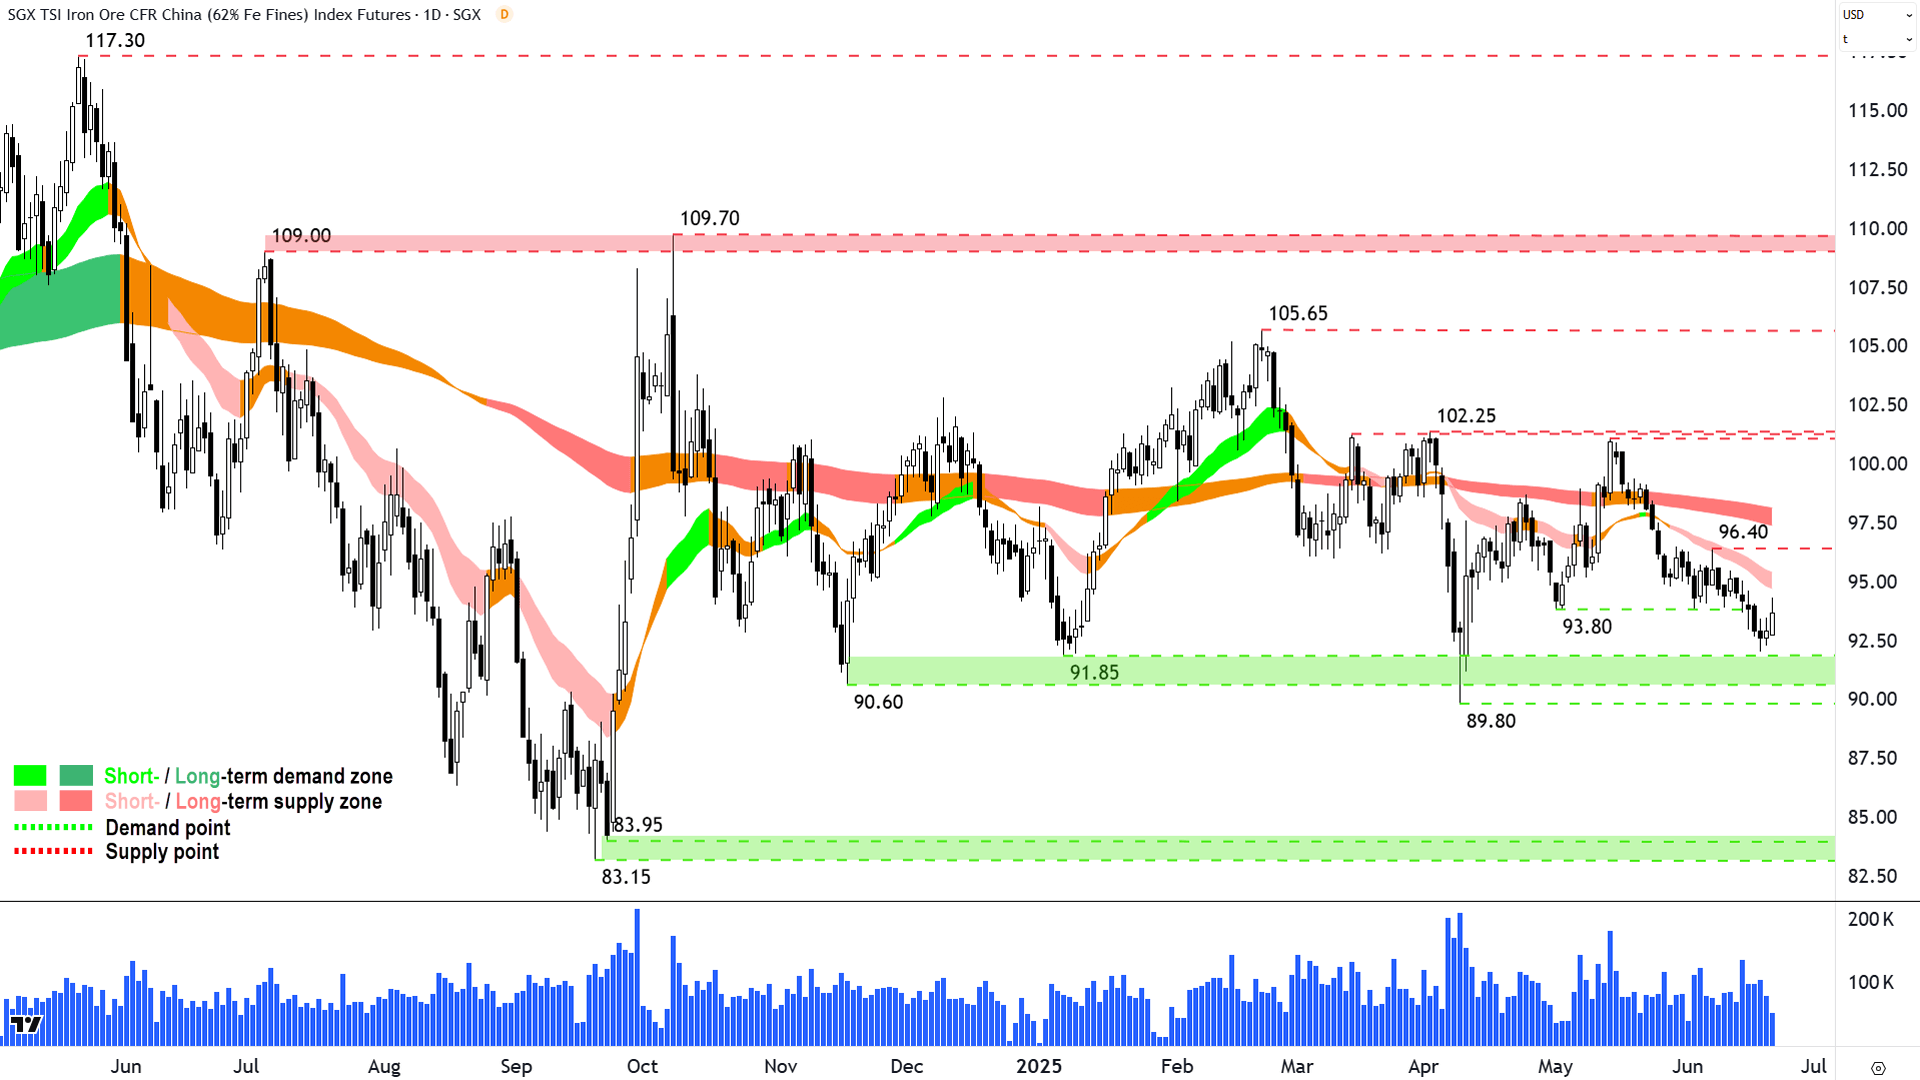
Iron Ore 62% (Front month, back-adjusted) SGX
%20SGX%20chart%2020%20Jun%202025.png)
Not great, but not that bad (click here for full size image)
This one has been getting a bad wrap in the financial media last few days, and the major iron ore miners' share prices have been tanking, so I thought it might be worth a quick look.
Sure, the short and long term trends of iron ore don't look great, but they're hardly precipitous, either. Yes, short and long term downtrends are in place, and each appears to be building in momentum – but more than anything I see trading ranges within trading ranges here.
89.08-91.85 is the key demand zone. I'd say it's more than just hype, though, if iron ore closes below there ⚠️.
Supply is at the short term trend ribbon, but builds through 96.40 and into the long term trend ribbon, currently around 98.00. There's no joy for iron ore fans until it can close above that critical level.
The iron ore chart is hardly a glowing endorsement for BHP, CIA, FMG, RIO etc., but it's likely only one piece of the puzzle that's contributing to their collective environment of excess supply (you know my theory about fund flows).
Not that any of this would worry you lot, because as avid followers of my ChartWatch ASX Scans, none of you would be caught dead owning any of those stocks anyway (each is a serial Downtrend Scan Lists constituent 📉! )
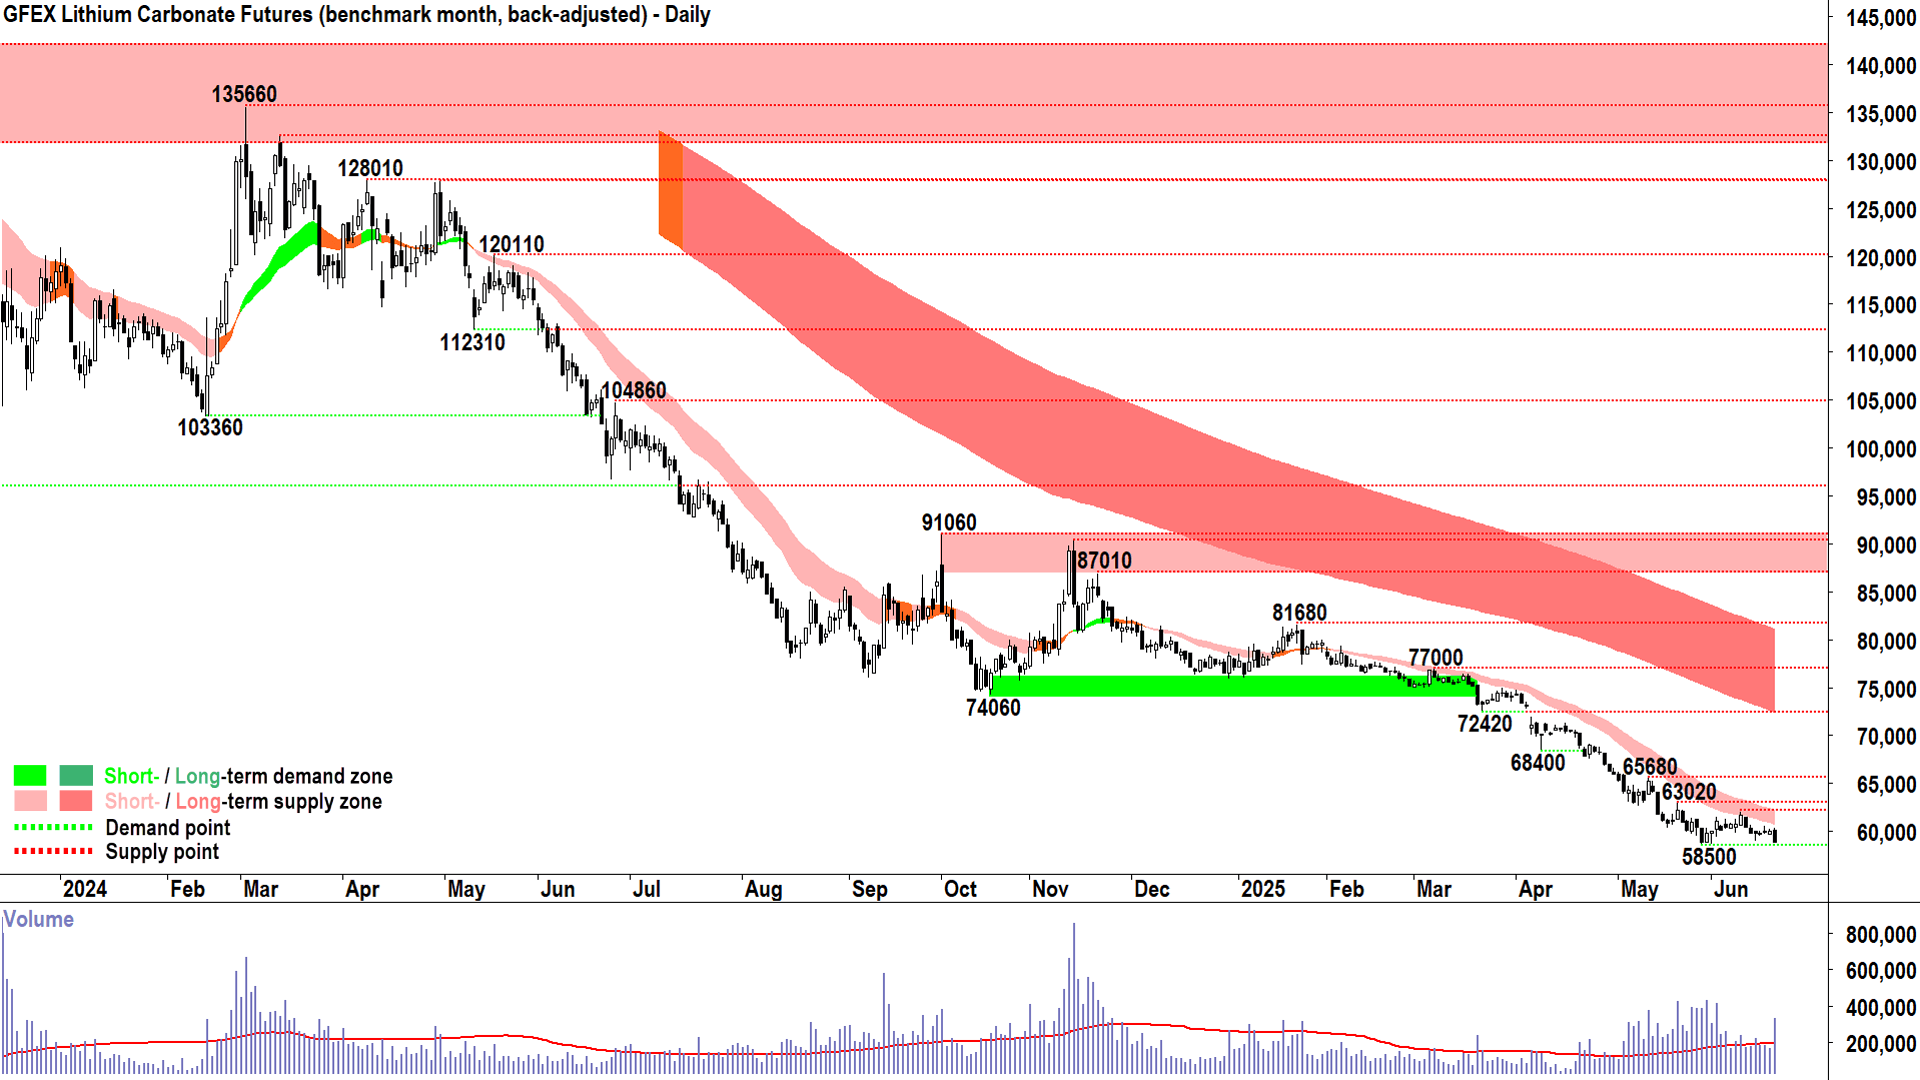
Lithium Carbonate Futures (Benchmark month, back-adjusted) GFEX

Don't believe the hype, trust only the trend! 💪 (click here for full size image)
On the topic of ChartWatch ASX Scans serial downtrends losers that I have faith that none of you own, I note that lithium stocks were also under some pressure today.
Prices are tracking lower again today, and continue a set of very well established short and long term downtrends. If there is a light at the end of this tunnel, a tunnel now well into its third year of length, I can't see it.
One thing I do notice is the general increase in volumes traded on the benchmark GFEX lithium contract over the last few months. Higher volumes and continued downward price action suggests plenty of motivated supply is hitting plenty of not very motivated demand.
If there is a silver lining for lithium bulls...however faint its glimmer...it's that there's plenty of demand around. But for the last few years I've been watching this market closely, I've never claimed that demand was a problem (remember: the narrative being espoused by lithium bulls is its great demand-side picture 📈).
Lithium's problem is the supply-side. There's just too much of it around, and too much of it that's motivated enough to accept lower, and lower prices. Change this, change the trend.
Here's the lesson that all commodity stock investors must internalise:
Incredible demand-side narratives are worthless unless the supply-side is unable or unwilling to respond. Don't believe the hype. Trust only the trend because it tells you the complete demand versus supply picture.
Economy
Today
There weren't any major data releases in our time zone today
Later this week
Friday
11:00 CHN 1-yr & 5-yr Loan Prime Rate (no change at 3.0% and 3.5% respectively forecast)
Saturday
00:00 USA CB Leading Index m/m (-0.1% forecast vs -1.0% previous)
Latest News
Interesting Movers
Trading higher
+15.4% Galan Lithium (GLN) – A$20 Million Placement to Strategic Partner.
+10.8% Dimerix (DXB) – No news since 19-Jun Investor Presentation.
+10.3% Saturn Metals (STN) – Excellent Gold Intercepts at Apollo Hill, general strength across the broader Gold sector today, rise is consistent with prevailing short and long term uptrends, a regular in ChartWatch ASX Scans Uptrends list 🔎📈
+8.7% 29METALS (29M) – No news, rise is consistent with prevailing short term uptrend and long term trend is transitioning from down to up 🔎📈
+8.3% Cettire (CTT) – Change of Director's Interest Notice, (Steven Fisher on market purchase of $20,250).
+7.7% New World Resources (NWC) – Proposed issue of securities and New World Enters Into Revised Proposal With Caml, rise is consistent with prevailing short and long term uptrends 🔎📈
+7.2% GR Engineering Services (GNG) – EPC Contract - Eloise Copper Expansion Project, rise is consistent with prevailing short and long term uptrends, a regular in ChartWatch ASX Scans Uptrends list 🔎📈
+5.9% Zip Co. (ZIP) – No news, rise is consistent with prevailing short and long term uptrends, a regular in ChartWatch ASX Scans Uptrends list 🔎📈
+5.5% Droneshield (DRO) – No news, rise is consistent with prevailing short and long term uptrends, a regular in ChartWatch ASX Scans Uptrends list 🔎📈
+5.3% Botanix Pharmaceuticals (BOT) – No news 🤔.
+5.0% NRW (NWH) – No news 🤔.
+4.8% Articore Group (ATG) – Change in substantial holding and Change in substantial holding.
Trading lower
-12.8% Amplia Therapeutics (ATX) – No news, pulled back after yesterday's sharp rally due to Second Complete Response in ACCENT Pancreatic Cancer Trial.
-8.2% Vulcan Steel (VSL) – No news, fall is consistent with prevailing short and long term downtrends, a regular in ChartWatch ASX Scans Downtrends list 🔎📉
-7.2% Elevate Uranium (EL8) – No news, general weakness across the broader Uranium sector today, pulled back in the wake of recent sharp rally.
-6.2% MTM Critical Metals (MTM) – No news, pulled back in the wake of recent sharp rally.
-6.2% Mineral Resources (MIN) – No news, general weakness across the broader Iron Ore sector today, fall is consistent with prevailing short and long term downtrends, a regular in ChartWatch ASX Scans Downtrends list 🔎📉
-6.1% Electro Optic Systems (EOS) – No news, pulled back in the wake of recent sharp rally.
-5.9% McMillan Shakespeare (MMS) – No news 🤔.
-5.5% Clarity Pharmaceuticals (CU6) – No news, fall is consistent with prevailing short and long term downtrends, a regular in ChartWatch ASX Scans Downtrends list 🔎📉
-5.0% Pilbara Minerals (PLS) – No news, general weakness across the broader Lithium sector today, fall is consistent with prevailing short and long term downtrends, a regular in ChartWatch ASX Scans Downtrends list 🔎📉
-4.7% Boss Energy (BOE) – No news, general weakness across the broader Uranium sector today.
-4.0% Iluka Resources (ILU) – No news, repelled perfectly from long term downtrend ribbon!, a regular in ChartWatch ASX Scans Downtrends list 🔎📉
-3.7% IGO (IGO) – No news, general weakness across the broader Lithium sector today, fall is consistent with prevailing short and long term downtrends, a regular in ChartWatch ASX Scans Downtrends list 🔎📉
Broker Moves
AGL Energy (AGL)
Retained at equal-weight at Morgan Stanley; Price Target: $11.88
ANZ Group (ANZ)
Retained at equal-weight at Morgan Stanley; Price Target: $26.50
Arena Reit. (ARF)
Retained to neutral from at UBS; Price Target: $4.19 from $4.10
Accent Group (AX1)
Retained at buy at UBS; Price Target: $1.800
BWP Trust (BWP)
Retained to buy from at UBS; Price Target: $4.16 from $4.05
Charter Hall Group (CHC)
Retained at overweight at Morgan Stanley; Price Target: $22.60
Retained to sell from at UBS; Price Target: $18.41 from $15.49
Centuria Industrial Reit (CIP)
Retained to buy from at UBS; Price Target: $3.92 from $3.82
Collins Foods (CKF)
Retained at buy at UBS; Price Target: $7.16
Charter Hall Long Wale Reit (CLW)
Retained to neutral from at UBS; Price Target: $4.33 from $4.18
Centuria Capital Group (CNI)
Retained at overweight at Morgan Stanley; Price Target: $2.20
Upgraded to neutral from neutral at UBS; Price Target: $1.810 from $1.740
Centuria Office Reit (COF)
Upgraded to neutral from neutral at UBS; Price Target: $1.200 from $1.140
Charter Hall Retail Reit (CQR)
Downgraded to neutral from neutral at UBS; Price Target: $3.95 from $3.69
CSL (CSL)
Retained at buy at Ord Minnett; Price Target: $310.00
Domain Australia (DHG)
Downgraded to neutral from overweight at Jarden; Price Target: $4.43
Domino's Pizza Enterprises (DMP)
Retained at neutral at UBS; Price Target: $19.73
Dexus (DXS)
Retained at underweight at Morgan Stanley; Price Target: $7.75
Retained to buy from at UBS; Price Target: $8.84 from $8.70
Goodman Group (GMG)
Retained to buy from at UBS; Price Target: $36.00
GPT Group (GPT)
Retained at overweight at Morgan Stanley; Price Target: $5.67
Retained to neutral from at UBS; Price Target: $5.40 from $5.29
Guzman y Gomez (GYG)
Retained at neutral at UBS; Price Target: $29.22
Homeco Daily Needs Reit (HDN)
Downgraded to neutral from neutral at UBS; Price Target: $1.400 from $1.350
HMC Capital (HMC)
Retained to buy from at UBS; Price Target: $8.00 from $12.40
Ingenia Communities Group (INA)
Retained to neutral from at UBS; Price Target: $6.10 from $6.30
JB HI-FI (JBH)
Retained at sell at UBS; Price Target: $109.97
Jumbo Interactive (JIN)
Retained at outperform at Macquarie; Price Target: $13.90 from $14.80
Lifestyle Communities (LIC)
Retained to buy from at UBS; Price Target: $10.37 from $10.20
Lendlease Group (LLC)
Upgraded to neutral from neutral at UBS; Price Target: $6.05 from $6.38
Lovisa (LOV)
Retained at sell at UBS; Price Target: $26.00
Mirvac Group (MGR)
Retained at equal-weight at Morgan Stanley; Price Target: $2.45
Retained to neutral from at UBS; Price Target: $2.32 from $2.28
National Storage Reit (NSR)
Retained to buy from at UBS; Price Target: $2.57
Origin Energy (ORG)
Retained at underweight at Morgan Stanley; Price Target: $9.33
Premier Investments (PMV)
Retained at buy at UBS; Price Target: $19.20
RAM Essential Services Property Fund (REP)
Retained to buy from at UBS; Price Target: $0.750
Rural Funds Group (RFF)
Retained to neutral from at UBS; Price Target: $1.890 from $1.840
Region Group (RGN)
Retained at underweight at Morgan Stanley; Price Target: $2.25
Retained to neutral from at UBS; Price Target: $2.35 from $2.30
Rio Tinto (RIO)
Retained at neutral at UBS; Price Target: $120.00
Regis Resources (RRL)
Retained at hold at Bell Potter; Price Target: $4.82 from $4.72
Scentre Group (SCG)
Retained to neutral from at UBS; Price Target: $3.82 from $3.74
Siteminder (SDR)
Initiated at buy at Moelis Australia; Price Target: $6.19
Seek (SEK)
Retained at buy at Citi; Price Target: $28.50
Retained at outperform at Macquarie; Price Target: $26.75
Stockland (SGP)
Retained at overweight at Morgan Stanley; Price Target: $6.75
Retained to neutral from at UBS; Price Target: $5.55 from $5.37
Service Stream (SSM)
Retained at buy at Ord Minnett; Price Target: $2.15 from $1.910
Step One Clothing (STP)
Retained at buy at Bell Potter; Price Target: $1.300
Super Retail Group (SUL)
Retained at neutral at UBS; Price Target: $13.65
Suncorp Group (SUN)
Retained at overweight at Morgan Stanley; Price Target: $25.00
The Lottery Corporation (TLC)
Retained at outperform at Macquarie; Price Target: $5.40
Universal Store (UNI)
Retained at buy at UBS; Price Target: $10.30
Vicinity Centres (VCX)
Downgraded to sell from sell at UBS; Price Target: $2.38 from $2.27
Scans
Top Gainers
Code | Company | Last | % Chg |
|---|---|---|---|
| PV1 | Provaris Energy Ltd | $0.015 | +50.00% |
| E79 | E79 Gold Mines Ltd | $0.028 | +40.00% |
| HAW | Hawthorn Resources Ltd | $0.068 | +28.30% |
| NSB | Neuroscientific Biopharmaceuticals Ltd | $0.079 | +27.42% |
| HCL | Highcom Ltd | $0.30 | +25.00% |
Top Fallers
Code | Company | Last | % Chg |
|---|---|---|---|
| RPG | Raptis Group Ltd | $0.044 | -72.50% |
| BCB | Bowen Coking Coal Ltd | $0.18 | -48.57% |
| WEC | White Energy Company Ltd | $0.035 | -20.46% |
| ODY | Odyssey Gold Ltd | $0.019 | -17.39% |
| GUL | Gullewa Ltd | $0.068 | -17.07% |
52 Week Highs
Code | Company | Last | % Chg |
|---|---|---|---|
| NSB | Neuroscientific Biopharmaceuticals Ltd | $0.079 | +27.42% |
| STN | Saturn Metals Ltd | $0.375 | +10.29% |
| TKM | Trek Metals Ltd | $0.088 | +10.00% |
| FDR | Finder Energy Holdings Ltd | $0.091 | +9.64% |
| PUA | Peak Minerals Ltd | $0.024 | +9.09% |
52 Week Lows
Code | Company | Last | % Chg |
|---|---|---|---|
| BCB | Bowen Coking Coal Ltd | $0.18 | -48.57% |
| ASQ | Australian Silica Quartz Group Ltd | $0.014 | -12.50% |
| RGT | Argent Biopharma Ltd | $0.072 | -12.20% |
| SIO | Simonds Group Ltd | $0.145 | -12.12% |
| ENL | Enlitic Inc | $0.022 | -12.00% |
Near Highs
Code | Company | Last | % Chg |
|---|---|---|---|
| IHD | Ishares S&P/ASX DIV Opportunities Esg Screened ETF | $14.72 | -0.34% |
| YOJ | Yojee Ltd | $0.31 | +3.33% |
| HVN | Harvey Norman Holdings Ltd | $5.30 | -0.56% |
| MVB | Vaneck Australian Banks ETF | $40.67 | -1.07% |
| ORI | Orica Ltd | $18.99 | +0.32% |
Relative Strength Index (RSI) Oversold
Code | Company | Last | % Chg |
|---|---|---|---|
| KMD | KMD Brands Ltd | $0.25 | -1.96% |
| DGL | DGL Group Ltd | $0.37 | 0.00% |
| OBL | Omni Bridgeway Ltd | $1.225 | -2.00% |
| AX1 | Accent Group Ltd | $1.34 | +3.88% |
| NDO | Nido Education Ltd | $0.68 | 0.00% |
