
News | Market Wraps
Evening Wrap: ASX 200 stacks back billions as markets bet Trump tariff pivot has stamped out correction bottom
The S&P/ASX 200 closed 334.6 points higher, up 4.54%.

Mentioned
The S&P/ASX 200 closed 334.6 points higher, up 4.54%.
Just about every stock listed on the ASX went up today. It was that good a day. What could cause such an amazing occurrence? Something big. Something very, very big!
I have the what, the why, and the probably where next for you in a BUMPER edition of Evening Wrap tonight.
Hands down the best evening wrap in the universe. Maybe beyond.
I have detailed technical analysis on the Nasdaq Composite, S&P/ASX 200, US 10-year Treasury Bond Yield, and the Australian Dollar vs US Dollar (AUDUSD) and in today's ChartWatch.
Be sure to click/scroll through for the usual reporting of the major sector and stock-specific moves, the broker responses to them, as well as all the key upcoming economic data in tonight's Evening Wrap.
Let's dive in!
Today in Review
Thu 10 Apr 25, 4:56pm (AEST)
Name | Value | % Chg |
|---|---|---|
Major Indices | ||
| ASX 200 | 7,709.6 | +4.54% |
| All Ords | 7,913.9 | +4.66% |
| Small Ords | 2,926.9 | +6.38% |
| All Tech | 3,331.6 | +6.82% |
| Emerging Companies | 2,085.6 | +6.05% |
Currency | ||
| AUD/USD | 0.6177 | +0.36% |
US Futures | ||
| S&P 500 | 5,459.25 | -0.58% |
| Dow Jones | 40,726.0 | -0.27% |
| Nasdaq | 19,098.75 | -0.98% |
Name | Value | % Chg |
|---|---|---|
Sector | ||
| Information Technology | 2,264.0 | +7.57% |
| Materials | 15,349.6 | +6.33% |
| Energy | 6,923.6 | +5.16% |
| Real Estate | 3,488.7 | +4.71% |
| Financials | 8,201.0 | +4.37% |
| Consumer Discretionary | 3,757.2 | +4.17% |
| Utilities | 9,011.5 | +3.65% |
| Health Care | 39,733.9 | +3.58% |
| Industrials | 7,670.4 | +3.50% |
| Communication Services | 1,690.8 | +2.95% |
| Consumer Staples | 12,156.7 | +1.88% |
Markets

ASX 200 Session Chart
The S&P/ASX 200 (XJO) finished 334.6 points higher at 7,709.6, 4.5% from its session low and but still 1.7% adrift from its high. In the broader-based S&P/ASX 300 (XKO), advancers beat decliners by a rather decisive 289 to 1. Not a misprint!
Once again, I’ll break with Evening Wrap tradition and dispense with the usual “this went up and that went down” data that’s typical of this first section. Let’s face it, you can that waffle from any of the other market wraps.
I want to start at the point I tell you time and again we must always start as investors. Guess what it is...Go on!
Ha! I know I had you at “Where you should always start as investors”.
The bond market 💪.

Always start with "the price of money" market! 😁
Q. What caused the most powerful man in the world to back down from the centrepiece of his MAGA agenda?
A. The bond market.
I’ve seen financial regulators and Federal Reserve governors make snap decisions based on the bond market, but I’ve never seen a politician refer to it before substantially backflipping on one of the most controversial and sweeping fiscal policy measures ever – in the blink of an eye.
Or more specifically, in the blink of a tweet on Truth Social:

Trump’s post on Truth Social, announcing a 90-day pause to most “reciprocal tariffs” among other things
Of course, I doubt The Donald had much of idea of the ructions his his Liberation Day “reciprocal tariffs” were causing in the bond market – i.e., the price of risk-free money and therefore the price of all assets on the planet market.
He was advised of the brewing storm in the bond market on Wednesday, and rumour has it, rather forcefully and unceremoniously too. It seems key advisers in his administration gave him little choice but to ease back on the throttle.
So, it seems that not even the greatest deal maker of all time (maybe even longer) could fight the bond market.
Really, President Trump should have been reading the ChartWatch section of this Evening Wrap. If he had, he would have understood, like you already did, what the massive upswing in bond market yields post-Liberation Day foretold about the market’s views of the enormous build-up of risk facing the global economy.
I’m not sure if I could have been clearer in my commentary on US bond yields yesterday:

"Markets are discombobulated", ChartWatch, Market Index Evening Wrap, Wednesday 9 April
It looks like someone got my message through to the Oval Office. The result was something I've not seen in over three decades of watching markets. Policy on the fly... By tweets... With many in the Trump administration left in the lurch.
Like the market cares why or how the the policy change came about!
The response from risk managers was swift, it was large, and it stuck all the way into the close (as far as US markets were concerned, but less so for ours – more on that in ChartWatch below).
We'll look at the stock index charts in a second, but you can see from the Market Breadth statistic I post at the start of this wrap each day – today's de-risking and accompanying repricing of risk assets was near-unanimous (289 to 1 up vs down on the ASX 300).
The repricing of risk assets also flowed through to the "canary in the mineshaft" for global economic growth, the Australian dollar versus the US dollar exchange rate. So we're ticking all the right boxes so far...
%20chart%2010%20April%202025.png)
Australian Dollar vs US Dollar (AUDUSD) (click here for full size image)
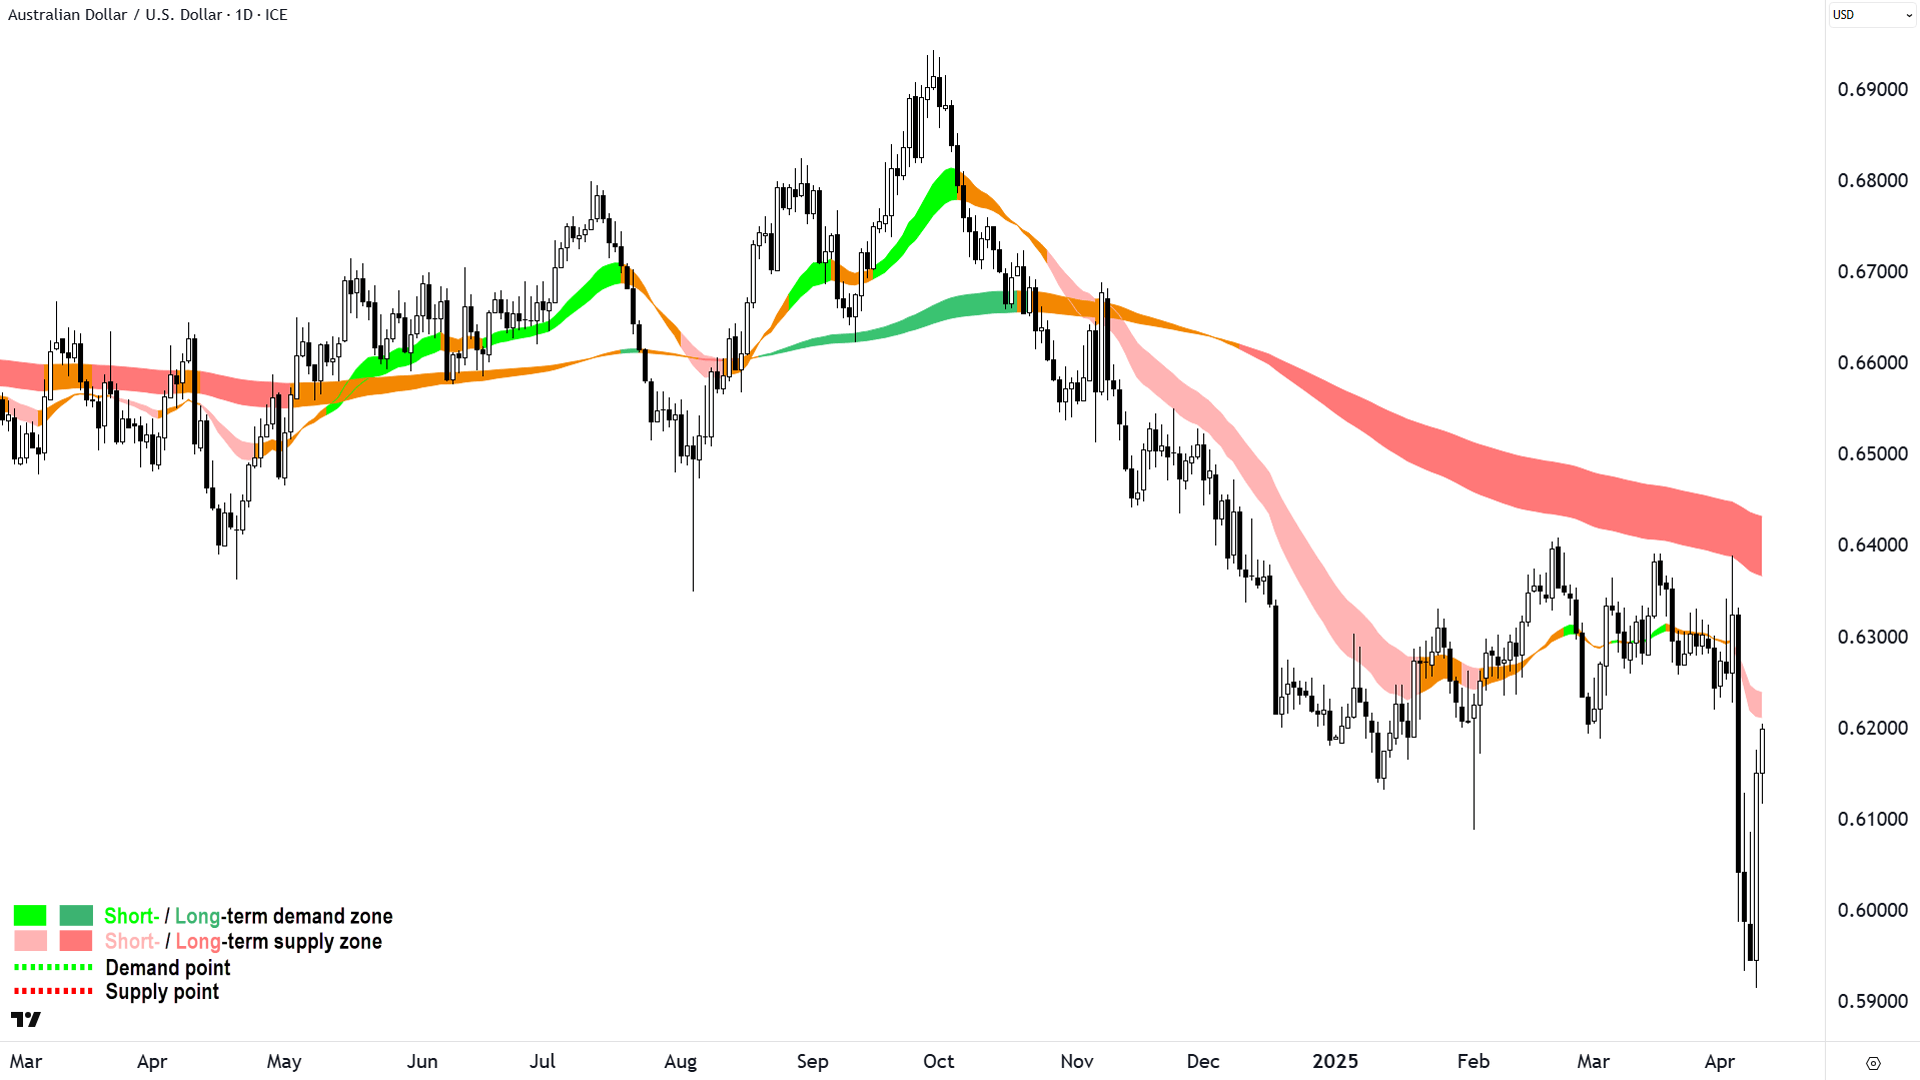
But arguably, and this is the irony of major market moves today – and the bit you will need to continue to monitor – the bond market really didn't come to the party with substantially lower yields to match substantially higher risk asset prices.

US 10 Year T-Bond Yield (click here for full size image)
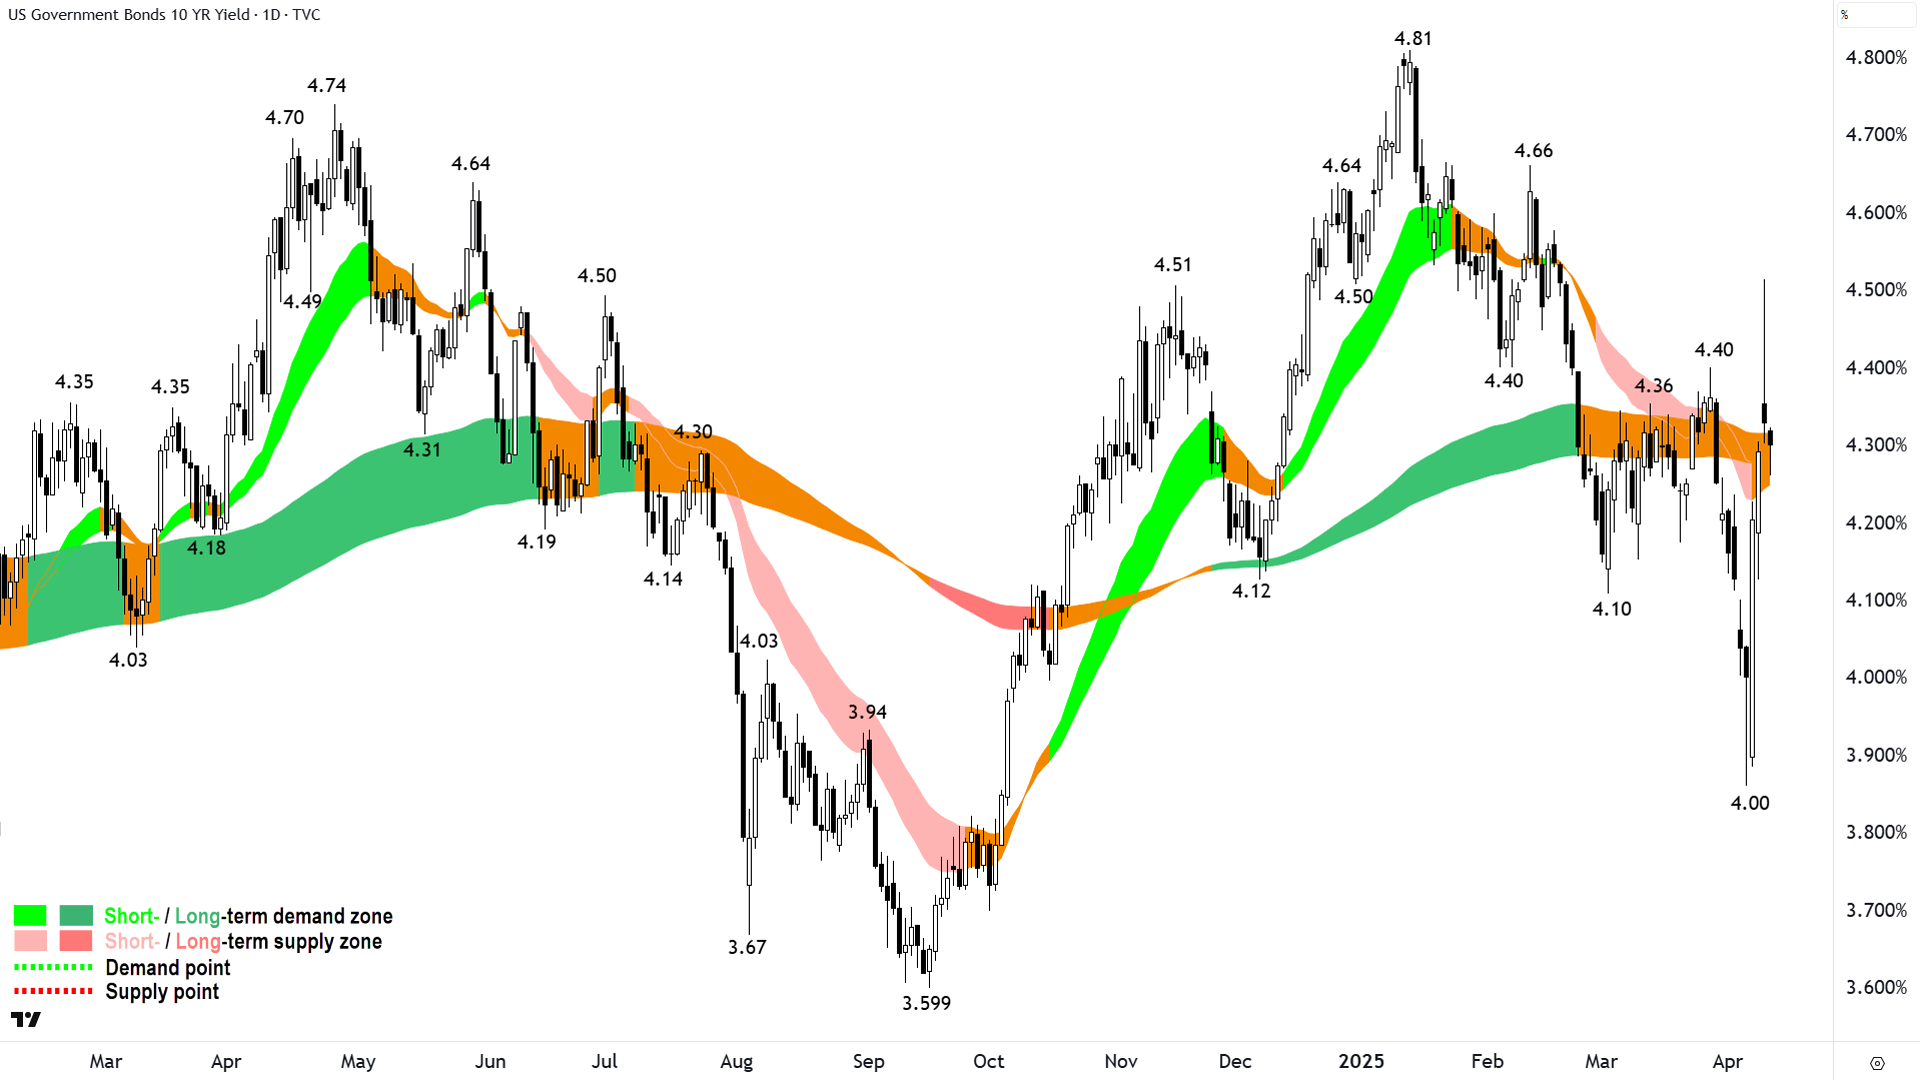
What we did get, as can be seen in the chart above (we're looking at the second-from-last candle because the last candle is the current, live one) is merely a stepping back from the ledge. A long upward pointing shadow on Wednesday's candle – is to be sure a strong indicator of possible further falls – but it's no substantial paring back in risk-free market yields or corresponding recovery in the bond market just yet.
So, the stock market and the Australian dollar appear to be saying there's a very good chance we're out of the woods, but the bond market is saying: "Um, not so sure yet, pal".
It's up to you to decide who to believe! 🤔
(P.S. If I had a dollar for every media article picking up on the role played by / importance of the bond market in recent developments – FOR THE VERY FIRST TIME – well I'd have about 30 bucks! 💰😁)
ChartWatch
NASDAQ Composite Index

An interesting chart (click here for full size image)
Yesterday I wrote a carefully considered, meticulous, and detailed article on how I, as a trend following technical analyst, identify major market turning points. Effectively, how to determine when long term downtrends end and long term uptrends begin (and vice-versa) – to help investors understand the technical signals that will likely accompany the next market bottom. Based on decades of relentless and diligent market observations.
Perhaps I need to add a caveat to that analysis: Shelve it until inauguration day 2028!!!
It may not be the case from here, that we go through the incremental growth in our typical check-box factors of trend, price action, and candlestick signals – therefore building a case for a market bottom – in the typical fashion we did in historical, pre-Trump environment markets.
Instead, it is more likely things will develop far more quickly this time around.
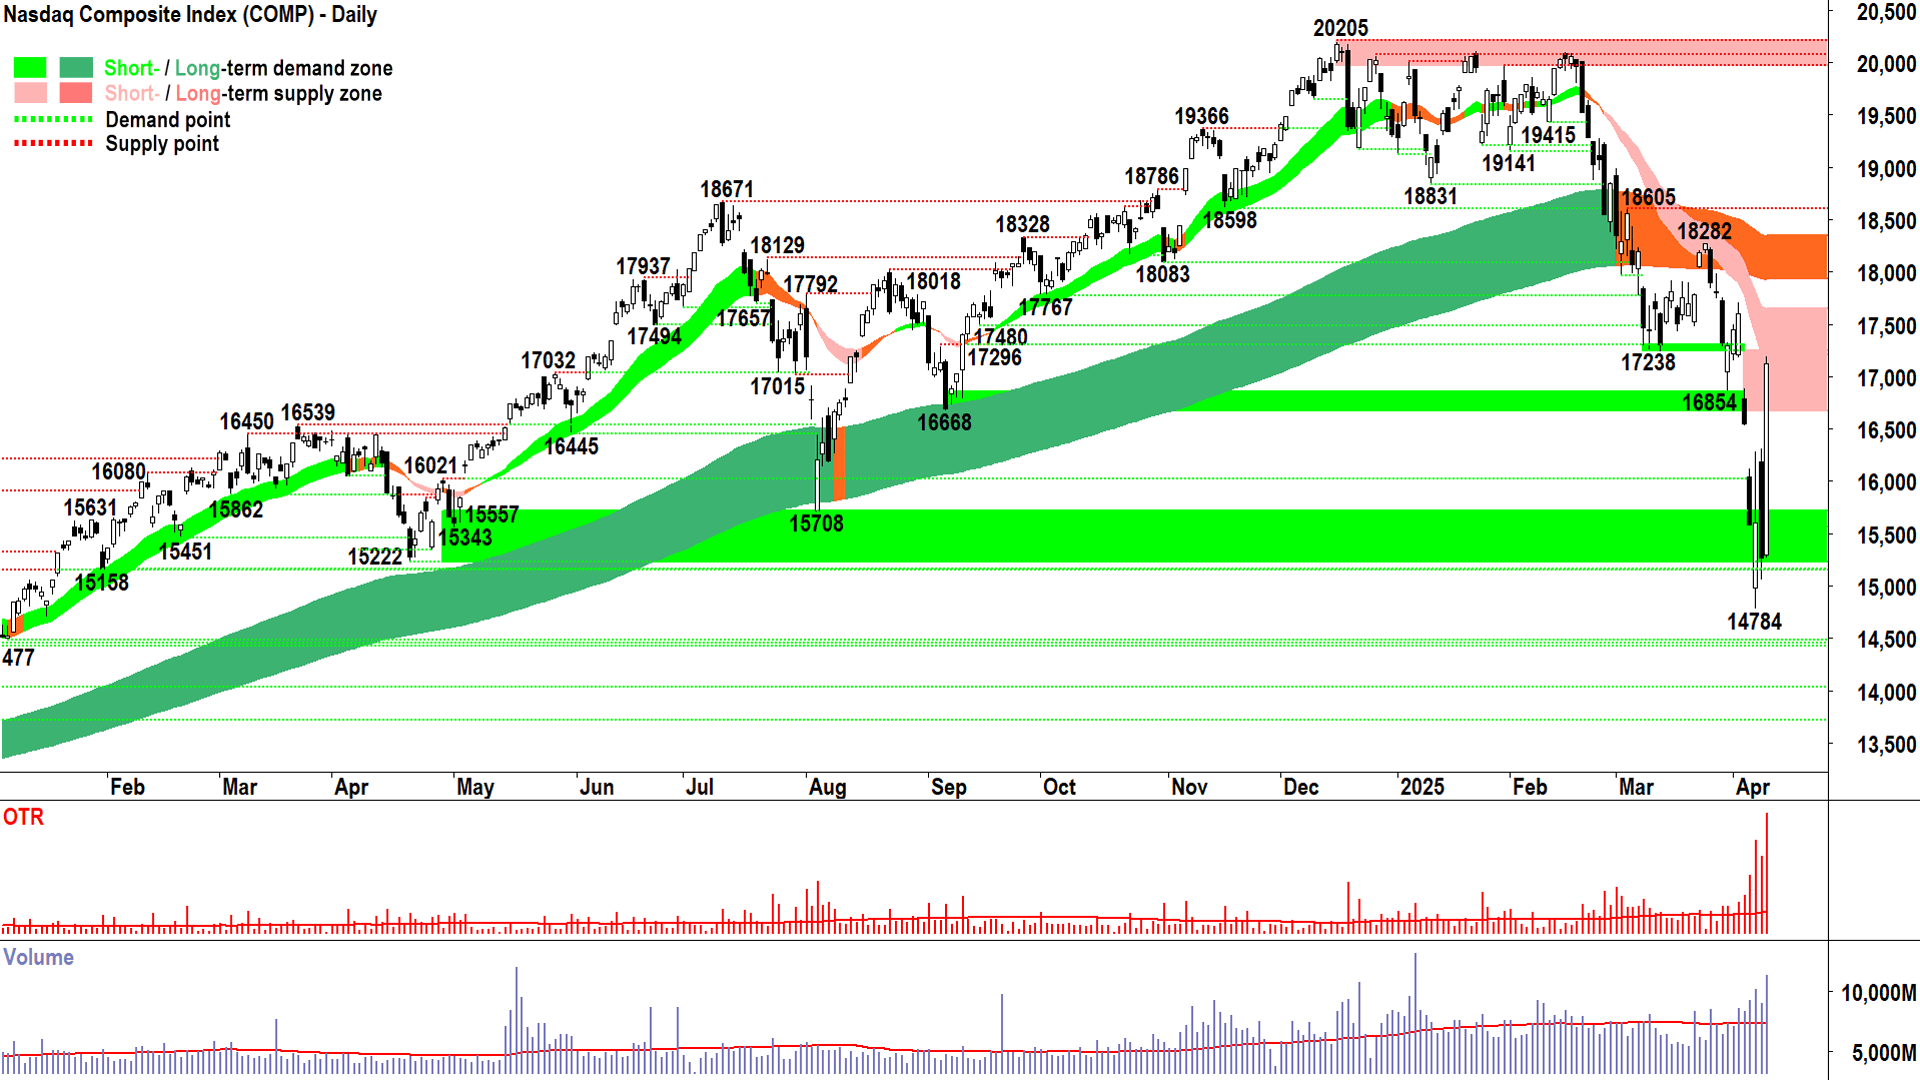
Wednesday’s massive white candle, with its high close and accompanied by extreme volatility (red vertical bars in “OTR” window) and substantially above average volume (blue vertical bars in “Volume” window), pushing past at least one expected point of supply (16854) – is consistent with the setting of a major market low.
This tanalising possibility, "Wednesday's candle is consistent with a major market low", is made based upon observations of more major market lows than I’d care to remember. I must trade what I see, Trump tariff backflip shenanigans aside!
But! One candle does not a reversal make! So, I’ll be watching closely for further confirmation in candles (i.e., continued white-bodied and or downward pointing shadows), price action (setting of a higher trough–thus indicating building demand), and the subsequent closing above short and long term trend ribbons (critical!).
On thing I can say with confidence is: 14784 is now the critical point of demand for the Comp. As long as we close above it, then there’s every chance that President Trump just triggered the start of the next bull market.
Ironically, though he’s also responsible for ending the last bull market, and triggering the present bear market. So there's that...🤔
In summary, is there nothing this man can’t do? Welcome to Trump’s “new normal” investors! 🤦
S&P/ASX 200 (XJO)
%20Intraday%20chart%2010%20April%202025.png)
An interesting chart (click here for full size image)
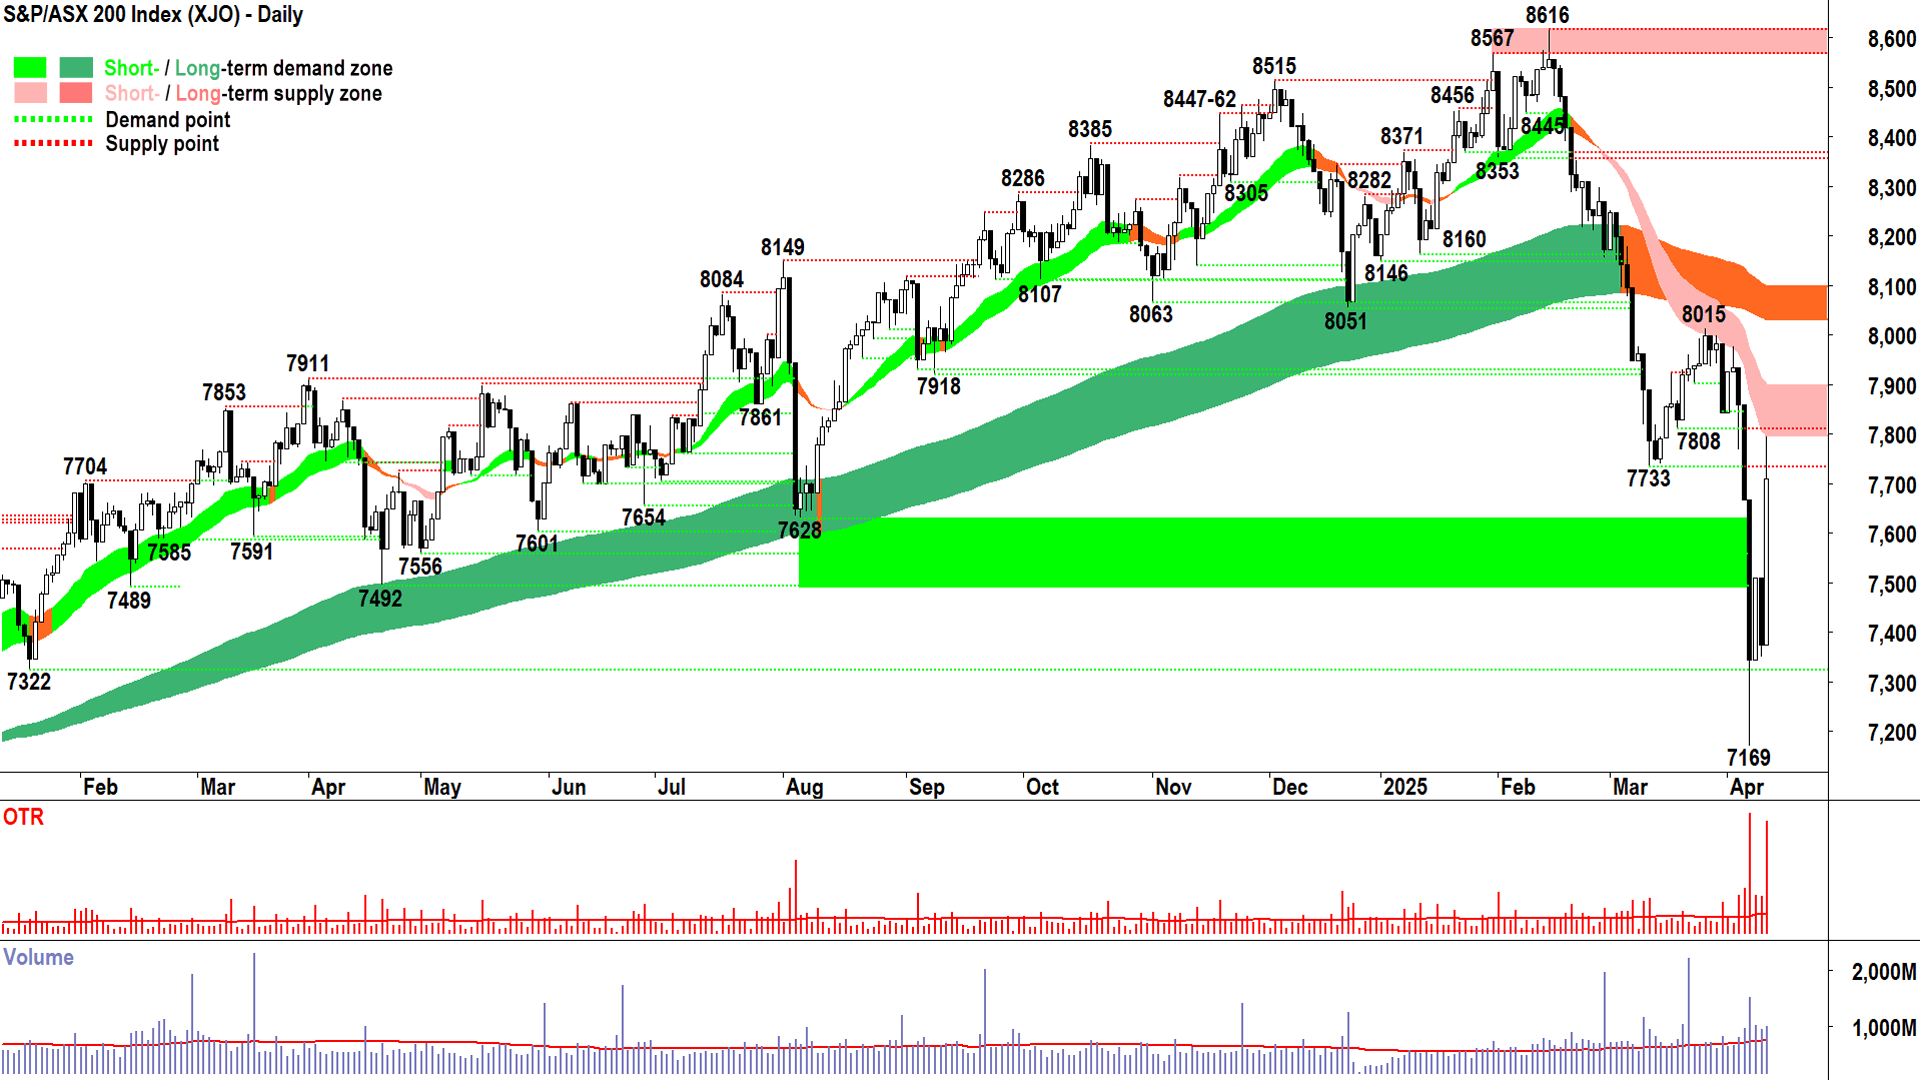
A very solid day for Aussie shares today.
But I know what you’re thinking: That upward pointing shadow – ending smack bang at the dynamic supply we’d expect at the short term downtrend ribbon – suggests that there remains in the system at least some element of doubt as to whether the low is in.
I’m with you.
Today’s price action is definitely a sound step in the right direction, but there’s still plenty more work to be done to confirm the low of this correction is indeed in.
Much like 14784 in the Comp chart, 7169 is now the key level here. Above it – the resumption of the bull market remains a distinct possibility. However, close below it – and I suggest something really, really bad is happening in the bond market (and elsewhere!).
Key levels looking up? That short term trend ribbon. No doubt. Ideally we get a close above there pretty quick – perhaps even tomorrow for good proof of new demand-side control measure.
I say this because I see a wall of potential supply between today’s high and the long term downtrend ribbon. If we are going to get a signal that this correction is bound for a bear market – it will likely occur in that zone.
And, as you know, it will occur with a cluster of black candles and or upward pointing shadows, plus most likely, the setting of a lower peak.
Alternatively, if we do the opposite in that zone, i.e., log demand-side candles and higher troughs – then this rally has legs.
That’s the road map both out of this mess and deeper into it. My tip? 🤔
It’s irrelevant. The market is going to do what the market is going to do. I have absolutely zero control over that.
I know my place. I react, I don’t predict. I analyse price action, and I manage my risk accordingly. Right now, my risk levels haven’t changed – even after today’s massive gain (and all the news that preceded it) – because I see nothing to push me off my most conservative risk setting – one-third capital invested.
I can use the full extent of that limit if I wish. I wouldn’t have any qualms doing so if I can find the requisite trends (keep an eye on the Uptrends lists in ChartWatch ASX Scans!). I may, however, now choose to be less active on the shorting side of the ledger.
Economy
Today
CHN Consumer Price Index (CPI) & Producer Price Index (PPI) March
CPI: -0.1% p.a. vs +0.1% p.a. forecast and -0.7% p.a. in February
PPI: -2.5% p.a. vs -2.3% p.a. forecast and -2.2% p.a. in February
Both weaker than expected, and both indicate slower consumer demand rather than stronger consumer demand. Note that deflation tends to be a bearish indicator for future economic growth.
The continued (and declining) deflation in the PPI is a positive for global disinflation as the Chinese manufacturing sector a major supplier of goods to the world economy
Later this week
Thursday
20:00 RBA Governor Michelle Bullock Speaks
22:30 USA Core CPI March (+0.3% m/m and 3.0% p.a. forecast vs +0.2% m/m and 3.1% p.a. in February)
Friday
22:30 USA Core PPI March (+0.3% m/m and 3.4% p.a. forecast vs -0.1% m/m and 3.2% p.a. in February)
Saturday
00:00 Preliminary University of Michigan Consumer Sentiment April (54.0 forecast vs 57.0 previous)
Latest News
Interesting Movers
Trading higher
+31.2% Global X Ultra Long Nasdaq-100 Hedge Fund ETF (LNAS) - No news, long Nasdaq ETF.
+31.1% Larvotto Resources (LRV) - No news, got belted yesterday, so back up today….
+23.4% BetaShares Geared US Equity Fund Currency Hedged ETF (GGUS) - No news, long US equities ETF.
+21.2% EBR Systems (EBR) - No news, bounced perfectly from long term uptrend ribbon! 🔎📈
+20.7% Zip Co. (ZIP) - No news 🤔.
+19.8% Bannerman Energy (BMN) - No news, general strength across the broader Uranium sector today.
+19.5% Orthocell (OCC) - Remplir Regulatory Application Submitted for Hong Kong, the only stock in probably the top 20 gainers that actually had some news!
+18.1% Mineral Resources (MIN) - No news, general strength across the broader Resources sector today, upgraded to underweight from sell at Jarden (but price target cut to $16.20 from $20.00).
+17.5% Boss Energy (BOE) - Resources Rising Stars Conference Presentation 2025, general strength across the broader Uranium sector today.
+17.4% Paladin Energy (PDN) - No news, general strength across the broader Uranium sector today.
Trading lower
-24.5% Global X Ultra Short Nasdaq-100 Hedge Fund ETF (SNAS) - No news, short Nasdaq ETF.
-24.5% BetaShares US EQY Strong Bear - CH ETF (BBUS) - No news, short US equities ETF.
-10.6% BetaShares Australian Strong Bear ETF (BBOZ) - No news, short Australian equities ETF.
-4.4% BetaShares Australian Equities Bear ETF (BEAR) - No news, short Australian equities ETF.
-3.1% Electro Optic Systems (EOS) - No news, fall is consistent with prevailing short and long term downtrends 🔎📉
-2.8% Metals X (MLX) - No news, massive drop in tin price on the LME yesterday.
Broker Moves
The A2 Milk Company (A2M)
Retained at hold at Bell Potter; Price Target: $7.85 from $7.25
Aussie Broadband (ABB)
Retained at buy at Citi; Price Target: $4.80
Amplitude Energy (AEL)
Retained at outperform at Macquarie; Price Target: $0.250 from $0.280
Ampol (ALD)
Retained at overweight at Morgan Stanley; Price Target: $30.00 from $31.00
Ansell (ANN)
Retained at equal-weight at Morgan Stanley; Price Target: $37.20
ANZ Group (ANZ)
Retained at equal-weight at Morgan Stanley; Price Target: $29.30
APA Group (APA)
Retained at equal-weight at Morgan Stanley; Price Target: $8.28
Arena Reit. (ARF)
Retained at equal-weight at Morgan Stanley; Price Target: $4.50
AUB Group (AUB)
Retained at overweight at Morgan Stanley; Price Target: $38.70
Antipa Minerals (AZY)
Retained at buy at Canaccord Genuity; Price Target: $1.040
BHP Group (BHP)
Retained at outperform at Macquarie; Price Target: $42.00
Boss Energy (BOE)
Retained at buy at Canaccord Genuity; Price Target: $5.35
Retained at buy at Citi; Price Target: $3.30
Beach Energy (BPT)
Retained at underweight at Morgan Stanley; Price Target: $1.280 from $1.440
BWP Trust (BWP)
Retained at equal-weight at Morgan Stanley; Price Target: $3.90
Car Group (CAR)
Retained at buy at Citi; Price Target: $42.00
Catapult Group International (CAT)
Retained at buy at Bell Potter; Price Target: $4.00
Champion Iron (CIA)
Retained at buy at Citi; Price Target: $7.50
Retained at outperform at Macquarie; Price Target: $6.10 from $6.20
Centuria Industrial Reit (CIP)
Retained at hold at Morgans; Price Target: $2.85 from $3.55
Centuria Office Reit (COF)
Retained at hold at Morgans; Price Target: $1.050 from $1.350
Coles Group (COL)
Retained at overweight at Morgan Stanley; Price Target: $21.70
Capstone Copper Corp. (CSC)
Retained at outperform at Macquarie; Price Target: $12.00 from $12.50
CSL (CSL)
Retained at overweight at Morgan Stanley; Price Target: $313.00
Cleanaway Waste Management (CWY)
Retained at overweight at Morgan Stanley; Price Target: $3.18
Dicker Data (DDR)
Retained at overweight at Morgan Stanley; Price Target: $10.30
DigiCo REIT (DGT)
Retained at add at Morgans; Price Target: $5.10 from $5.60
Data#3 (DTL)
Upgraded to buy from neutral at UBS; Price Target: $8.10
Dexus Convenience Retail Reit (DXC)
Retained at add at Morgans; Price Target: $3.20 from $3.25
Dexus Industria Reit (DXI)
Downgraded to hold from add at Morgans; Price Target: $3.60 from $3.16
Deep Yellow (DYL)
Retained at buy at Bell Potter; Price Target: $1.450 from $1.650
Retained at buy at Morgans; Price Target: $1.560 from $1.730
Endeavour Group (EDV)
Retained at overweight at Morgan Stanley; Price Target: $5.30
Emerald Resources (EMR)
Retained at buy at Canaccord Genuity; Price Target: $5.95 from $5.90
Fortescue (FMG)
Retained at neutral at Macquarie; Price Target: $15.00
Garda Property Group (GDF)
Downgraded to hold from add at Morgans; Price Target: $1.150 from $1.590
Goodman Group (GMG)
Retained at buy at Citi; Price Target: $40.00
Upgraded to add from hold at Morgans; Price Target: $35.30 from $38.00
GQG Partners (GQG)
Retained at outperform at Macquarie; Price Target: $2.90 from $3.00
Retained at overweight at Morgan Stanley; Price Target: $3.07 from $3.40
Guzman y Gomez (GYG)
Initiated at overweight at Jarden; Price Target: $35.10
Healthco Healthcare and Wellness Reit (HCW)
Retained at hold at Morgans; Price Target: $0.950
Homeco Daily Needs Reit (HDN)
Retained at add at Morgans; Price Target: $1.330 from $1.360
HMC Capital (HMC)
Retained at hold at Morgans; Price Target: $5.30 from $10.50
Hub24 (HUB)
Upgraded to buy from neutral at Citi; Price Target: $71.50 from $84.80
Insurance Australia Group (IAG)
Upgraded to buy from neutral at UBS; Price Target: $8.30 from $8.50
IPH (IPH)
Retained at overweight at Morgan Stanley; Price Target: $6.50
JB HI-FI (JBH)
Upgraded to buy from hold at Bell Potter; Price Target: $99.00
Karoon Energy (KAR)
Retained at equal-weight at Morgan Stanley; Price Target: $1.650 from $1.880
Magellan Financial Group (MFG)
Retained at underweight at Morgan Stanley; Price Target: $6.30 from $8.20
Mineral Resources (MIN)
Upgraded to underweight from sell at Jarden; Price Target: $16.20 from $20.00
Medibank Private (MPL)
Retained at equal-weight at Morgan Stanley; Price Target: $4.50
Metcash (MTS)
Retained at equal-weight at Morgan Stanley; Price Target: $3.35
National Australia Bank (NAB)
Retained at equal-weight at Morgan Stanley; Price Target: $34.80
Netwealth Group (NWL)
Upgraded to buy from neutral at Citi; Price Target: $26.50 from $30.70
Retained at neutral at E&P; Price Target: $32.00
Retained at sector perform at RBC Capital Markets; Price Target: $29.00
Nuix (NXL)
Downgraded to hold from buy at Jefferies; Price Target: $2.60 from $4.90
Origin Energy (ORG)
Retained at underweight at Morgan Stanley; Price Target: $8.88
Orica (ORI)
Retained at overweight at Morgan Stanley; Price Target: $22.50
Patriot Battery Metals (PMT)
Retained at buy at Canaccord Genuity; Price Target: $0.550
Qube (QUB)
Retained at equal-weight at Morgan Stanley; Price Target: $4.20
REA Group (REA)
Retained at buy at Citi; Price Target: $275.00
Rio Tinto (RIO)
Retained at neutral at Macquarie; Price Target: $116.00
Regal Partners (RPL)
Retained at buy at Bell Potter; Price Target: $3.35 from $5.00
Steadfast Group (SDF)
Retained at overweight at Morgan Stanley; Price Target: $6.71
Sandfire Resources (SFR)
Upgraded to outperform from neutral at Macquarie; Price Target: $10.80
Santos (STO)
Retained at overweight at Morgan Stanley; Price Target: $6.95 from $7.46
Suncorp Group (SUN)
Retained at overweight at Morgan Stanley; Price Target: $23.00
The Lottery Corporation (TLC)
Retained at equal-weight at Morgan Stanley; Price Target: $5.05
Telstra Group (TLS)
Retained at outperform at CLSA; Price Target: $33.25
Retained at overweight at Morgan Stanley; Price Target: $4.70
Treasury Wine Estates (TWE)
Retained at overweight at Morgan Stanley; Price Target: $12.90
Viva Energy Group (VEA)
Retained at equal-weight at Morgan Stanley; Price Target: $1.990 from $2.28
Woodside Energy Group (WDS)
Retained at equal-weight at Morgan Stanley; Price Target: $27.00
Retained at neutral at UBS; Price Target: $26.50
Whitehaven Coal (WHC)
Retained at neutral at Macquarie; Price Target: $5.50 from $6.50
Woolworths Group (WOW)
Retained at overweight at Morgan Stanley; Price Target: $33.00
Waypoint Reit (WPR)
Retained at hold at Morgans; Price Target: $2.50
Scans
Top Gainers
Code | Company | Last | % Chg |
|---|---|---|---|
| FCT | Firstwave Cloud Technology Ltd | $0.017 | +41.67% |
| GHM | Golden Horse Minerals Ltd | $0.36 | +38.46% |
| ARI | Arika Resources Ltd | $0.022 | +37.50% |
| H2G | GREENHY2 Ltd | $0.011 | +37.50% |
| LNAS | Global X Ultra Long Nasdaq 100 Complex ETF | $7.65 | +31.22% |
Top Fallers
Code | Company | Last | % Chg |
|---|---|---|---|
| BGE | Bridge Saas Ltd | $0.018 | -28.00% |
| SNAS | Global X Ultra Short Nasdaq 100 Complex ETF | $29.64 | -24.50% |
| BBUS | Betashares US EQY Strong Bear CCY H Complex ETF | $4.90 | -24.50% |
| OEQ | Orion Equities Ltd | $0.135 | -22.86% |
| LSA | Lachlan Star Ltd | $0.045 | -22.41% |
52 Week Highs
Code | Company | Last | % Chg |
|---|---|---|---|
| GHM | Golden Horse Minerals Ltd | $0.36 | +38.46% |
| KYP | Kinatico Ltd | $0.175 | +12.90% |
| SPR | Spartan Resources Ltd | $2.05 | +12.64% |
| HOR | Horseshoe Metals Ltd | $0.019 | +11.77% |
| LM1 | Leeuwin Metals Ltd | $0.20 | +11.11% |
52 Week Lows
Code | Company | Last | % Chg |
|---|---|---|---|
| MBK | Metal Bank Ltd | $0.011 | -21.43% |
| EME | Energy Metals Ltd | $0.062 | -16.22% |
| ACR | ACRUX Ltd | $0.022 | -12.00% |
| JAN | Janison Education Group Ltd | $0.15 | -9.09% |
| IRD | Iron Road Ltd | $0.044 | -8.33% |
Near Highs
Code | Company | Last | % Chg |
|---|---|---|---|
| GLDN | Ishares Physical Gold ETF | $40.14 | +0.18% |
| GXLD | Global X Gold Bullion ETF | $50.41 | -0.28% |
| MEK | Meeka Metals Ltd | $0.16 | +14.29% |
| TLS | Telstra Group Ltd | $4.40 | +1.38% |
| NUGG | Vaneck Gold Bullion ETF | $50.03 | -0.75% |
Relative Strength Index (RSI) Oversold
Code | Company | Last | % Chg |
|---|---|---|---|
| NXL | NUIX Ltd | $2.48 | +3.33% |
| CNB | Carnaby Resources Ltd | $0.23 | 0.00% |
| MI6 | Minerals 260 Ltd | $0.115 | -11.54% |
| CU6 | Clarity Pharmaceuticals Ltd | $1.655 | +13.36% |
| RDY | Readytech Holdings Ltd | $2.33 | +3.56% |
