
The ASX 200 fell as investors braced for tomorrow’s expected RBA rate hike, with gold stocks slumping to fresh 12-month lows. Miners and banks both dragged on the index, with only industrials and consumer discretionary gaining.
Be sure to click/scroll through for the usual reporting of the major sector and stock-specific moves, the broker responses to them, as well as all the key economic data in tonight's Evening Wrap. Also, I have detailed technical analysis on the Nasdaq Composite and the S&P/ASX 200 in today's ChartWatch.
Let’s dive in!
Today in Review
Name | Value | % Chg |
|---|---|---|
Major Indices | ||
| ASX 200 | 8,856.5 | -0.58% |
| All Ords | 8,977.2 | -0.53% |
| Small Ords | 3,141.7 | -0.20% |
| All Tech | 2,812.3 | -0.23% |
| Emerging Companies | 2,702.5 | -1.20% |
Currency | ||
| AUD/USD | 0.7022 | -0.15% |
US Futures | ||
| S&P 500 | 7,652.25 | +0.50% |
| Dow Jones | 52,098.0 | +0.35% |
| Nasdaq | 28,808.5 | +0.96% |
Name | Value | % Chg |
|---|---|---|
Sector | ||
| Industrials | 8,289.0 | +0.77% |
| Consumer Discretionary | 3,707.5 | +0.65% |
| Communication Services | 1,591.3 | +0.20% |
| Energy | 11,043.9 | -0.11% |
| Information Technology | 1,617.7 | -0.20% |
| Utilities | 10,707.5 | -0.21% |
| Real Estate | 3,350.8 | -0.36% |
| Financials | 9,761.6 | -0.63% |
| Health Care | 34,515.2 | -0.76% |
| Materials | 21,913.8 | -1.35% |
| Consumer Staples | 12,994.5 | -1.39% |
ASX 200 Intraday Chart
Markets
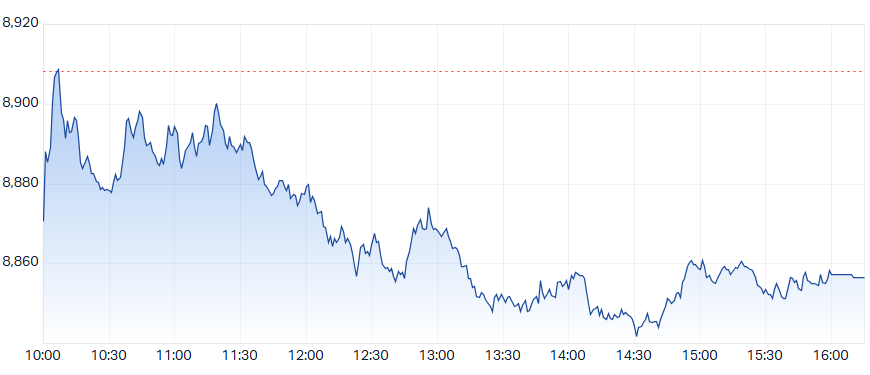
The S&P/ASX 200 (XJO) finished 51.6 points lower at 8,856.5, 0.6% from its session high and 0.17% from its low. In the broader-based S&P/ASX 300 (XKO) advancers lagged decliners by 126 to 151.
Industrials (XNJ) (+0.8%) was the session’s standout — and a notable anomaly. While resources stocks suffered their third straight session of losses, the companies that service mining and energy operations moved in the opposite direction, prospering on the expectation that capital works and maintenance programs won’t pause even as sentiment toward the commodities themselves sours. NRW Holdings (NWH) (+2.7%), Maas Group (MGH) (+2.6%), Worley (WOR) (+2.2%), and SRG Global (SRG) (+1.7%) all advanced.
Consumer Discretionary (XDJ) (+0.6%) logged a second consecutive positive session — a notably interesting positional bet ahead of tomorrow’s Melbourne Cup day rate decision, where money markets overwhelmingly expect the RBA to lift the cash rate by 25 basis points to 4.85%. Whether investors are front-running a “one-and-done” scenario or simply extending Thursday’s bargain-hunting trade, the sector found buyers. Cettire (CTT) (+6.3%) led the advance, with Temple & Webster (TPW) (+3.4%), Flight Centre (FLT) (+3.1%), and Super Retail Group (SUL) (+2.1%) all firming.
Energy (XEJ) (-0.1%) was effectively flat but still outperformed the broader market — ICE benchmark Brent crude oil futures fell -3.0% to US$110/bbl in Asian trade after surging 3.3% on Friday, which weighed on oil and gas stocks broadly. Uranium names were the clear standout: the spot uranium price capped its strongest week in nine months on Friday, and the momentum carried into Monday. Bannerman Energy (BMN) (+5.3%), Boss Energy (BOE) (+3.6%), Deep Yellow (DYL) (+2.8%), and Paladin Energy (PDN) (+1.5%) all advanced. Fuel refiners and retailers also held up: Ampol (ALD) (+1.9%) and Viva Energy (VEA) (+1.4%) both gained.
The Gold Sub-Index (XGD) (-2.8%) fell for a third consecutive session as local precious metals stocks took their cues from last week's sharp decline in gold and silver prices. COMEX benchmark gold futures had plunged 3.3% on Friday to 12-month lows, and while it steadied with a partial +0.7% recovery to US$3,924/oz in Asian trade on Monday, the psychological breach of the US$4,000 level has reset sentiment in the sector. Catalyst Metals (CYL) (-7.4%) and Northern Star Resources (NST) (-4.7%) led the selling, with Capricorn Metals (CMM) (-3.4%) and Newmont (NEM) (-2.3%) also lower.
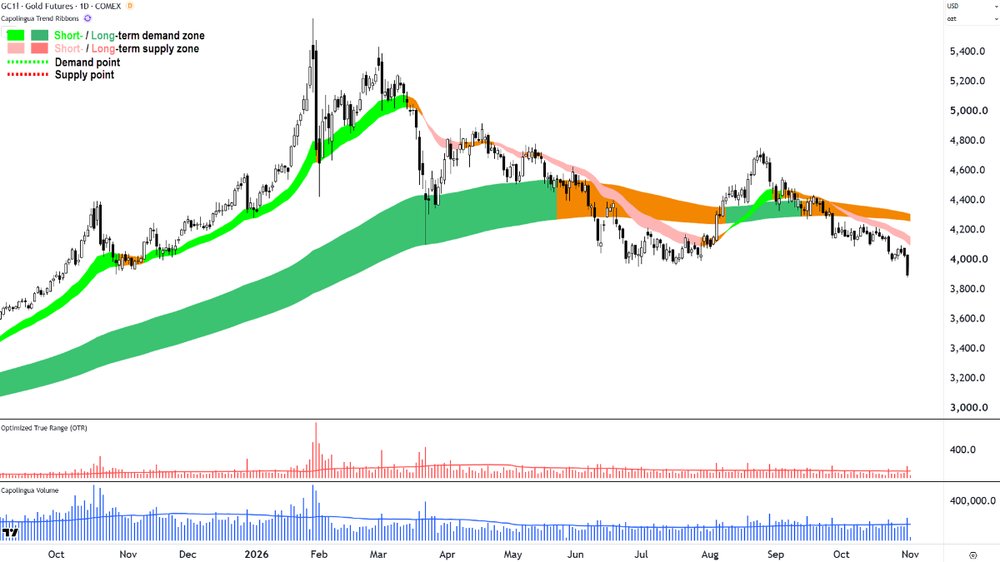
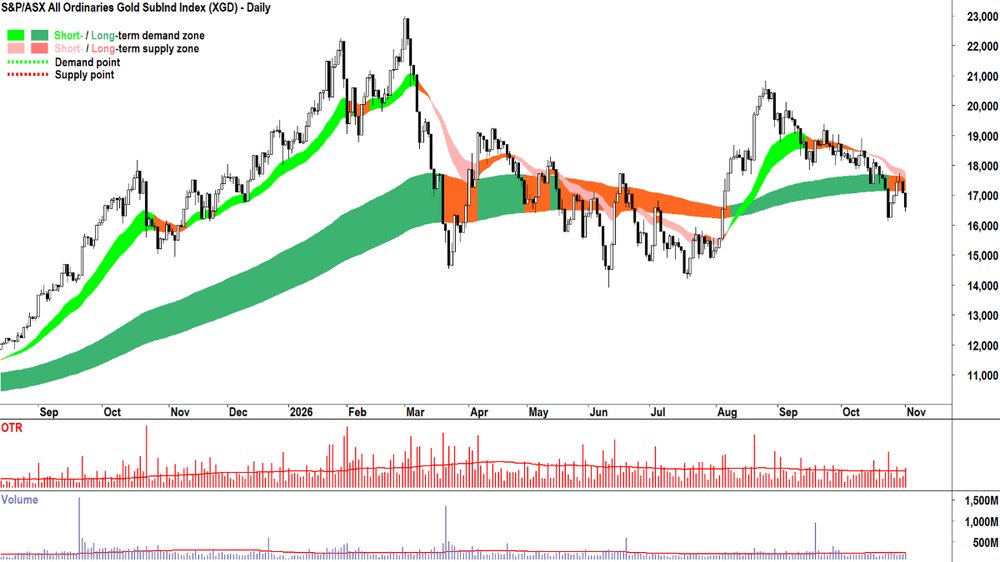
Gold Futures (Front month, back-adjusted) COMEX (top) and All Ord's Gold Sector Sub-Index (XGD) chart (bottom)
Materials (XMJ) (-1.3%) extended its losing run as the unravelling of the AI trade continued to drain capital from the base metals and critical minerals stocks that investors had positioned as their local proxy for artificial intelligence infrastructure spending. COMEX copper futures fell 1.8% on Friday before clawing back 0.7% in Asian trade. Nickel Industries (NIC) (-4.0%) and Sandfire Resources (SFR) (-1.9%) led the selling among base metals, while BHP (BHP) (-1.4%) and Rio Tinto (RIO) (-1.2%) both retreated.
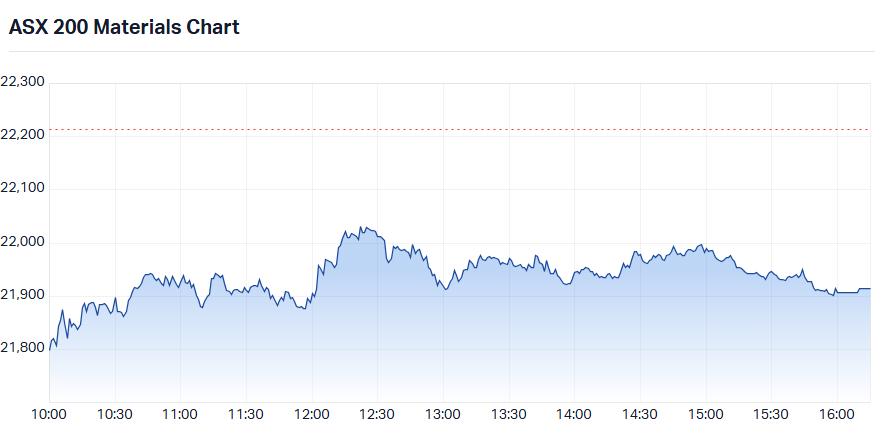
S&P/ASX 200 Materials Sector Index (XMJ) intraday chart
Lithium stocks remained in a world of pain — GFEX lithium carbonate futures bounced +3.1% to CNY91,260/t but it drew no buyers to the beaten down sector: Vulcan Energy Resources (VUL) (-5.2%), Core Lithium (CXO) (-4.8%), Liontown Resources (LTR) (-2.4%), Elevra Lithium (ELV) (-1.3%), and Pilbara Minerals (PLS) (-1.1%) all fell.
Consumer Staples (XSJ) (-1.4%) remained under pressure as Coles’ weak sales update from last week continued to shadow the sector. Woolworths (WOW) (-1.9%) and Coles Group (COL) (-1.8%) both fell.
Financials (XFJ) (-0.6%) lost ground as most of the major banks retreated ahead of tomorrow’s rate decision — a somewhat counterintuitive move given that banks typically benefit from higher rates, but one consistent with the broader caution gripping the market. AMP (AMP) (-7.5%) was the heaviest faller after the China Life profit miss, with QBE Insurance (QBE) (-1.4%), National Australia Bank (NAB) (-1.4%), and Commonwealth Bank of Australia (CBA) (-1.0%) also lower.
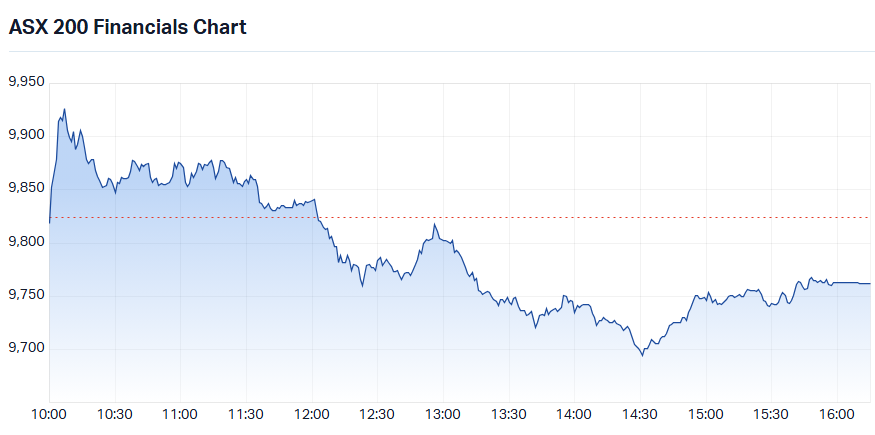
S&P/ASX 200 Financials Sector Index (XFJ) intraday chart
Today's best ASX Top 300 gainers
Company | Last Price | Change $ | Change % | 1mo % | 1yr % |
|---|---|---|---|---|---|
| 4DMedical (4DX) | $2.60 | +$0.16 | +6.6% | -40.4% | +49.4% |
| Reece (REH) | $18.11 | +$1.02 | +6.0% | +9.0% | +54.9% |
| Nufarm (NUF) | $3.35 | +$0.18 | +5.7% | +5.3% | +61.1% |
| Bannerman Energy (BMN) | $3.55 | +$0.18 | +5.3% | +6.3% | -3.5% |
| Silex Systems (SLX) | $3.49 | +$0.16 | +4.8% | -16.7% | -66.2% |
| Perenti (PRN) | $2.05 | +$0.08 | +4.1% | -7.2% | -24.4% |
| Nine Entertainment Co. Holdings (NEC) | $0.695 | +$0.025 | +3.7% | +2.2% | -40.1% |
| Heartland Group Holdings (HGH) | $1.003 | +$0.033 | +3.4% | -2.2% | +6.1% |
| Liberty Financial Group (LFG) | $3.48 | +$0.11 | +3.3% | +8.4% | -15.5% |
| Flight Centre Travel Group (FLT) | $11.70 | +$0.35 | +3.1% | +14.1% | -5.0% |
| LendLease Group (LLC) | $2.36 | +$0.07 | +3.1% | -13.2% | -57.5% |
| Centuria Capital Group (CNI) | $1.19 | +$0.035 | +3.0% | 0.0% | -49.4% |
| SGH (SGH) | $41.99 | +$1.23 | +3.0% | +13.5% | -13.4% |
| Virgin Australia Holdings (VGN) | $2.48 | +$0.07 | +2.9% | -10.8% | -25.1% |
| BSP Financial Group (BFL) | $7.84 | +$0.22 | +2.9% | +0.4% | -2.0% |
| BCI Minerals (BCI) | $0.54 | +$0.015 | +2.9% | -12.9% | +40.3% |
| NRW Holdings (NWH) | $6.47 | +$0.17 | +2.7% | -19.4% | +33.4% |
| MAAS Group Holdings (MGH) | $3.96 | +$0.10 | +2.6% | -43.0% | -16.6% |
| EBOS Group (EBO) | $17.04 | +$0.43 | +2.6% | +10.4% | -32.5% |
| Barrenjoey Group (BJY) | $7.98 | +$0.19 | +2.4% | -2.4% | -17.0% |
Today's worst ASX Top 300 losers
Company | Last Price | Change $ | Change % | 1mo % | 1yr % |
|---|---|---|---|---|---|
| St Barbara (SBM) | $0.71 | -$0.115 | -13.9% | -11.2% | +37.9% |
| Helia Group (HLI) | $4.99 | -$0.43 | -7.9% | +1.2% | -7.4% |
| AMP (AMP) | $2.35 | -$0.19 | -7.5% | -6.7% | +31.7% |
| Catalyst Metals (CYL) | $3.63 | -$0.29 | -7.4% | -37.4% | -46.5% |
| GQG Partners Inc. (GQG) | $0.90 | -$0.065 | -6.7% | -20.0% | -42.5% |
| Develop Global (DVP) | $3.67 | -$0.24 | -6.1% | -15.0% | +3.1% |
| ResMed Inc. (RMD) | $33.46 | -$2.05 | -5.8% | +6.1% | -15.4% |
| Capstone Copper Corp. (CSC) | $11.27 | -$0.57 | -4.8% | -19.8% | -18.0% |
| Electro Optic Systems Holdings (EOS) | $8.11 | -$0.41 | -4.8% | -27.7% | +30.6% |
| Chrysos Corporation (C79) | $6.78 | -$0.34 | -4.8% | +3.2% | -15.8% |
| Northern Star Resources (NST) | $24.07 | -$1.20 | -4.7% | +1.3% | -2.2% |
| Mesoblast (MSB) | $2.16 | -$0.10 | -4.4% | +4.3% | -13.9% |
| Greatland Resources (GGP) | $9.42 | -$0.43 | -4.4% | -8.4% | +32.1% |
| Deterra Royalties (DRR) | $3.80 | -$0.16 | -4.0% | -5.9% | -6.9% |
| Dicker Data (DDR) | $14.49 | -$0.61 | -4.0% | -6.2% | +41.4% |
| Nickel Industries (NIC) | $0.595 | -$0.025 | -4.0% | -21.2% | -19.6% |
| L1 Global Long Short Fund (GLS) | $1.855 | -$0.075 | -3.9% | -5.9% | +14.4% |
| Bellevue Gold (BGL) | $1.345 | -$0.05 | -3.6% | -14.3% | +15.0% |
| Fisher & Paykel Healthcare Corporation (FPH) | $36.79 | -$1.34 | -3.5% | -1.5% | +13.8% |
| Minerals 260 (MI6) | $0.715 | -$0.025 | -3.4% | -15.9% | +138.3% |
Chartwatch
Nasdaq Composite Index
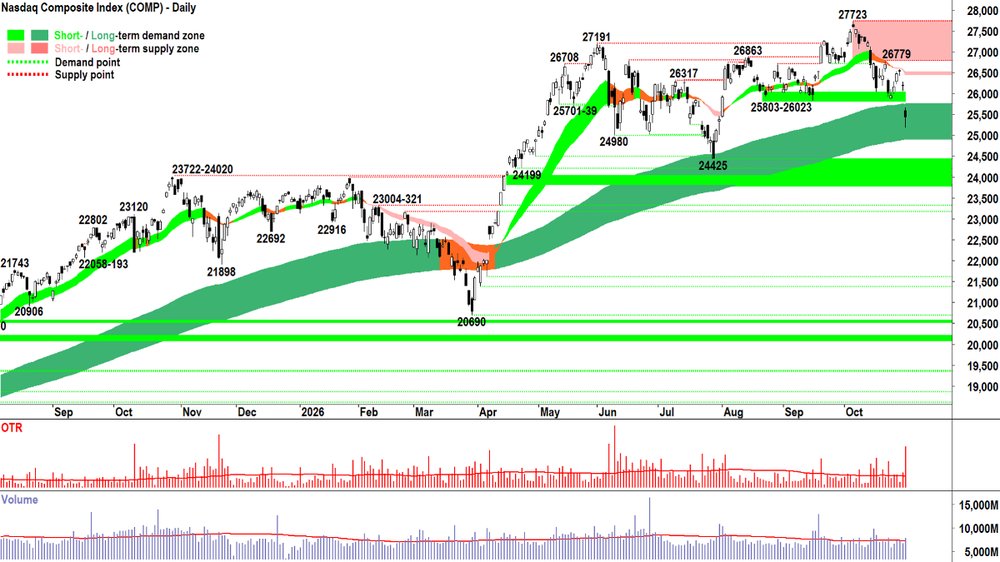
Nasdaq Composite Index chart
Analysis
And that’s kinda the problem with sitting on the fence…
Particularly if it’s a picket fence….
It can get quite uncomfortable at times. 🫤
But I’d rather be on the fence… with 50% invested and 50% in CASH — blissfully ignorant of the ructions in the AI trade — than fully invested and pooping my pants! 😉
And spare a thought, just for one second, for those who remain fully invested.
All the emotions going through their minds… praying the Comp bounces… just like it has… every other time.
“Surely, it must go back up! Surely stocks are too cheap here! It’s just a pullback. Let me buy the dip! I’ll be laughing when it makes a new high. Think of all the money I will make. You lot just don’t understand, this time it’s different!”
(Secretly… you know… pants! 🙏)
I’m not laughing at those poor souls who haven’t yet discovered the revelation that is Trend Following + Manage Risk, aka, My Technical Model…
Nope, I’ve been there... too many painful times before! 🤦
It sucks. I feel sick right now typing this even thinking about it. It’s one of the worst feelings of dread you can have.
But at some point, a very long time ago, after LOSING IT ALL for about the hundredth time, I committed to NEVER feeling like that again.
Not “never losing money” again. Because losing money is part and parcel of investing. Investing = putting money at risk of loss. You must lose at some time. 100% it will happen — so get used to it!
So, manage risk appropriately. Trust the market knows more than you do. Only deal in MOTN. Allocate risk accordingly. And take that loss. It’s like eating breakfast.
Do you remember what you had for breakfast last Tuesday?
Nope, because it was such an insignificant event in your life. You do it every day, then you get on with your day.
But you MUST eat breakfast, because it’s good for you (yeah, yeah, unless you’re one of those intermittent fasters!).
Anyways, back to the picket fence. 50% invested probably sucks a bit right now. But consider:
Some of that exposure must be allocated to shorts… that’s just my rule
There are still good uptrends out there… and even in the worst bear markets there will be stocks that rise in strong and low volatility uptrends… it’s our job to find them and stick with them
We still have 50% of our capital safe and sound in cash 🤑
Ka-ching! That last one is a doosy.
Not because we predicted the downfall of the greatest innovation in our lifetimes (i.e., the AI trade), simply because we FOLLOWED the money. We monitored wow S increased to meet demand, and then eventually, overcome it.
At least in the short term. The long term trend, as we can see by that beautiful dark green caterpillar still crawling bottom-left-top right up the chart above… remains D > S = P ⬆️.
I won’t labour the rest of the analysis here… if I’ve done my job right, you can do that perfectly well yourself (i.e., trends, price action, candles, volatility, volume).
Suffice it to say, anything greater than 1/2RP is off the table. But should we go further? Should we go to max risk of 1/3RP? 🤔
On this point, I note Friday’s downward pointing shadow = BTD. It’s smack-bang in the long term trend ribbon — a zone which we equate to dynamic excess demand.
Why? 🤷
None of us know. And I expect most of us have stopped caring. It just is! 🙌
Well, MOTN it just is. So, let’s see how the Comp goes at the dark green caterpillar. We’re playing it cool like Fonzie, anyway. Obviously, if we begin to see the hallmarks of long term trend change:
Long term trend ribbon turns amber and starts to contract
Price closes below the long term trend ribbon
Long term trend ribbon begins to act as a zone of dynamic excess supply (i.e., peaks are formed within or below the long term trend ribbon)
Then we must move to Max Risk = 1/3RP. That’s it. No emotions required.
Just Analyse, Accept, and Act. 💪💪💪
View
I am 1/2RP on US stocks (RP = Risk Position – it reflects my personal allowable capital allocation limit for my investments in US stocks. So 1/2RP is 50%, 2/3RP is 67% and FRP is 100%).
Key Levels
26779 is the closest key point of supply, but the short term trend ribbon will also likely act as a dynamic zone of supply (presently 26558–26586). 25803-26023 is the closest key zone of demand.
S&P/ASX 200 (XJO)
Analysis
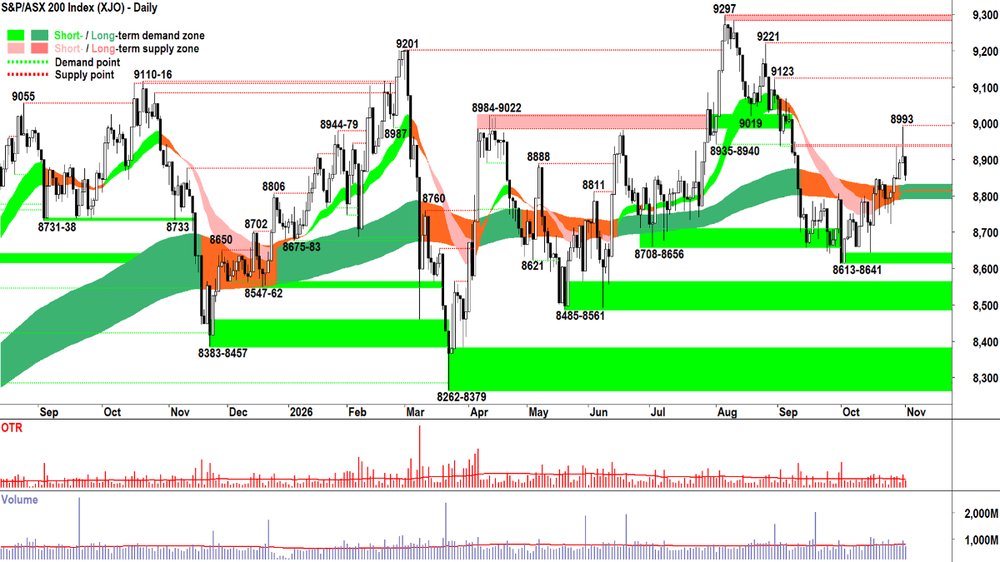
Friday’s & today’s candles:
Friday: Long upward pointing shadow = Excess supply manifesting itself in the market… supply is moving in and potentially taking control of the price
Today: Black body = Supply has taken control of the price
Also consider: Candles with lower highs and lower lows = Short term downtrend = Forms 8993 as a point of supply.
Given the proximity to the 8935-8940 supply zone = We’ve found a pocket of supply!
And given the length of Friday’s shadow, it could prove to be a little pesky.
But, the trend ribbons aren’t too far away, and ordinarily, we’d expect them to act as a dynamic zone of excess demand. So, perhaps we’re on the verge of a trading range… within a trading range… (within a… 🦓🦓🦓).
Kinda sounds like that Leonardo Di Caprio movie!
A trading range within a trading range within a trading range...
There’s absolutely nothing in this chart that’s inspiring me to change my present view that the MOTN for the OTP = ➡️.
Fingers crossed, the trend ribbons hold, and that view gets upgraded to “➡️⬆️” (i.e., “sideways-to-up”).
That’s the Analysis and Accept. Act? Nope, nothing to do today. 😐
View
I am 1/2RP on Australian shares (i.e., 50% cash vs 50% invested, with some of the invested portion allocated to shorts).
Key Levels
8935-8940 is the closest zone of supply vs 8613-8641 is the critical zone of demand.
(Glossary of acronyms! Old Tin Pot (OTP): S&P/ASX 200 | MOTN: More Often Than Not | FOMO: Fear Of Missing Out | HOFU: Holding On For Upside | BTD: Buy The Dip | NUTE: No Urgency To Enter | FOHO: Fear Of Holding On | STR: Sell The Rally | RP: Risk Position | FFS: Fund Flow Shenanigans!)
***CHARTWATCH LIVE IS BACK!!!***
ChartWatch LIVE Webinars – WEEKLY Wednesday's @ 12pm AEDT
Learn more about technical analysis and trend following through real case studies on ASX stocks. Australia's premier technical analyst, Carl Capolingua, shares his unique insights on stocks as requested by viewers. Ask about a company in your portfolio or anything related to trading and investing and get Carl's expert opinion.
Places are limited so >REGISTER NOW!<
Economy
TODAY
AUS Data:
MI Inflation Gauge October: +0.5% m/m vs +0.3% m/m (annualise +0.5% m/m and you get +6% p.a.!)
Building Approvals: +5.1% m/m vs +1.8% m/m forecast and -5.2% m/m in September (revised from -6.1%) (typically volatile, no great trend here)
LATER THIS WEEK
TONIGHT
USA October ISM Manufacturing PMI (54.5 forecast, unchanged)
TUESDAY
11:30 Cup Day + RBA Board meeting
Cash rate: +0.25% p.a. forecast to 4.85% p.a. ⚠️
Press conference with Gov Bullock at 12:30pm
All Day US Congressional Elections
WEDNESDAY
08:30 AUS October Consumer Spending (+0.2% m/m forecast vs +0.0% m/m in September)
USA October ISM Service PMI (54.9 forecast, unchanged)
THURSDAY
UK Bank of England Official Rate (+0.25% p.a. forecast to 4.00% p.a.)
FRIDAY
21:30 USA October Non-Farm Payroll Data
Employment change: +63,000 forecast v s+29,000 in September
Average hourly earnings: +0.3% m/m forecast vs +0.1% m/m in September
Unemployment rate: +4.2% forecast, unchanged
Interesting Movers
Trading higher
- Humm Group (HUM) $0.47+13.3%
Released an update for the September quarter. Management said the company delivered "strong" 1Q27 operating momentum, with 13.7% volume growth vs pcp across Commercial and Consumer. Group net interest margin (NIM) stable and a 350 bps improvement in underlying cost-to-income ratio. Credit performance remained "sound".
- KMD Brands (KMD) $1.67+11.4%
Announced that it has entered into an exclusivity agreement with Bluestar Alliance LLC, a US-based consumer brand group, to allow it to undertake due diligence regarding potentially acquiring all of the shares in KMD. Discussions are ongoing with
exclusivity able to be extended if specified conditions are met, subject to a "long stop" date of 23 December. - 4DMedical (4DX) $2.66+9.0%
Responded to ASX query regarding Friday's collapse. Management said they're not aware of any reason for the decline, hinting that short sellers may be to blame.
- Invictus Energy (IVZ) $0.07+6.6%
Announced formal agreement with Zimbabwe government regarding Cabora Bassa Project confirmed.
- Orthocell (OCC) $0.57+4.1%
Provided an update on the US commercial performance for its nerve repair product Remplir. A record 92 units were sold in October, generating AU$279,000 in revenue and representing an 84% uplift on the average monthly sales of 50 units during Q1 FY27.
- Solstice Minerals (SLS) $2.00+3.6%
Reported drilling results from its Nanadie gold project in WA. Highlights included 41m @ 2.79% Cu, 0.70g/t Au and 22.2m @ 0.80% Cu, 0.32g/t Au.
Trading Lower
- Macro Metals (M4M) $0.01-23.1%
Announced that it has signed binding agreement to sell its Agbaja iron ore project in Nigeria for US$5.67m. Management expects net proceeds and about $7.7 million in cash after completion. Proceeds will fund WA businesses, mining services growth and drilling.
- St Barbara (SBM) $0.71-13.6%
Announced that Canada’s federal regulator has called for its own impact assessment for the 15‑Mile Processing Hub, clouding the permitting timeline. The company and government to work out implications over coming weeks. Also announced the restart of processing at Touquoy, and a $100 million on‑market buyback.
- Turaco Gold (TCG) $0.69-10.1%
Announced a $120 million equity raise and accompanying $10 million share placement at $0.60. Funds raised will be used to consolidate ownership of the Afema gold project through the buyout of minority partner Sodim’s 20% stake.
- Dateline Resources (DTR) $0.07-10.0%
Announced an update on US legal proceedings affecting the Colosseum Gold‑REE project. The District Court judge who ordered the August 2026 preliminary injunction has denied the stay applications by the company and the US government. Management is considering next steps. DTR is a regular in the ChartWatch ASX Scans Downtrends List. 📉
- Centaurus Metals (CTM) $0.32-9.2%
No news. Performance reflected general weakness in the broader materials sector. CTM is a regular in the ChartWatch ASX Scans Downtrends List. 📉
- Elsight (ELS) $1.65-8.8%
Announced a review of capital management, revenue reporting and corporate governance. The company held ~US$59.4 million cash with no borrowings. Management will consider a formal capital allocation framework (including a minimum cash reserve) and an on‑market buy‑back, plus additional quarterly reporting of orders, secured backlog and receipts. ELS is a regular in the ChartWatch ASX Scans Downtrends List. 📉
- Catalyst Metals (CYL) $3.62-7.7%
No news. Performance reflected general weakness in the broader precious metals sector. CYL is a regular in the ChartWatch ASX Scans Downtrends List. 📉
- AMP (AMP) $2.38-6.5%
Management said it was “not aware” of any unannounced information explaining recent trading activity but noted a China Life Pension Company September quarter solvency report (CLPC’s quarterly net profit was lower) which “may have contributed to the observed market activity”. Management maintained the news had no effect on its FY27 guidance.
- ResMed Inc. (RMD) $33.35-6.1%
Announced September quarter results. Revenue up 5.9% and net income up 20% vs pcp (boosted by a US$61.8 million gain on divestment). Operating cash flow down and cash fell after ~US$936.4 million spent on share buybacks. Quarterly dividend is up 10% to US$0.66.
Broker Moves
Company | Broker | Action | Rating | Price Target |
|---|---|---|---|---|
AISAeris Resources | Bell Potter | Retained | Buy | $0.90 |
ALCAlcidion Group | Bell Potter | Retained | Buy | $0.15 |
AMPAMP | Macquarie | Retained | Outperform | $2.80 |
ANZANZ Group Holdings | Citi | Retained | Buy | $41.00 |
| Morgan Stanley | Retained | Overweight | $35.50 | |
BENBendigo and Adelaide Bank | UBS | Retained | Neutral | $10.50 |
BHPBHP Group | Morgan Stanley | Retained | Overweight | $68.00 |
BOQBank of Queensland | UBS | Retained | Neutral | $6.80 |
BPTBeach Energy | Morgan Stanley | Retained | Equal Weight | $0.93 |
BRLBathurst Resources | Ord Minnett | Retained | Speculative Buy | $0.74(from $0.80) |
CBACommonwealth Bank of Australia | Morgan Stanley | Retained | Underweight | $125.00 |
| UBS | Retained | Sell | $135.00 | |
CCLCuscal | Ord Minnett | Retained | Buy | $7.00 |
CIAChampion Iron | Macquarie | Retained | Outperform | $4.80 |
CMMCapricorn Metals | Bell Potter | Retained | Buy | $18.10 |
COLColes Group | Bell Potter | Retained | Hold | $21.90(from $24.40) |
| Citi | Retained | Neutral | $22.00(from $24.00) | |
| Macquarie | Retained | Outperform | $24.00 | |
| Morgan Stanley | Retained | Overweight | $26.10 | |
| Morgans | Retained | Accumulate | $24.30(from $25.40) | |
| Ord Minnett | Downgraded | Hold(from Buy) | $22.50(from $26.50) | |
| UBS | Retained | Neutral | $22.50(from $25.50) | |
CSCCapstone Copper Corp. | Barrenjoey | Retained | Overweight | $14.00(from $15.00) |
| UBS | Retained | Buy | $18.00 | |
CSLCSL | Morgan Stanley | Retained | Overweight | $200.00 |
CVLCivmec | Bell Potter | Retained | Buy | $2.30(from $2.20) |
CYLCatalyst Metals | Bell Potter | Retained | Buy | $9.85(from $12.80) |
| Canaccord Genuity | Retained | Buy | $9.75(from $11.80) | |
| UBS | Retained | Buy | $6.50(from $9.75) | |
DRRDeterra Royalties | Morgan Stanley | Retained | Equal Weight | $3.95 |
EDVEndeavour Group | Bell Potter | Retained | Hold | $3.30(from $3.10) |
| Morgan Stanley | Retained | Underweight | $2.85 | |
| Morgans | Retained | Trim | $2.95 | |
| UBS | Retained | Neutral | $3.50(from $3.25) | |
EMREmerald Resources NL | Canaccord Genuity | Upgraded | Buy(from Hold) | $7.30(from $7.40) |
| UBS | Retained | Buy | $9.25 | |
EOLEnergy One | Ord Minnett | Retained | Buy | $20.00 |
FHEFrontier Energy | Ord Minnett | Retained | Speculative Buy | $0.37 |
G6MGroup 6 Metals | Canaccord Genuity | Retained | Buy | $4.70 |
GHMGolden Horse Minerals | Canaccord Genuity | Retained | Speculative Buy | $1.50 |
GMGGoodman Group | Morgan Stanley | Retained | Overweight | $36.15 |
GYGGuzman Y Gomez | Citi | Retained | Neutral | $27.25 |
HLIHelia Group | Macquarie | Retained | Underperform | $3.65(from $3.80) |
IGOIGO | Morgan Stanley | Retained | Equal Weight | $6.40 |
| Ord Minnett | Retained | Buy | $9.00 | |
ILUIluka Resources | Morgan Stanley | Retained | Overweight | $7.05 |
IMAImage Resources NL | Macquarie | Retained | Outperform | $0.10 |
INRioneer | Ord Minnett | Retained | Speculative Buy | $0.56(from $0.54) |
IPDImpediMed | Bell Potter | Retained | Speculative Buy | $0.01(from $0.02) |
JDOJudo Capital Holdings | UBS | Retained | Neutral | $1.05 |
KARKaroon Energy | Morgan Stanley | Retained | Overweight | $1.84 |
KCNKingsgate Consolidated | Canaccord Genuity | Retained | Buy | $8.40(from $8.75) |
L1GL1 Group | Bell Potter | Upgraded | Buy(from Hold) | $1.40 |
LOTLotus Resources | Barrenjoey | Retained | Neutral | $0.50 |
LTRLiontown | Ord Minnett | Upgraded | Buy(from Hold) | $0.95 |
LYCLynas Rare Earths | Morgan Stanley | Retained | Overweight | $14.65 |
M7TMach7 Technologies | Morgans | Retained | Buy | $0.48 |
MEIMeteoric Resources | Ord Minnett | Retained | Hold | $0.25 |
MEKMeeka Metals | Morgans | Retained | Buy | $0.16(from $0.17) |
MP1Megaport | Citi | Retained | Buy | $28.85 |
MQGMacquarie Group | Morgan Stanley | Retained | Overweight | $273.00 |
MSBMesoblast | Bell Potter | Retained | Buy | $4.20(from $4.40) |
NABNational Australia Bank | Citi | Retained | Buy | $42.10 |
| Morgan Stanley | Retained | Underweight | $34.00 | |
NHFNIB Holdings | Citi | Retained | Neutral | $7.15 |
ORGOrigin Energy | Macquarie | Retained | Neutral | $11.40(from $11.10) |
| Morgan Stanley | Retained | Underweight | $10.42 | |
| Ord Minnett | Downgraded | Hold(from Accumulate) | $11.30 | |
| UBS | Retained | Buy | $13.25(from $13.35) | |
PDIPDI Gold | Canaccord Genuity | Retained | Speculative Buy | $7.45(from $7.40) |
PENPeninsula Energy | Canaccord Genuity | Retained | Speculative Buy | $0.70(from $0.75) |
PLSPLS Group | Citi | Retained | Buy | $5.50 |
PNIPinnacle Investment Management Group | Macquarie | Retained | Outperform | $22.81(from $23.95) |
| Morgans | Retained | Buy | $22.62(from $23.41) | |
REHReece | Morgans | Retained | Hold | $17.40(from $17.00) |
| Ord Minnett | Retained | Buy | $20.80 | |
RIORio Tinto | Morgan Stanley | Retained | Underweight | $146.00 |
RMDResMed Inc. | Macquarie | Retained | Outperform | $47.50 |
| Ord Minnett | Downgraded | Accumulate(from Buy) | $37.50(from $36.20) | |
RSGResolute Mining | Barrenjoey | Retained | Overweight | $1.60 |
SLDSaluda Medical, Inc. | Bell Potter | Retained | Speculative Buy | $1.00(from $1.30) |
SLSSolstice Minerals | Canaccord Genuity | Retained | Speculative Buy | $4.05 |
STOSantos | Morgan Stanley | Retained | Overweight | $9.25 |
STXStrike Energy | Bell Potter | Retained | Speculative Buy | $0.15(from $0.16) |
SULSuper Retail Group | Ord Minnett | Retained | Buy | $16.50(from $17.50) |
TCGTuraco Gold | Barrenjoey | Retained | Overweight | $1.35(from $1.40) |
TTTTitomic | Bell Potter | Retained | Speculative Buy | $0.27(from $0.46) |
VFYVitrafy Life Sciences | Morgans | Retained | Speculative Buy | $5.06 |
WBCWestpac Banking Corporation | Citi | Retained | Neutral | $36.10 |
| Macquarie | Retained | Underperform | $30.00 | |
| Morgan Stanley | Retained | Underweight | $30.00 | |
WHCWhitehaven Coal | Morgan Stanley | Retained | Overweight | $8.95 |
WRKwrkr | Bell Potter | Retained | Speculative Buy | $0.12 |
XROXero | Morgan Stanley | Retained | Overweight | $130.00 |
Scans
Top Gainers
Code | Company | Last | % Chg |
|---|---|---|---|
| TSR | Turnstone Resources Ltd | $0.024 | +50.00% |
| KYN | Kyron Capital Group | $0.02 | +42.86% |
| GT1 | Green Technology Metals Ltd | $0.018 | +28.57% |
| ALV | Alvo Minerals Ltd | $0.085 | +26.87% |
| NOR | Norwood Systems Ltd | $0.019 | +26.67% |
Top Fallers
Code | Company | Last | % Chg |
|---|---|---|---|
| IGN | Ignite Ltd | $0.395 | -36.80% |
| ADX | ADX Energy Ltd | $0.012 | -29.41% |
| USC | US1 Critical Minerals Ltd | $0.013 | -27.78% |
| NUZ | Neurizon Therapeutics Ltd | $0.065 | -24.42% |
| PIQ | Proteomics International Laboratories Ltd | $0.091 | -24.17% |
52 Week Highs
Code | Company | Last | % Chg |
|---|---|---|---|
| REH | Reece Ltd | $18.11 | +5.97% |
| ASV | Asset Vision Co Ltd | $0.055 | +5.77% |
| NUF | Nufarm Ltd | $3.35 | +5.68% |
| CUP | Count Ltd | $1.70 | +2.72% |
| TWE | Treasury Wine Estates Ltd | $6.25 | +1.30% |
52 Week Lows
Code | Company | Last | % Chg |
|---|---|---|---|
| IGN | Ignite Ltd | $0.395 | -36.80% |
| ADX | ADX Energy Ltd | $0.012 | -29.41% |
| PIQ | Proteomics International Laboratories Ltd | $0.091 | -24.17% |
| KNI | Kuniko Ltd | $0.02 | -16.67% |
| RNT | Rent.com.Au Ltd | $0.041 | -16.33% |
Near Highs
Code | Company | Last | % Chg |
|---|---|---|---|
| BEAR | Betashares Australian Equities Bear Complex ETF | $7.42 | +0.27% |
| RHC | Ramsay Health Care Ltd | $55.75 | +0.27% |
| OZBD | Betashares Australian Composite Bond ETF | $43.02 | -0.56% |
| AN3PI | Australia and New Zealand Banking Group Ltd | $102.71 | +0.06% |
| PCI | Perpetual Credit Income Trust | $1.07 | -0.47% |
Relative Strength Index (RSI) Oversold
Code | Company | Last | % Chg |
|---|---|---|---|
| ETPMPM | Global X Metal Securities Australia Ltd | $330.04 | -2.00% |
| GLDN | iShares Physical Gold ETF | $44.06 | -2.18% |
| GDX | Vaneck Gold Miners ETF | $95.95 | -3.08% |
| BHM | Broken Hill Mines Ltd | $0.43 | -7.53% |
| MRT | Maritana Minerals Ltd | $0.49 | -5.77% |