
The ASX 200 slid as a broad risk-off wave, driven by AI jitters and an ongoing commodities rout, swept global markets. Gold miners, base metals miners and energy stocks bore the brunt, while telcos, tech and healthcare held firm.
Be sure to click/scroll through for the usual reporting of the major sector and stock-specific moves, the broker responses to them, as well as all the key economic data in tonight's Evening Wrap. Also, I have detailed technical analysis on the Nasdaq Composite and the S&P/ASX 200 in today's ChartWatch.
Let’s dive in!
Today in Review
Name | Value | % Chg |
|---|---|---|
Major Indices | ||
| ASX 200 | 8,730.4 | -1.04% |
| All Ords | 8,836.6 | -1.07% |
| Small Ords | 3,054.2 | -1.40% |
| All Tech | 2,988.9 | +0.37% |
| Emerging Companies | 2,663.4 | -1.96% |
Currency | ||
| AUD/USD | 0.6688 | -0.38% |
US Futures | ||
| S&P 500 | 7,400.5 | +0.82% |
| Dow Jones | 50,531.0 | +0.51% |
| Nasdaq | 27,573.5 | +1.42% |
Name | Value | % Chg |
|---|---|---|
Sector | ||
| Communication Services | 1,659.0 | +1.05% |
| Information Technology | 1,811.0 | +0.96% |
| Health Care | 35,186.7 | +0.83% |
| Consumer Discretionary | 3,700.6 | -0.10% |
| Financials | 9,614.8 | -0.32% |
| Industrials | 8,496.6 | -0.33% |
| Consumer Staples | 13,593.9 | -0.41% |
| Real Estate | 3,461.0 | -0.57% |
| Utilities | 10,880.3 | -0.85% |
| Energy | 9,995.9 | -2.08% |
| Materials | 20,530.1 | -3.69% |
ASX 200 Intraday Chart
Markets
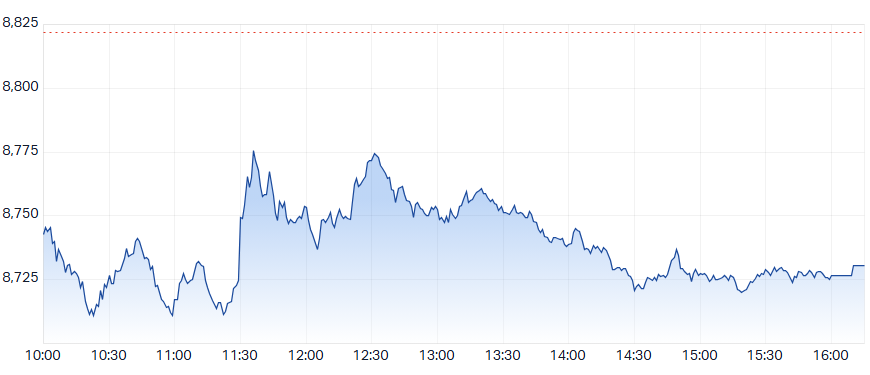
The S&P/ASX 200 (XJO) finished 91.4 points lower at 8,730.4, 1% from its session high and just 0.2% from its low. In the broader-based S&P/ASX 300 (XKO) advancers lagged decliners by a disappointing 93 to 191.
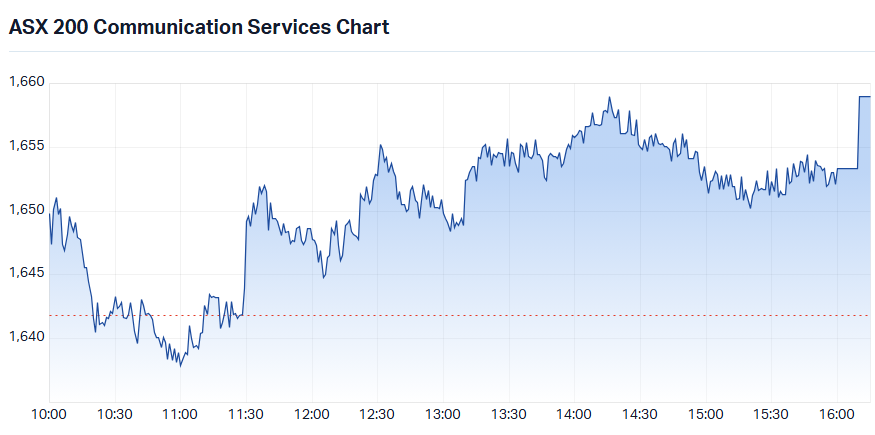
Communication Services (XTJ) (+1.0%) topped the leaderboard as money went into the most defensive corners of the market. Superannuation guarantee money rolls in every day, and even on a bad day it has to go somewhere. The big telcos were the best as a group – demand for cat videos goes up in a recession! Telstra Group (TLS) (+1.6%) and Spark New Zealand (SPK) (+1.1%) led the charge, while TPG Telecom (TPG) (+0.7%) also gained.
S&P/ASX 200 Communication Services Sector Index (XTJ) intraday chart
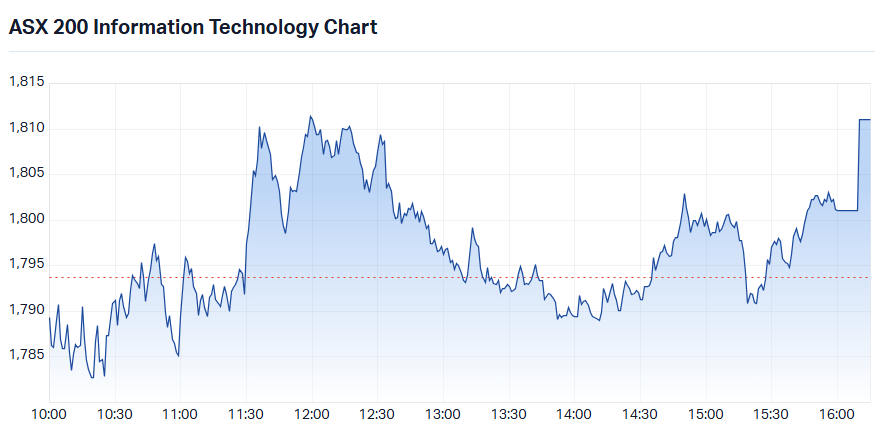
Information Technology (XIJ) (+1.0%) repeated a now-familiar pattern: the US AI trade goes down, local tech goes up. Nvidia’s post-earnings rally fizzled overnight on Wall Street, but many local tech names fell during the AI boom and appear to be drawing some value buying as their overseas counterparts lose ground. Nextdc (NXT) (+4.3%) and Megaport (MP1) (+3.5%) led the infrastructure names higher, while Life360 (360) (+4.0%) and Dicker Data (DDR) (+1.2%) also rallied.
S&P/ASX 200 Information Technology Sector Index (XIJ) intraday chart
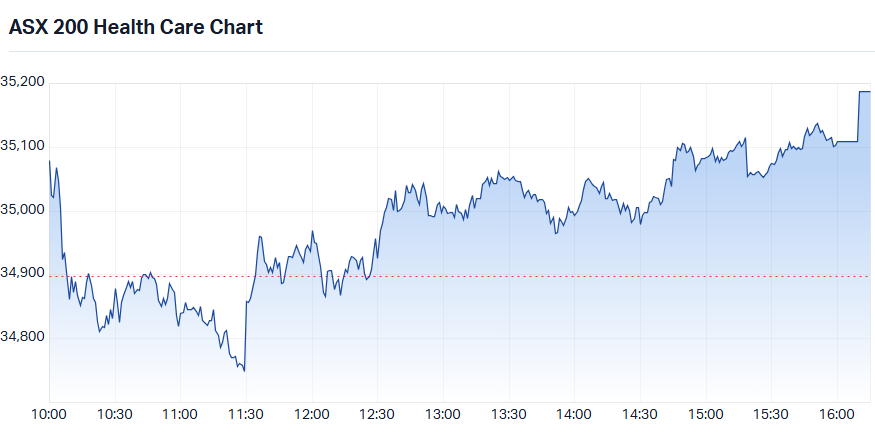
Health Care (XHJ) (+0.8%) did what it does best. Good economy or bad, AI boom or bust, people still get sick. Avita Medical (AVH) (+8.1%) was the standout, while pathology providers Sonic Healthcare (SHL) (+6.3%) and Healius (HLS) (+4.3%) also rallied strongly. Resmed (RMD) (+2.6%) rounded out the gains.
S&P/ASX 200 Health Care Sector Index (XHJ) intraday chart
Financials (XFJ) (-0.3%) lost ground but mostly played their usual role: defensive, big blue chips with a solid dividend yield. Once again, look at the biggest of the group. Commonwealth Bank of Australia (CBA) (+0.4%) posted a gain and beat its peers again. National Australia Bank (NAB) (-0.9%) was the weakest of the majors, while Westpac Banking Corporation (WBC) (-0.2%) and ANZ Group Holdings (ANZ) (-0.1%) edged lower.
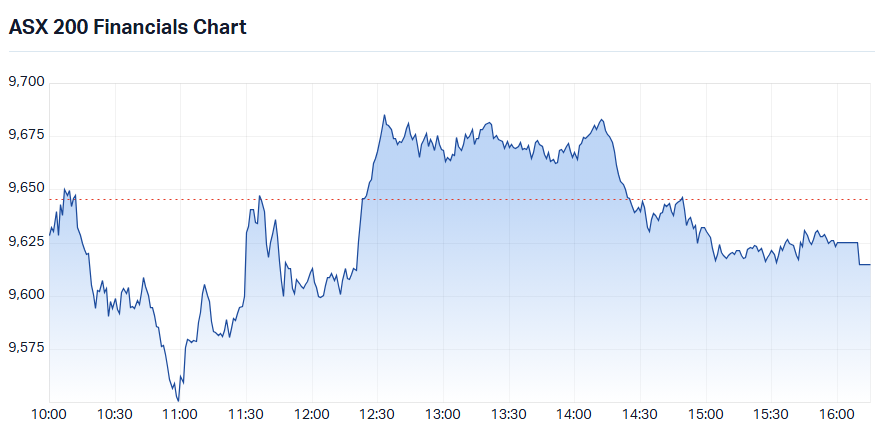
S&P/ASX 200 Financials Sector Index (XFJ) intraday chart
The Gold Sub-Index (XGD) (-5.6%) was the worst performer as gold stocks gave way under a very negative set of commodity price moves – and the trend is clearly down. COMEX gold futures fell 3.2% overnight and were flat at US$3,741.30/oz in Asian trade. COMEX silver futures slumped 4.9% overnight before edging up 0.8% to US$45.43/oz. Notably, the fall came even as US benchmark bond yields edged lower overnight. That is normally a tailwind for gold, which pays no yield. Emerald Resources (EMR) (-8.2%) and Ramelius Resources (RMS) (-6.3%) led the declines, while Northern Star Resources (NST) (-5.7%) and Genesis Minerals (GMD) (-5.6%) also fell.
Materials (XMJ) (-3.7%) fell hard as a broad risk-off tone put growth-dependent, cyclical companies under pressure. Copper led the rout. COMEX copper futures plunged 5.3% overnight, then edged up just 0.4% to US$5.695/lb in Asian trade. A slide in Dr Copper, so named for its record as a barometer of economic health, is not a great signal for global growth. But the metal was likely also a victim of the AI trade unwind. 29Metals (29M) (-7.7%) and Sandfire Resources (SFR) (-4.5%) led the copper miners lower, while Capstone Copper (CSC) (-3.3%) also fell.
Tin miner Metals X (MLX) (-10.4%) was among the hardest hit after London Metal Exchange tin plummeted 9.9% overnight.
The diversified majors were also hammered, and because they make up such a large share of the index, their falls dragged the broader market down further. South32 (S32) (-5.9%) led the declines, while Rio Tinto (RIO) (-4.1%) and BHP Group (BHP) (-3.7%) also tumbled.
Lynas Rare Earths (LYC) (+3.4%) was one of the very few standouts after NdPr prices in China rose 0.62% to CNY 726,000/t.
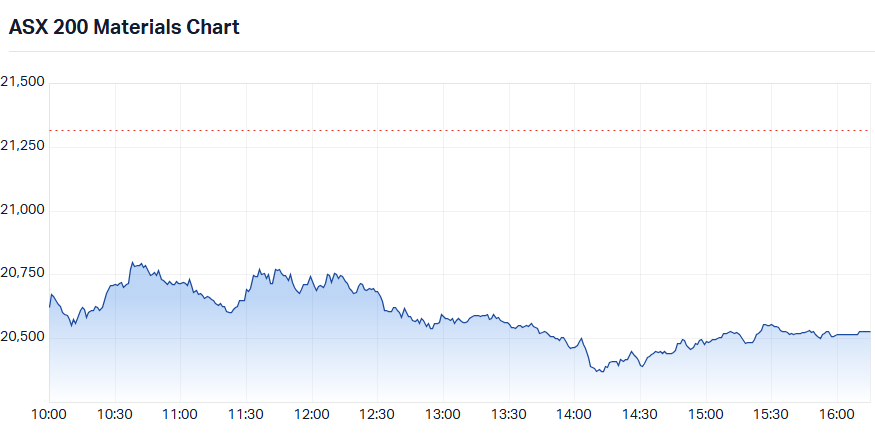
S&P/ASX 200 Materials Sector Index (XMJ) intraday chart
Energy (XEJ) (-2.1%) fell on lower oil and coal prices. The spot price of Brent crude fell 2.5% overnight. ICE Brent crude futures steadied in Asian trade, up 0.2% to US$92.16/bbl, as traders weighed reports that President Trump is considering fresh strikes on Iran. Volatility is super high at the moment, so investors must tread carefully. Karoon Energy (KAR) (-4.7%) and Beach Energy (BPT) (-2.3%) led the oil and gas producers lower, while Woodside Energy Group (WDS) (-1.9%) and Santos (STO) (-1.9%) also fell.
Fuel refiner Ampol (ALD) (-2.7%) also slid.
Coal stocks fell as globalCoal Newcastle coal futures dropped 3.0% to US$141.65/t. Yancoal Australia (YAL) (-2.2%) and Whitehaven Coal (WHC) (-1.5%) both lost ground.
In other commodities moves, uranium stocks were as volatile as ever. COMEX uranium futures were unchanged at US$90/lb overnight, and the Sprott Uranium Miners ETF (URNM) fell only 1.7% in New York, yet local uranium stocks were hammered. Conclusion? Yet another casualty of the AI trade fallout: nuclear energy stocks had rallied on the belief that nuclear power will be needed to meet AI’s growing electricity demand. Paladin Energy (PDN) (-8.2%) and Boss Energy (BOE) (-5.0%) led the declines, while Deep Yellow (DYL) (-4.9%) and Bannerman Energy (BMN) (-2.4%) also fell.
Today's best ASX Top 300 gainers
Company | Last Price | Change $ | Change % | 1mo % | 1yr % |
|---|---|---|---|---|---|
| Chrysos Corporation (C79) | $6.70 | +$0.57 | +9.3% | -6.7% | -22.5% |
| Sonic Healthcare (SHL) | $21.33 | +$1.26 | +6.3% | +14.9% | -0.7% |
| 4DMedical (4DX) | $2.26 | +$0.11 | +5.1% | -44.7% | +57.5% |
| NEXTDC (NXT) | $9.70 | +$0.40 | +4.3% | +5.7% | -27.1% |
| Life360 Inc (360) | $22.20 | +$0.86 | +4.0% | +8.9% | -36.6% |
| Cobram Estate Olives (CBO) | $2.67 | +$0.10 | +3.9% | -4.3% | -12.5% |
| James Hardie Industries Plc (JHX) | $40.80 | +$1.49 | +3.8% | +10.0% | +51.6% |
| Megaport (MP1) | $17.15 | +$0.58 | +3.5% | +3.9% | +38.2% |
| Mercury NZ (MCY) | $5.67 | +$0.19 | +3.5% | +4.0% | +3.7% |
| Lynas Rare Earths (LYC) | $12.79 | +$0.42 | +3.4% | +15.5% | -17.2% |
| DroneShield (DRO) | $1.075 | +$0.035 | +3.4% | -31.1% | -45.4% |
| Air New Zealand (AIZ) | $0.315 | +$0.01 | +3.3% | +1.6% | -41.1% |
| Eagers Automotive (APE) | $14.70 | +$0.43 | +3.0% | -19.1% | -50.5% |
| The Star Entertainment Group (SGR) | $0.175 | +$0.005 | +2.9% | +45.8% | +105.9% |
| Fisher & Paykel Healthcare Corporation (FPH) | $40.61 | +$1.15 | +2.9% | +2.8% | +28.1% |
| Gemlife Communities Group (GLF) | $3.86 | +$0.10 | +2.7% | -4.5% | -22.5% |
| Reliance Worldwide Corporation (RWC) | $4.64 | +$0.12 | +2.7% | 0.0% | +20.5% |
| WebBeds Group (WEB) | $3.88 | +$0.10 | +2.6% | +11.8% | +1.0% |
| Regis Healthcare (REG) | $4.77 | +$0.12 | +2.6% | +6.0% | -33.6% |
| ResMed Inc. (RMD) | $36.41 | +$0.91 | +2.6% | +6.0% | -4.1% |
Today's worst ASX Top 300 losers
Company | Last Price | Change $ | Change % | 1mo % | 1yr % |
|---|---|---|---|---|---|
| The a2 Milk Company (A2M) | $6.45 | -$0.80 | -11.0% | -5.4% | -30.0% |
| Metals X (MLX) | $1.38 | -$0.16 | -10.4% | -18.8% | +68.3% |
| Ridley Corporation (RIC) | $2.45 | -$0.22 | -8.2% | -6.1% | -8.2% |
| Develop Global (DVP) | $2.90 | -$0.26 | -8.2% | -29.3% | -12.9% |
| Emerald Resources NL (EMR) | $6.07 | -$0.54 | -8.2% | -8.6% | +18.1% |
| Paladin Energy (PDN) | $6.19 | -$0.55 | -8.2% | -15.4% | -22.6% |
| Kingsgate Consolidated (KCN) | $3.57 | -$0.30 | -7.8% | -24.5% | -15.0% |
| Evolution Mining (EVN) | $10.88 | -$0.86 | -7.3% | -13.7% | -1.4% |
| Catapult Sports (CAT) | $2.68 | -$0.21 | -7.3% | -16.5% | -39.9% |
| Resolute Mining (RSG) | $1.04 | -$0.08 | -7.1% | -6.7% | 0.0% |
| Nufarm (NUF) | $3.06 | -$0.22 | -6.7% | -1.0% | +29.1% |
| Glencore plc (GLC) | $8.95 | -$0.64 | -6.7% | -19.8% | -20.3% |
| Greatland Resources (GGP) | $9.02 | -$0.61 | -6.3% | -9.3% | +17.3% |
| Ramelius Resources (RMS) | $3.26 | -$0.22 | -6.3% | -10.9% | -5.2% |
| Macmahon Holdings (MAH) | $0.815 | -$0.055 | -6.3% | -24.5% | +45.5% |
| PYC Therapeutics (PYC) | $1.63 | -$0.105 | -6.1% | -14.7% | +22.3% |
| GR Engineering Services (GNG) | $6.69 | -$0.43 | -6.0% | -8.0% | +67.7% |
| Benz Mining Corp (BNZ) | $3.61 | -$0.23 | -6.0% | -11.1% | +172.5% |
| South32 (S32) | $4.01 | -$0.25 | -5.9% | -13.4% | +28.5% |
| Alkane Resources (ALK) | $1.605 | -$0.10 | -5.9% | -9.8% | +65.5% |
Chartwatch
Nasdaq Composite Index
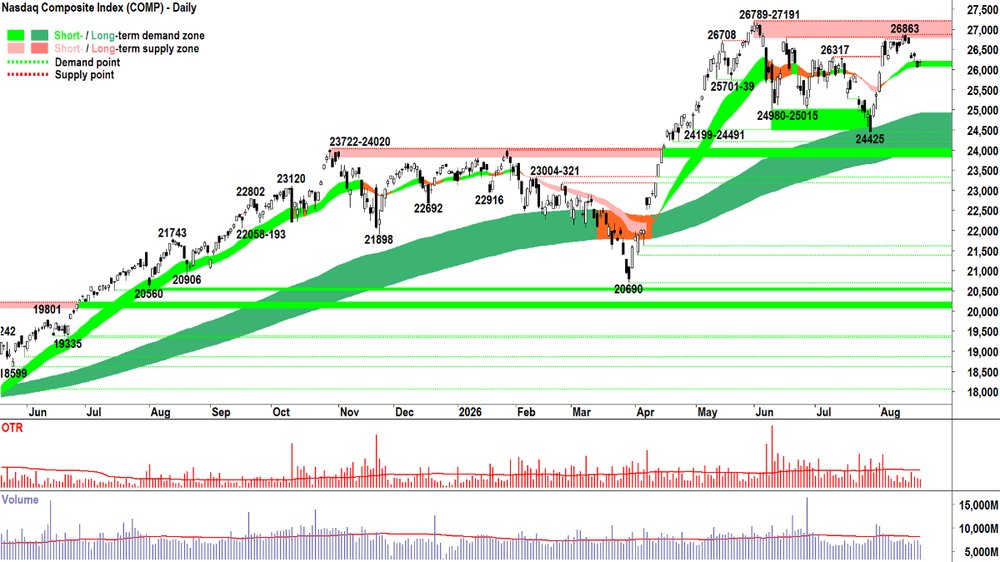
Nasdaq Composite Index chart
Analysis
Another downward pointing shadow into the 23989-24020 demand zone. Signs of hope for the bulls? 🙏
Obviously, absolutely everything else on the Comp’s chart above is a trainwreck 💥🚂
But… I kinda feel there’s a bounce coming tonight. Call it intuition… whatever… 🔮
Regardless, it counts for nothing. Because I never trade on intuition and hunches. Been there. Done that. It didn’t end well.
Now I trade based solely on evidence: D vs S = P. Balance of evidence, more specifically.
Each candle I ask: Who’s winning the battle as per trends, price action, candles, volatility, and volume? 🤔
If it’s the demand side, then I can either maintain or add risk. If it’s the supply side, then I can reduce risk.
A couple of downward pointing shadows is interesting, but it’s not control. Not yet!
View
Analyse remains: ⚠️⚠️⚠️⚠️⚠️⚠️
Accept remains: S > D = P⬇️
Act remains: I'm at 1/3RP on US stocks (RP = Risk Position – it reflects my personal allowable capital allocation limit for my investments in US stocks. So, 1/3RP is 33%, 1/2RP is 50%, 2/3RP is 67% and FRP is 100%).
Key Levels
The long term trend ribbon is the closest (dynamic) zone of supply (presently 24913-25633) but the short term trend ribbon (presently 25441-25745) is likely the critical go-no-go for the current short term downtrend. There appears to be a substantial zone of potential latent demand between 23989-24425. If it goes... 20690?
S&P/ASX 200 (XJO)
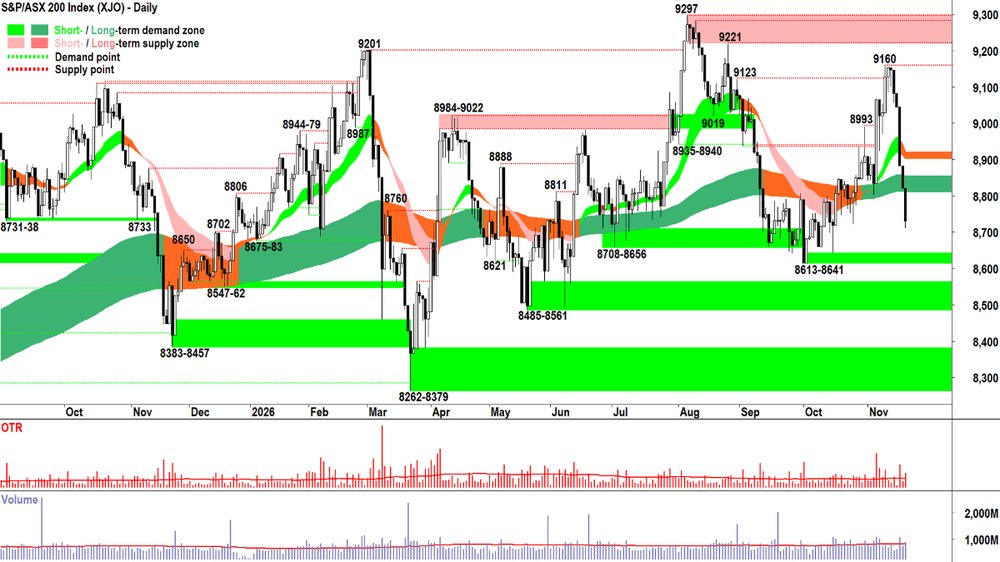
S&P/ASX 200 (XJO) chart
Analysis
Bloody OTP! Anyways. It is what it is. When life gives you a great big lemon 🍋
Um, not sure if that analogy really works here... as big a lemon as our beloved OTP is! 🤣
So, I'm not going to make lemonade, but I will do another checklist — because Analyse must happen every day!
ST Trend = ⚠️
Price is below the short term trend ribbon
Short term trend ribbon is amber = equilibrium
Short term trend ribbon is falling
Short term trend ribbon is not acting as a zone of dynamic demand, but is not YET acting a as a zone of dynamic supply (if it does, then ST Trend = Officially ⬇️)
LT Trend = ⚠️
Price is below the long term trend ribbon
Long term trend ribbon is green (the only tick in this section)
Long term trend ribbon is falling (today vs yesterday if you check the numbers)
Long term trend ribbon is not acting as a zone of dynamic demand, but is not YET acting a as a zone of dynamic supply (if it does, then ST Trend = Officially ⬇️)
Price action = ⚠️
Rising peaks and falling troughs (i.e., transition phase, but BTD has evaporated — hence the lower troughs... looks more like NUTE, FOHO)
Candles = ⚠️
5 x supply side (i.e., black bodied and or with upward pointing shadows)
Full black bodies with close at low also suggests BTD is non-existent, NUTE and FOHO
Volatility = ⚠️
Recent high volatility on supply-controlled days is concerning!
Volume = ⚠️
Oof! Nothing in the volume suggests that the demand side has swept in to dislodge panicked supply and that we're back to BTD
⚠️⚠️⚠️⚠️⚠️⚠️ = S > D = MOTN P ⬇️
So I suggest that some caution is required here! ST and LT trends still needs some extra confirmation, so too does price action (lower peak to 9160 to confirm STR). So as bad as the last few sessions are, I'll remind you I'm already a very conservative 1/2RP.
View
I remain comfortable at 1/2RP on Australian shares (i.e., 50% invested vs 50% cash, with some of the invested portion allocated to shorts).
Key Levels
9160 is the closest point of supply, but the trend ribbons will now likely begin to act as dynamic zones of excess supply. 8613-8641 is the next critical zone of demand.
(Glossary of acronyms! Old Tin Pot (OTP): S&P/ASX 200 | MOTN: More Often Than Not | FOMO: Fear Of Missing Out | HOFU: Holding On For Upside | BTD: Buy The Dip | NUTE: No Urgency To Enter | FOHO: Fear Of Holding On | STR: Sell The Rally | RP: Risk Position | FFS: Fund Flow Shenanigans!)
***CHARTWATCH LIVE — NEW VIDEO DROPPED!!! 📺***
ChartWatch LIVE Webinars – WEEKLY Wednesday's @ 12pm AEDT
Learn more about technical analysis and trend following through real case studies on ASX stocks. Australia's premier technical analyst, Carl Capolingua, shares his unique insights on stocks as requested by viewers. Ask about a company in your portfolio or anything related to trading and investing and get Carl's expert opinion.
Places are limited so >REGISTER NOW!<
Economy
TODAY
AUS October Employment Data
Change: -43,500 vs +25,200 forecast and -39,300 in September (Part-time employment -40,600 vs full-time employment -2,900)
Rate: 4.9% vs 4.7% forecast, unchanged vs September
Reader: Substantially weaker than expected. Part time jobs are usually the first to go in any labour downturn cycle, so the fact that only 2,900 full time positions were lost is cold comfort. Youth unemployment rose to 11.3% from 11.1%, the highest since October 2021. Consider that 59,000 jobs have now been lost from the Aussie economy since July. The RBA told us that they were prepared for unemployment to rise if it meant bringing down inflation... well, it seems the first part of the equation is underway... let's hope the second is to follow! 🤞
LATER THIS WEEK
FRIDAY
12:00 People's Bank of China ("PBOC") Loan Prime Rate ("LPR")
1-year LPR: 3.00% p.a. forecast, unchanged
5-year LPR: 3.50% p.a. forecast, unchanged
Interesting Movers
Trading higher
- Omega Oil & Gas (OMA) $0.72+21.0%
Announced wireline logging and evaluation results at Canyon North‑1 (ATP 2081 JV). The well intersected a 1,129m gross oil and gas‑bearing sequence with 191m net pay across six reservoir intervals. Results said to validate and further de‑risk the project's geological model. Canyon North‑2 due to commence in late November, followed by horizontal drilling and flow testing in 1H 2027.
- Chrysos Corporation (C79) $6.70+9.3%
Issued a trading update. Management reported revenue for July–October of $36.7 million, up 27% vs the pcp, comprising $22.6 million Minimum Monthly Assay Payments, $13.7 million Additional Assay Charges and $0.3 million other revenue.
- Sonic Healthcare (SHL) $21.33+6.3%
Issued a trading update at its AGM held today. Management reaffirmed FY27 EBITDA guidance of $1,950–A$2,030 million (constant currency), excluding ~$30 million of back-office IT systems transformation costs, noting strong organic growth and momentum in advanced diagnostics, direct-to-consumer testing and specialist referrals.
- Fortifai (FTI) $0.41+3.9%
Announced that Chief Revenue Officer Jason Brushe has been appointed Chief Executive Officer, effective 23 November 2026.
Trading Lower
- Echo IQ (EIQ) $0.28-42.1%
Announced that the US FDA has completed supervisory review and upheld the “not substantially equivalent” determination for EchoSolv HF. Management said that it is evaluating options with US regulatory and legal advisors including engaging with the FDA, a new 510(k) submission, and further FDA review procedures.
- The a2 Milk Company (A2M) $6.45-11.0%
Issued a trading update at its AGM held today. Management noted that estimated offtake of China‑label infant formula has recovered to about 50% of pre‑supply chain disruption levels (up from ~40% in August); recovery described as "gradual" as the company rebuilds its user base.
- Kantra Copper (KAN) $0.85-9.1%
No news. Performance reflected general weakness in the broader copper sector.
- Develop Global (DVP) $2.90-8.2%
Held its AGM today. Performance reflected general weakness in the broader materials sector. DVP is a regular in the ChartWatch ASX Scans Downtrends List. 📉
- Paladin Energy (PDN) $6.19-8.2%
No news. Performance reflected general weakness in the broader uranium sector. PDN is a regular in the ChartWatch ASX Scans Downtrends List. 📉
- Skinkandy (SK1) $2.56-4.5%
Issued a trading update at its AGM held today. Management reported a 21% jump in revenue for the first 19 weeks to Nov 14 vs the prior corresponding period. Studios opened since the May IPO are “trading in line with expectations,” gross margins “broadly consistent” with last year. Nine new studios opened so far in 2026-27 and management expects 18–20 for the full year. Plans to enter South Africa have “well progressed.”
Broker Moves
Company | Broker | Action | Rating | Price Target |
|---|---|---|---|---|
APXAppen | Canaccord Genuity | Upgraded | Buy(from Speculative Buy) | $2.75(from $2.60) |
AS1Asara Resources | Canaccord Genuity | Retained | Speculative Buy | $0.35 |
AUEAurum Resource | Canaccord Genuity | Retained | Speculative Buy | $1.50 |
AYAArtrya | Morgans | Retained | Speculative Buy | $4.70(from $4.25) |
BREBrazilian Rare Earths | Ord Minnett | Retained | Speculative Buy | $6.80 |
CARCAR Group | UBS | Retained | Buy | $34.50 |
CATCatapult Sports | Morgans | Retained | Buy | $5.05(from $5.40) |
CGFChallenger | Citi | Retained | Buy | $13.20 |
CIAChampion Iron | UBS | Retained | Buy | $3.10 |
DLIDelta Lithium | Bell Potter | Retained | Speculative Buy | $0.30(from $0.41) |
EQREQ Resources | Canaccord Genuity | Retained | Buy | $0.55 |
G6MGroup 6 Metals | Canaccord Genuity | Retained | Buy | $4.60 |
GTKGentrack Group | Bell Potter | Retained | Buy | $5.70 |
IMRImricor Medical Systems Inc | Ord Minnett | Initiated | Speculative Buy | $3.20 |
INAIngenia Communities Group | Citi | Retained | Neutral | $5.50 |
LLCLendLease Group | Citi | Retained | Neutral | $3.10 |
NUFNufarm | Citi | Retained | Neutral | $3.30 |
| Macquarie | Retained | Neutral | $2.90 | |
| UBS | Retained | Buy | $3.60 | |
PXAPEXA Group | Ord Minnett | Retained | Buy | $9.30(from $10.15) |
| UBS | Retained | Buy | $8.25 | |
REAREA Group | UBS | Retained | Neutral | $184.00 |
RHCRamsay Health Care | Citi | Retained | Neutral | $55.50(from $49.00) |
RICRidley Corporation | Canaccord Genuity | Retained | Buy | $3.35(from $3.60) |
| UBS | Retained | Buy | $3.20(from $3.25) | |
SEKSEEK | Bell Potter | Upgraded | Buy(from Hold) | $15.00(from $13.60) |
| Macquarie | Retained | Neutral | $13.75 | |
| UBS | Retained | Buy | $19.70 | |
SHLSonic Healthcare | Citi | Retained | Neutral | $22.00 |
SKGStorage King Group | Ord Minnett | Retained | Hold | $1.30(from $1.25) |
SVRSolvar | Morgans | Upgraded | Buy(from Accumulate) | $1.65(from $1.78) |
TEATasmea | Canaccord Genuity | Retained | Buy | $11.76(from $11.39) |
TUATuas | Citi | Retained | Buy | $2.30(from $2.95) |
WJLWebjet Group | Morgans | Retained | Hold | $0.30(from $0.40) |
WOWWoolworths Group | Macquarie | Retained | Underperform | $35.90 |
| Ord Minnett | Retained | Lighten | $37.00 | |
| UBS | Retained | Sell | $40.00(from $39.50) |
Scans
Top Gainers
Code | Company | Last | % Chg |
|---|---|---|---|
| DXN | DXN Ltd | $0.215 | +30.30% |
| RGT | Argent Biopharma Ltd | $0.023 | +27.78% |
| PRB | Parbo Resources Ltd | $0.335 | +24.07% |
| OMA | Omega Oil & Gas Ltd | $0.72 | +21.01% |
| EDE | Eden Innovations Ltd | $0.055 | +19.57% |
Top Fallers
Code | Company | Last | % Chg |
|---|---|---|---|
| EIQ | Echoiq Ltd | $0.275 | -42.11% |
| TIO | Temas Resources Corp | $0.035 | -30.00% |
| ZNC | Zenith Minerals Ltd | $0.042 | -27.59% |
| AMO | Ambertech Ltd | $0.066 | -26.67% |
| KYN | Kyron Capital Group | $0.02 | -23.08% |
52 Week Highs
Code | Company | Last | % Chg |
|---|---|---|---|
| PRB | Parbo Resources Ltd | $0.335 | +24.07% |
| CLG | Close the Loop Ltd | $0.051 | +13.33% |
| CLV | Clover Corporation Ltd | $1.20 | +8.11% |
| MHK | Metal Hawk Ltd | $0.135 | +3.85% |
| MCY | Mercury NZ Ltd | $5.67 | +3.47% |
52 Week Lows
Code | Company | Last | % Chg |
|---|---|---|---|
| TIO | Temas Resources Corp | $0.035 | -30.00% |
| ZNC | Zenith Minerals Ltd | $0.042 | -27.59% |
| RTR | Rumble Resources Ltd | $0.016 | -20.00% |
| AAM | Aumega Metals Ltd | $0.025 | -16.67% |
| AVM | Advance Metals Ltd | $0.029 | -14.71% |
Near Highs
Code | Company | Last | % Chg |
|---|---|---|---|
| BEAR | Betashares Australian Equities Bear Complex ETF | $7.54 | +1.21% |
| RHC | Ramsay Health Care Ltd | $54.41 | +1.55% |
| OZBD | Betashares Australian Composite Bond ETF | $43.60 | +0.69% |
| AN3PI | Australia and New Zealand Banking Group Ltd | $102.90 | -0.13% |
| PCI | Perpetual Credit Income Trust | $1.085 | -0.46% |
Relative Strength Index (RSI) Oversold
Code | Company | Last | % Chg |
|---|---|---|---|
| CCL | Cuscal Ltd | $5.38 | -2.54% |
| KAR | Karoon Energy Ltd | $1.43 | -4.67% |
| CSC | Capstone Copper Corp | $9.11 | -3.29% |
| MRT | Maritana Minerals Ltd | $0.445 | -7.29% |
| GQG | GQG Partners Inc | $0.57 | -3.39% |