
The ASX 200 finished flat as the big funds played defence, dumping mining stocks and piling into the market’s safer corners. Banks, property, healthcare and telcos did the heavy lifting, while gold, lithium and uranium stocks copped a hiding.
Be sure to click/scroll through for the usual reporting of the major sector and stock-specific moves, the broker responses to them, as well as all the key economic data in tonight's Evening Wrap. Also, I have detailed technical analysis on the Nasdaq Composite and the S&P/ASX 200 in today's ChartWatch.
Let’s dive in!
Today in Review
Name | Value | % Chg |
|---|---|---|
Major Indices | ||
| ASX 200 | 9,146.8 | -0.07% |
| All Ords | 9,274.2 | -0.18% |
| Small Ords | 3,289.1 | -0.99% |
| All Tech | 3,060.1 | -0.42% |
| Emerging Companies | 2,822.5 | -1.46% |
Currency | ||
| AUD/USD | 0.6834 | -0.20% |
US Futures | ||
| S&P 500 | 7,604.75 | -0.47% |
| Dow Jones | 52,619.0 | +0.08% |
| Nasdaq | 28,145.25 | -1.15% |
Name | Value | % Chg |
|---|---|---|
Sector | ||
| Financials | 9,881.6 | +1.10% |
| Health Care | 35,475.7 | +0.61% |
| Real Estate | 3,555.0 | +0.60% |
| Communication Services | 1,652.4 | +0.43% |
| Industrials | 8,621.9 | +0.40% |
| Information Technology | 1,836.7 | +0.25% |
| Energy | 10,443.6 | +0.10% |
| Consumer Discretionary | 3,816.5 | -0.26% |
| Consumer Staples | 13,745.9 | -0.27% |
| Utilities | 10,645.8 | -1.03% |
| Materials | 23,285.3 | -2.08% |
ASX 200 Intraday Chart
Markets
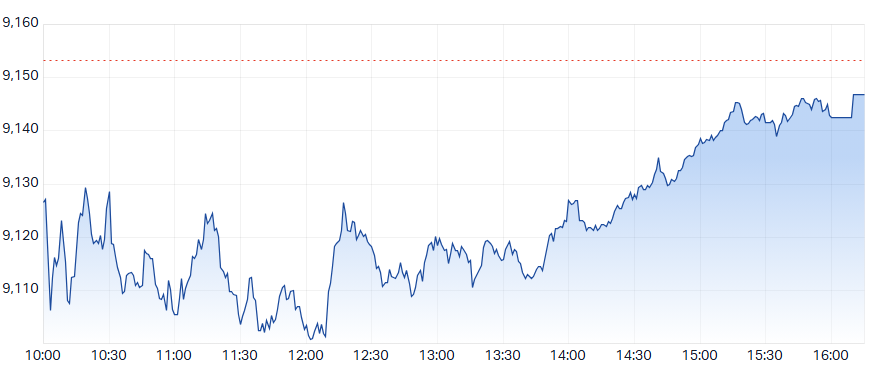
The S&P/ASX 200 (XJO) finished 6.4 points lower at 9,146.8, 0.5% from its session low and smack–bang on its session high. Despite the recovery from the opening lows at benchmark level, in the broader-based S&P/ASX 300 (XKO) advancers lagged decliners by 118 to 164.
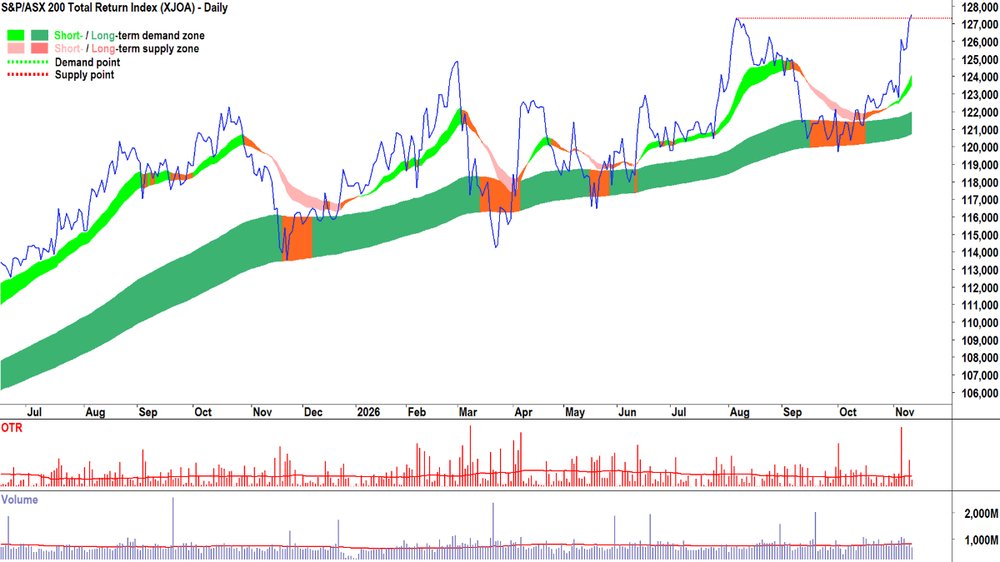
I forgot to mention yesterday — and to be fair, the mainstream financial media never picks up on this anyway — but once dividends are added back, the Old Tin Pot notched a new record high yesterday. 🥳
Yeah, that's right — Aussie investors have never had it so good! 😉
S&P/ASX 200 Total Return (XJOA) chart
Sure it doesn't feel that way, because the rising tide rarely lifts all ships within our beloved OTP. Take for example today's rob Peter to pay Paul performance...
S&P/ASX 200 Financials Sector Index (XFJ) intraday chart
S&P/ASX 200 Materials Sector Index (XMJ) intraday chart
One up. One down. All makes sense in the world! 🤦
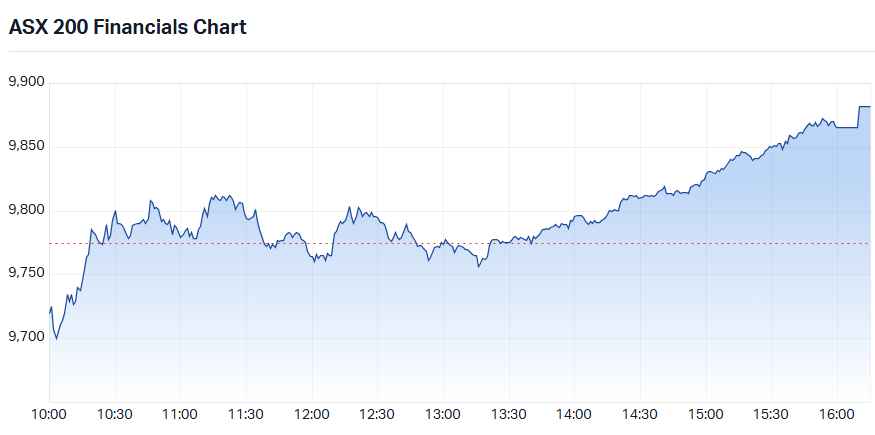
The defensive rotation was broad-based. Financials (XFJ) (+1.1%) led the charge, with Commonwealth Bank of Australia (CBA) (+2.9%) rebounding from Wednesday’s sell-off despite news the corporate regulator is suing the lender, and Westpac Banking Corporation (WBC) (+1.9%) also firmer. A-REIT (XPJ) (+0.6%) gains came via GPT Group (GPT) (+2.8%) and Mirvac Group (MGR) (+1.3%). In Health Care (XHJ) (+0.6%), Cochlear (COH) (+1.5%) and CSL (CSL) (+1.4%) advanced, while utility-like telcos lifted Communication Services (XTJ) (+0.4%), led by TPG Telecom (TPG) (+1.8%) and Telstra Group (TLS) (+0.8%).
The Gold Sub-Index (XGD) (-3.6%) was the worst performer as US bond yields surged overnight, with the 10-year Treasury yield jumping back to 5% in a continued negative reaction to Tuesday’s hotter-than-expected US inflation data. Gold pays no income, so higher yields on safe government bonds raise the opportunity cost of holding it. COMEX gold futures fell 0.7% overnight and a further 0.4% to US$3,984.30/oz in Asian trade. Genesis Minerals (GMD) (-5.4%) and Ora Banda Mining (OBM) (-5.3%) were hardest hit, while Black Cat Syndicate (BC8) (-4.5%) and Evolution Mining (EVN) (-4.2%) also fell sharply.
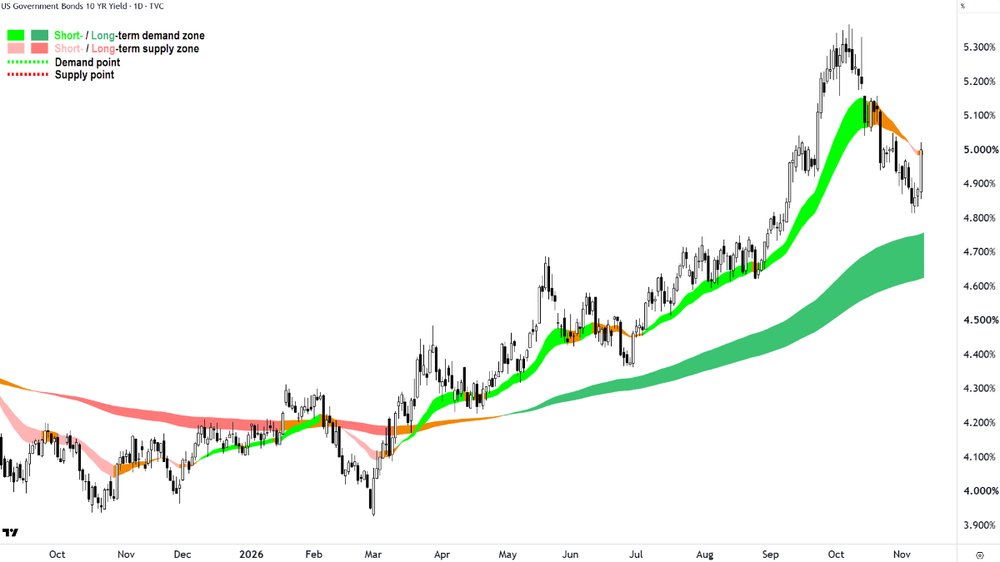
US 10-Year T-Bond Yield chart
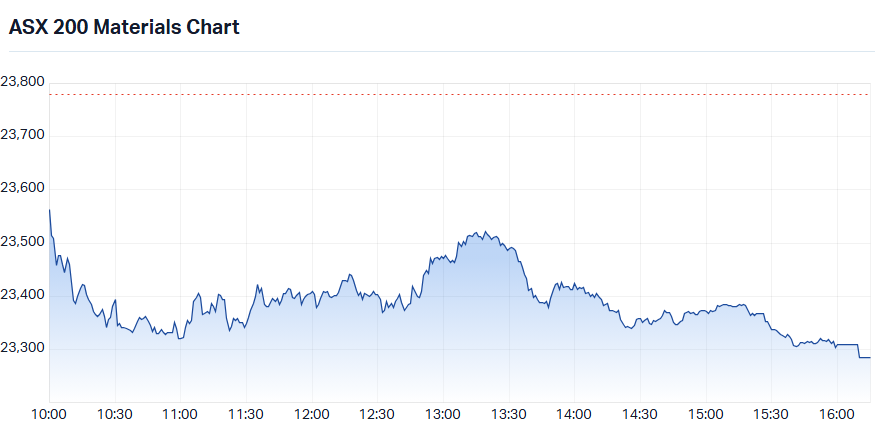
Materials (XMJ) (-2.1%) was hit by sharply weaker iron ore and copper prices in Asian trade. SGX iron ore futures fell 1.6% to US$90.60/t, dragging Champion Iron (CIA) (-4.1%) and Fortescue (FMG) (-2.4%) lower, with Rio Tinto (RIO) (-2.1%) also weaker.
Copper stocks were also under pressure. Copper lost 0.8% on the London Metal Exchange overnight, and COMEX copper futures fell a further 1.1% to US$6.219/lb in Asian trade, weighing on Sandfire Resources (SFR) (-2.4%). Diversified miner South32 (S32) (-1.9%) also fell, despite gains in aluminium and zinc on the LME.
Rare earths stocks fell hard on only a modest dip in NdPr, the neodymium-praseodymium oxide used in permanent magnets, which slipped 0.5% to CNY 716,500/t in China. Lynas Rare Earths (LYC) (-4.2%) and Iluka Resources (ILU) (-2.7%) were the main casualties.
In other commodities moves, lithium and uranium, the two most volatile corners of the resources sector, were at it again. Both groups have been swinging wildly within their two-month downtrends, punctuated by sharp short-covering rallies, which happen when traders who bet on falling prices rush to buy shares back. Today, without any major commodity price moves, both were hammered.
GFEX lithium carbonate futures in China slipped just 0.2% to CNY 88,740/t in Asian trade, yet lithium stocks were smashed. Elevra Lithium (ELV) (-8.4%) and PLS Group (PLS) (-8.1%) led the rout, with Liontown (LTR) (-7.0%) and Vulcan Energy Resources (VUL) (-7.0%) close behind. Core Lithium (CXO) (-5.6%) and Mineral Resources (MIN) (-5.2%) also fell. IGO (IGO) (-5.1%) lost ground too.
Uranium stocks took similar punishment, as benchmark uranium futures on COMEX dipped just 0.6% to US$90.50/lb overnight. Boss Energy (BOE) (-9.4%), Deep Yellow (DYL) (-7.4%), and Lotus Resources (LOT) (-7.3%) led losses, but NexGen Energy (NXG) (-4.0%), Bannerman Energy (BMN) (-3.9%) and uranium enrichment technology developer Silex Systems (SLX) (-6.3%) were also caught in the sell-off.
Today's best ASX Top 300 gainers
Company | Last Price | Change $ | Change % | 1mo % | 1yr % |
|---|---|---|---|---|---|
| Domino's Pizza Enterprises (DMP) | $25.06 | +$2.87 | +12.9% | +12.9% | +30.4% |
| Xero (XRO) | $75.17 | +$4.31 | +6.1% | +25.7% | -46.3% |
| The Star Entertainment Group (SGR) | $0.175 | +$0.01 | +6.1% | +40.0% | +98.9% |
| AUB Group (AUB) | $32.04 | +$1.54 | +5.0% | +14.0% | -17.3% |
| Tuas (TUA) | $1.57 | +$0.07 | +4.7% | -5.1% | -77.1% |
| Orica (ORI) | $23.82 | +$1.02 | +4.5% | +3.3% | +4.4% |
| FDC Consolidated Holdings (FDC) | $3.78 | +$0.15 | +4.1% | -3.3% | +26.0% |
| Summerset Group Holdings (SNZ) | $5.21 | +$0.19 | +3.8% | +0.2% | -50.4% |
| Breville Group (BRG) | $33.42 | +$1.12 | +3.5% | +7.6% | +9.2% |
| Service Stream (SSM) | $2.15 | +$0.07 | +3.4% | -3.2% | -5.7% |
| Commonwealth Bank of Australia (CBA) | $171.76 | +$4.82 | +2.9% | +15.1% | +8.4% |
| IRESS (IRE) | $5.91 | +$0.16 | +2.8% | +5.2% | -36.2% |
| GPT Group (GPT) | $5.22 | +$0.14 | +2.8% | +14.7% | -7.9% |
| Glencore plc (GLC) | $10.30 | +$0.27 | +2.7% | -8.3% | -8.3% |
| Collins Foods (CKF) | $9.35 | +$0.24 | +2.6% | +11.3% | -15.5% |
| Superloop (SLC) | $2.58 | +$0.06 | +2.4% | +2.4% | -16.5% |
| NIB Holdings (NHF) | $7.06 | +$0.16 | +2.3% | +6.6% | -6.5% |
| Life360 Inc (360) | $21.28 | +$0.47 | +2.3% | +4.6% | -46.5% |
| Inghams Group (ING) | $2.28 | +$0.05 | +2.2% | +8.6% | -6.2% |
| Judo Capital Holdings (JDO) | $0.955 | +$0.02 | +2.1% | +7.9% | -39.2% |
Today's worst ASX Top 300 losers
Company | Last Price | Change $ | Change % | 1mo % | 1yr % |
|---|---|---|---|---|---|
| GQG Partners Inc. (GQG) | $0.71 | -$0.07 | -9.0% | -36.6% | -51.0% |
| Minerals 260 (MI6) | $0.805 | -$0.075 | -8.5% | -2.4% | +172.9% |
| PLS Group (PLS) | $2.85 | -$0.25 | -8.1% | -18.6% | -16.9% |
| Brightstar Resources (BTR) | $0.685 | -$0.055 | -7.4% | +3.8% | +50.5% |
| Forrestania Resources (FRS) | $0.32 | -$0.025 | -7.2% | 0.0% | +60.0% |
| St Barbara (SBM) | $0.705 | -$0.055 | -7.2% | -10.8% | +28.2% |
| Liontown (LTR) | $0.665 | -$0.05 | -7.0% | -13.6% | -49.4% |
| Sunrise Energy Metals (SRL) | $13.03 | -$0.97 | -6.9% | -24.0% | +213.2% |
| PDI Gold (PDI) | $4.63 | -$0.32 | -6.5% | +3.6% | +69.9% |
| Benz Mining Corp (BNZ) | $4.25 | -$0.29 | -6.4% | -7.0% | +181.5% |
| Silex Systems (SLX) | $3.25 | -$0.22 | -6.3% | -19.0% | -66.2% |
| Arafura Rare Earths (ARU) | $0.15 | -$0.01 | -6.2% | -9.1% | -43.4% |
| Genesis Minerals (GMD) | $7.40 | -$0.42 | -5.4% | +0.4% | +19.5% |
| Ora Banda Mining (OBM) | $1.505 | -$0.085 | -5.3% | +3.1% | +27.5% |
| Vault Minerals (VAU) | $6.10 | -$0.34 | -5.3% | +0.3% | +19.5% |
| Mineral Resources (MIN) | $47.25 | -$2.61 | -5.2% | -4.3% | -7.8% |
| IGO (IGO) | $5.19 | -$0.28 | -5.1% | -14.6% | -11.0% |
| Wagners Holding Company (WGN) | $4.74 | -$0.25 | -5.0% | +2.4% | +44.1% |
| Kingsgate Consolidated (KCN) | $4.27 | -$0.21 | -4.7% | -9.7% | -6.8% |
| Capricorn Metals (CMM) | $13.87 | -$0.68 | -4.7% | -5.9% | -2.3% |
Chartwatch
Nasdaq Composite Index
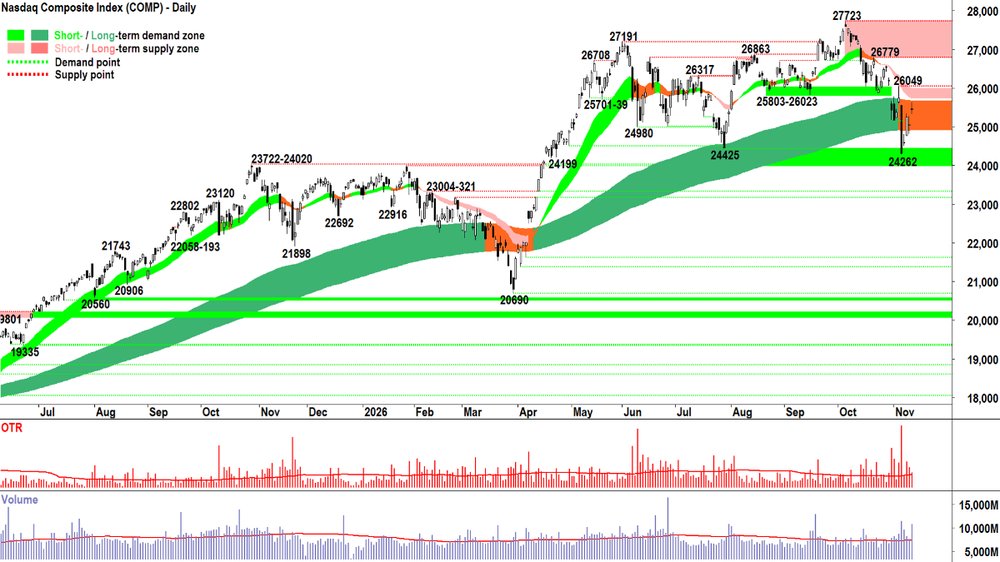
Nasdaq Composite Index chart
Analysis
Another close-to-open pop. Another less-than-convincing close (i.e., the upward pointing shadow – making it 3 of the last 4 Comp candles that have done this).
It's going up... sure... but it's fighting a wall of supply all the way.
If you want evidence of this, check last night's volume bar. Significantly above average. The demand side was large... the price rose... yep, okay... but supply remained active (and more than just a little motivated as evidenced by that upward pointing shadow!).
There's a couple ways this can play out:
Wednesday's volume represents real supply removal... i.e., potentially dead wood / "the end is nigh" supply is being removed from the system by a rejuvenated demand side. By definition, this lot is now in cash — and they could end up being an important source of latent demand if prices keep rising... A Mar-Apr style V-shaped reversal is underway, and there's more demand where last night's came from. The candles and price action will bear this out very soon — enticing in more and more FOMO buyers in from the sidelines (including us!). Supply realises the low is indeed in, and it flips from FOHO to HOFU... Up we go 🚀💪!
This fledgling rally has found STR supply. They're just getting started. The short and long term trend ribbons just happened to be where they were lurking, lying in wait for the BTD price and liquidity to hit — allowing them to offload their massive positions. They know the worst is still yet to come. They're confident they'll be able to buy back at much lower prices down the track. Their persistent selling creates black-bodied candles and or those with upward pointing shadows within the trend ribbons. BTD demand is soon exhausted... and sensing this... The supply side grows even more motivated with respect to the price it will accept to get the hell out! 24262 is retested... and possibly worse ⚠️😱!
Which scenario is going to play out? 🤔
Beats me. Can't tell the future, remember? 🤷
But can I suggest that the next few sessions are going be: Super important + Super interesting! 🍿
Where's the MOTN lie? That one is in my wheelhouse, and I suggest there's more evidence in the technicals that 2 is a MOTN prospect than 1.
So stay on your toes! 😉
View
I'm at 1/3RP on US stocks (RP = Risk Position – it reflects my personal allowable capital allocation limit for my investments in US stocks. So 1/2RP is 50%, 2/3RP is 67% and FRP is 100%).
Key Levels
The long term trend ribbon is the closest (dynamic) zone of supply (presently 24916-25679) but the short term trend ribbon (presently 25743-25994) is likely the critical go-no-go for the current short term downtrend. There appears to be a substantial zone of potential latent demand between 23722-24425.
S&P/ASX 200 (XJO)
Analysis
Nothing to see here. Move on.
No change to the prior analysis. Refer to yesterday's checklist — same ticks in the same boxes!
Trends: ST/LT Trend ⬆️/⬆️ ✅
Price action: Rising peaks & rising troughs (BTD, FOMO, HOFU) ✅
Candles: Predominantly demand side in nature (white bodies and or downward pointing shadows) ✅
Volatility: Low downside vs high upside ✅
Volume: Above average on recent demand side bars suggests supply removal ✅
✅✅✅✅✅ = MOTN P⬆️
View
I am at 2/3RP on Australian shares (i.e., 67% invested vs 33% cash, with some of the invested portion allocated to shorts). Happy to use the full risk allocation if I can find suitable setups.
Key Levels
9221-9297 is the closest zone of supply. The short term trend ribbon is the closest zone of (dynamic) demand (presently 8886-8921).
(Glossary of acronyms! Old Tin Pot (OTP): S&P/ASX 200 | MOTN: More Often Than Not | FOMO: Fear Of Missing Out | HOFU: Holding On For Upside | BTD: Buy The Dip | NUTE: No Urgency To Enter | FOHO: Fear Of Holding On | STR: Sell The Rally | RP: Risk Position | FFS: Fund Flow Shenanigans!)
***CHARTWATCH LIVE — NEW VIDEO DROPPED!!! 🚨📺***
ChartWatch LIVE Webinars – WEEKLY Wednesday's @ 12pm AEDT
Learn more about technical analysis and trend following through real case studies on ASX stocks. Australia's premier technical analyst, Carl Capolingua, shares his unique insights on stocks as requested by viewers. Ask about a company in your portfolio or anything related to trading and investing and get Carl's expert opinion.
Places are limited so >REGISTER NOW!<
Economy
TODAY
There weren't any major economic news announcements in our time zone today.
LATER THIS WEEK
THURSDAY
00:00 USA All Day — markets closed for Veterans Day
FRIDAY
02:30 AUS CB Leading Index m/m
05:01 USA 30-year bond auction
SATURDAY
00:30 USA October Core PPI (+0.3% m/m forecast vs +0.7% m/m in September)
Interesting Movers
Trading higher
- G8 Education (GEM) $0.19+90.0%
Announced that it had entered into a process deed with Melbourne asset manager Majority Capital Partners after it offered to acquire GEM via a scheme of arrangement for $0.26 per share. Majority will be granted exclusivity to conduct due diligence for up to six weeks.
- Clarity Pharmaceuticals (CU6) $2.05+23.5%
Announced the US FDA has granted the company's 64Cu-SAR-bisPSMA a "Breakthrough Therapy" designation.
- Acrow (ACF) $1.07+16.3%
Issued a trading update at its AGM held today. Management upgraded FY27 revenue guidance to $440–470 million (previously $410–430 million) and underlying EBITDA guidance to $110–120 million (previously $105–115 million), representing growth of 43% on FY26 at the mid-point. Capex forecast unchanged. Net debt/EBITDA expected to reduce to c.1.3x by FY27 year-end.
- Domino's Pizza Enterprises (DMP) $25.06+12.9%
No news today. Arguably a delayed positive response to yesterday's trading update and AGM addresses. DMP is a recent regular in the ChartWatch ASX Scans Uptrends List. 📈
- Xero (XRO) $75.17+6.1%
Released first half FY27 results. Revenue for the half rose 46% to $1.7 billion while NPAT slid 86% to $18.5 million after incorporating loss-making Melio. Management upgraded full-year revenue guidance to $3.7–$3.8 billion, and adjusted EBITDA to $880–$920 million. $1 billion share buy-back plan also announced.
- AUB Group (AUB) $32.04+5.0%
Issued a trading update at its AGM held today. Management noted a "positive start" to FY27 and updated underlying NPAT guidance to $245–$250 million a ~14% increase at the midpoint vs FY26.
- Orica (ORI) $23.82+4.5%
Released FY26 results. NPAT rose 9% to $589.7 million on a 1% increase in revenue to $8.2 billion. Final dividend 35.5¢ a share unfranked. Management credited performance to strong global customer demand, robust activity across gold and copper mining, and sustained commercial discipline.
Trading Lower
- Boss Energy (BOE) $1.50-9.4%
Substantial share holder notice stating that State Street Corporation increased its stake in the company to 12.64% from 11.46%. The substantial holding appears largely attributable to securities-lending activity – potentially including the facilitation of short selling – rather than a conventional investment stake.
- Adairs (ADH) $1.32-9.3%
No news today. Arguably a delayed positive response to yesterday's trading update and AGM addresses.
- GQG Partners Inc. (GQG) $0.71-9.0%
No news today. Arguably a continued negative response to yesterday's October FUM update, where it became clear that investors had withdrawn US$6.7 billion in the month (US$32.9 billion outflows year-to-date). Barrenjoey downgraded its rating on the stock from overweight to neutral.
- Silex Systems (SLX) $3.25-6.3%
Announced that Vanguard Group had ceased to be a substantial holder of the company.
- Wagners Holding Company (WGN) $4.74-5.0%
Issued a trading update at its AGM held today. Management warned that increased clinker and shipping costs are expected to impact H2 earnings by as much as $5 million, and usual seasonality could reduce volumes (and earnings) by up to $3 million. First half FY27 EBIT guidance now $40–42 million and full-year EBIT guidance $72–76 million.
- Aristocrat Leisure (ALL) $65.02-1.3%
Released FY26 results. North America poker machine installations increased 6,500 to 82,000 units as market share rose 2.7% to 39%. NPAT rose 15% to $1.364 billion (+24% on a constant currency basis). CEO Trevor Croker to step down in April next year.
- Paladin Energy (PDN) $8.700.0%
Launched a fully underwritten equity raising comprising a $474 million ASX institutional placement and a C$50 million Canadian bought deal private placement (together $525 million). Management intends to invite eligible shareholders to a non‑underwritten SPP to raise up to a further $50 million. Trading was halted all day.
Broker Moves
Company | Broker | Action | Rating | Price Target |
|---|---|---|---|---|
ACFAcrow | Shaw and Partners | Retained | Buy | $1.45(from $1.35) |
ADHAdairs | Morgans | Retained | Buy | $1.70(from $1.80) |
| Ord Minnett | Retained | Hold | $1.62(from $1.70) | |
| UBS | Retained | Neutral | $1.50 | |
ALLAristocrat Leisure | Citi | Retained | Buy | $61.00 |
ANZANZ Group Holdings | UBS | Retained | Neutral | $39.50(from $39.00) |
APEEagers Automotive | Morgan Stanley | Retained | Overweight | $19.60(from $26.00) |
AUBAUB Group | Citi | Retained | Buy | $35.20 |
AZJAurizon Holdings | Ord Minnett | Retained | Hold | $3.70(from $3.40) |
BB1BlinkLab | Morgans | Retained | Speculative Buy | $1.76 |
BHPBHP Group | Macquarie | Retained | Neutral | $57.00 |
BJYBarrenjoey Group | Ord Minnett | Initiated | Accumulate | $9.45 |
BRGBreville Group | Macquarie | Retained | Outperform | $37.10 |
| UBS | Retained | Buy | $37.00 | |
CBACommonwealth Bank of Australia | Macquarie | Retained | Underperform | $112.00 |
| Morgan Stanley | Retained | Underweight | $125.00 | |
| Morgans | Retained | Sell | $119.27 | |
| Ord Minnett | Retained | Sell | $120.00 | |
CKFCollins Foods | Macquarie | Retained | Neutral | $8.60 |
COLColes Group | Macquarie | Retained | Outperform | $24.00 |
CPUComputershare | Citi | Retained | Neutral | $43.20 |
CTDCorporate Travel Management | Morgan Stanley | Retained | Equal Weight | $3.20 |
CXOCore Lithium | Barrenjoey | Retained | Overweight | $0.34 |
DMPDomino's Pizza Enterprises | Citi | Retained | Buy | $21.60 |
| Macquarie | Retained | Underperform | $19.30 | |
| UBS | Retained | Neutral | $24.00(from $23.00) | |
EDVEndeavour Group | Macquarie | Retained | Underperform | $2.50 |
FDCFDC Consolidated Holdings | Morgans | Upgraded | Buy(from Accumulate) | $4.25(from $4.27) |
FLTFlight Centre Travel Group | Citi | Retained | Neutral | $12.95(from $13.20) |
| Macquarie | Retained | Outperform | $14.79(from $15.07) | |
| Morgan Stanley | Downgraded | Equal Weight(from Overweight) | $13.50(from $15.00) | |
| Morgans | Downgraded | Accumulate(from Buy) | $13.91(from $14.25) | |
| UBS | Retained | Buy | $14.80(from $14.10) | |
GLCGlencore plc | Morgans | Initiated | Buy | $11.90 |
GYGGuzman Y Gomez | Macquarie | Retained | Neutral | $28.90 |
HVNHarvey Norman Holdings | Macquarie | Retained | Neutral | $4.20 |
IGOIGO | Citi | Retained | Neutral | $5.75(from $8.10) |
ILUIluka Resources | Barrenjoey | Retained | Overweight | $8.10 |
INGInghams Group | Macquarie | Retained | Underperform | $1.90 |
JBHJB Hi-Fi | Macquarie | Retained | Outperform | $87.00 |
LTRLiontown | Citi | Retained | Neutral | $0.75(from $1.05) |
MI6Minerals 260 | Bell Potter | Retained | Speculative Buy | $1.45 |
| Macquarie | Retained | Outperform | $1.30 | |
MTSMetcash | Macquarie | Retained | Outperform | $3.20 |
NCKNick Scali | Macquarie | Retained | Outperform | $15.20 |
NWLNetwealth Group | Ord Minnett | Retained | Buy | $23.00 |
NWSNews Corporation | Macquarie | Retained | Outperform | $47.75(from $49.75) |
NXGNexGen Energy (Canada) | Barrenjoey | Retained | Overweight | $14.80 |
NXTNEXTDC | Citi | Retained | Buy | $12.75 |
ORIOrica | Citi | Retained | Buy | $25.40 |
PLSPLS Group | Citi | Retained | Buy | $4.10(from $5.70) |
PMTPMET Resources Inc | Bell Potter | Retained | Speculative Buy | $0.60(from $0.97) |
PMVPremier Investments | Macquarie | Retained | Outperform | $15.70 |
PWHPWR Holdings | Morgans | Retained | Accumulate | $12.55 |
PXAPEXA Group | Macquarie | Retained | Outperform | $12.35(from $13.90) |
| Morgans | Retained | Hold | $7.03(from $7.12) | |
| UBS | Retained | Buy | $8.25(from $8.35) | |
QANQantas Airways | Morgan Stanley | Retained | Overweight | $11.80(from $12.80) |
SIGSigma Healthcare | Macquarie | Retained | Outperform | $3.10 |
SLCSuperloop | Ord Minnett | Retained | Buy | $2.96(from $2.97) |
SSMService Stream | Ord Minnett | Retained | Buy | $2.66(from $2.87) |
STNSaturn Metals | Canaccord Genuity | Retained | Speculative Buy | $0.90 |
SULSuper Retail Group | Macquarie | Retained | Neutral | $13.30 |
TPWTemple & Webster Group | Macquarie | Retained | Neutral | $4.55 |
TWETreasury Wine Estates | Macquarie | Retained | Neutral | $5.70 |
UNIUniversal Store Holdings | Macquarie | Retained | Outperform | $10.00 |
VTMVictory Metals | Shaw and Partners | Initiated | Buy | $2.15 |
WESWesfarmers | Macquarie | Retained | Outperform | $81.00 |
WOWWoolworths Group | Macquarie | Retained | Underperform | $35.90 |
XROXero | Citi | Retained | Buy | $91.55 |
Scans
Top Gainers
Code | Company | Last | % Chg |
|---|---|---|---|
| GEM | G8 Education Ltd | $0.19 | +90.00% |
| CX8 | Capability X Ltd | $0.29 | +45.00% |
| MHK | Metal Hawk Ltd | $0.13 | +23.81% |
| CU6 | Clarity Pharmaceuticals Ltd | $2.05 | +23.49% |
| LRM | Lion Rock Minerals Ltd | $0.018 | +20.00% |
Top Fallers
Code | Company | Last | % Chg |
|---|---|---|---|
| WRX | Western Ridge Resources Ltd | $0.046 | -25.81% |
| VNL | Vinyl Group Ltd | $0.033 | -23.26% |
| MEL | Metgasco Ltd | $0.014 | -22.22% |
| SCP | Scalare Partners Holdings Ltd | $3.80 | -21.49% |
| AWJ | Auric Mining Ltd | $0.20 | -18.37% |
52 Week Highs
Code | Company | Last | % Chg |
|---|---|---|---|
| CX8 | Capability X Ltd | $0.29 | +45.00% |
| FNR | Far Northern Resources Ltd | $0.20 | +14.29% |
| DMP | Domino's PIZZA Enterprises Ltd | $25.06 | +12.93% |
| MPL | Medibank Private Ltd | $5.47 | +2.05% |
| ZYUS | Global X S&P 500 High Yield Low Volatility ETF | $15.47 | +1.78% |
52 Week Lows
Code | Company | Last | % Chg |
|---|---|---|---|
| SHO | Sportshero Ltd | $0.032 | -17.95% |
| VBS | Vectus Biosystems Ltd | $0.05 | -16.67% |
| FUL | Fulcrum Lithium Ltd | $0.042 | -16.00% |
| CHW | Chilwa Minerals Ltd | $0.465 | -12.26% |
| SKK | Stakk Ltd | $0.015 | -11.77% |
Near Highs
Code | Company | Last | % Chg |
|---|---|---|---|
| EXUS | Betashares Global Shares Ex US ETF | $38.33 | +0.47% |
| NDIA | Global X India Nifty 50 ETF | $65.68 | +0.78% |
| RHC | Ramsay Health Care Ltd | $56.07 | +0.23% |
| OZBD | Betashares Australian Composite Bond ETF | $43.29 | -0.39% |
| AN3PI | Australia and New Zealand Banking Group Ltd | $102.898 | +0.01% |
Relative Strength Index (RSI) Oversold
Code | Company | Last | % Chg |
|---|---|---|---|
| GQG | GQG Partners Inc | $0.78 | -19.59% |
| FXG | FELIX Gold Ltd | $0.105 | 0.00% |
| SPL | Starpharma Holdings Ltd | $0.425 | +3.66% |
| IDX | Integral Diagnostics Ltd | $1.70 | -0.88% |
| SLD | Saluda Medical, Inc | $0.21 | -6.67% |